To save you the effort of reading the new SPI-M modelling papers released yesterday, I’ve gone through and taken some notes. Compared to last month (below), there’s now a lot more that we agree on, and only a few remaining points of difference. 1/ https://twitter.com/JamesWard73/status/1379701658813337602?s=20">https://twitter.com/JamesWard...
As before, here’s 10 important points to take away:
1. Their projected ‘exit wave’ is much smaller than before, with central estimates of 7-11k deaths now, compared to 15-20k in the previous set of models, and much more before that. The change is mostly due to assuming... 2/
1. Their projected ‘exit wave’ is much smaller than before, with central estimates of 7-11k deaths now, compared to 15-20k in the previous set of models, and much more before that. The change is mostly due to assuming... 2/
…a reduction in onward transmission from ‘breakthrough’ (post-vaccine) infections of ~50%, similar to my model. In addition, both Warwick and Imperial have now moved their (mild) seasonality assumptions into their core model – again, similar to mine. 3/
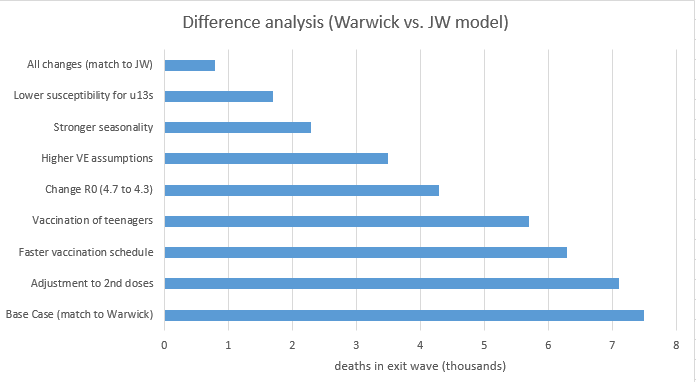
2. The models are still slightly more conservative than mine – but not by much. As before, I can set up my model with the Warwick assumptions, and it produces very similar outputs (7-8k deaths in the exit wave) – I then vary the assumptions, one by one, to match mine. 4/
This identifies a handful of remaining differences, none huge on its own, but collectively enough to ensure that my model predicts no significant exit wave (with under 1k deaths). Note that the chart shows the impact of moving each assumption individually. 5/
As you can see from the chart, the most significant differences (in descending order) are that my model has:
-Adjustment for lower susceptibility in children
-Slightly stronger seasonal variation
-Slightly higher VE assumptions on severe disease
(ctd) 6/
-Adjustment for lower susceptibility in children
-Slightly stronger seasonal variation
-Slightly higher VE assumptions on severe disease
(ctd) 6/
-Slightly lower R0 (the Warwick model has shifted up to R0=4.7, although I’m not 100% sure why, whereas I’m still at R0=4.3)
-Vaccination of teenagers (in July)
-Slightly faster vaccination schedule
-Adjustment for lower take-up of second doses.
7/
-Vaccination of teenagers (in July)
-Slightly faster vaccination schedule
-Adjustment for lower take-up of second doses.
7/
(Note that oddly, my assumption that 5% of people fail to return for their 2nd dose is slightly reducing the number of deaths in the model. I haven’t investigated, but I suspect this is because it enables first doses to be given out more quickly, so reducing transmission). 8/
3. The SPI-M models assume that a combination of baseline controls (such as TTI) and voluntary behavioural change (such as continued WFH) will help to reduce transmission by 10-30% after Step 4. One interesting scenario modelled by Warwick that seems to work quite well is to 9/
…retain strong baseline controls initially, but then relax these at the end of July, once vaccines have been offered to all 18+, and schools are on holiday. I can imagine this approach – effectively creating a Step 4a – gaining traction as a potential compromise option. 10/
4. The SPI-M summary says that seasonality may flatten or delay the exit wave, but is unlikely to prevent it. However the Warwick paper notes that if seasonality delays a peak into the winter, this gives an opportunity to stop the resurgence e.g. by doing more vaccination. 11/
5. The models remain sensitive to assumptions e.g. vaccine rollout speed and take-up in under50s. But it now takes a shift in two or more variables in order to produce a large exit wave – suggesting that the current conclusions are reasonably robust (absent new variants). 12/
6. Speaking of variants, there is a lot of modelling of variant scenarios in the papers, which I won’t attempt to describe in detail here. But, similar to my own analysis (below), it shows that even a partial immunity escape 13/ https://twitter.com/JamesWard73/status/1380541725236678657?s=20">https://twitter.com/JamesWard...
… can product a very large wave of hospitalisations and deaths, higher than the peaks of April & #39;20 or January & #39;21. The models agree that an escape of prior immunity (from vaccines &/or infections) would be a bigger concern than a simple increase in transmissibility (R0). 14/
7. One of the models (LSHTM) additionally includes an assumption of immunity waning over time – with 85% protection remaining after 6 months. This applies to both vaccine-derived and infection-derived immunity, and shifts their exit wave up from 4k deaths to 11k deaths. 15/
8. As restrictions are lifted, we expect that regional and local variations in case rates will increase. Or as the Warwick paper says: “We expect the third wave to be extremely heterogeneous both at the regional and finer spatial scales”. I think this gets surprisingly 16/
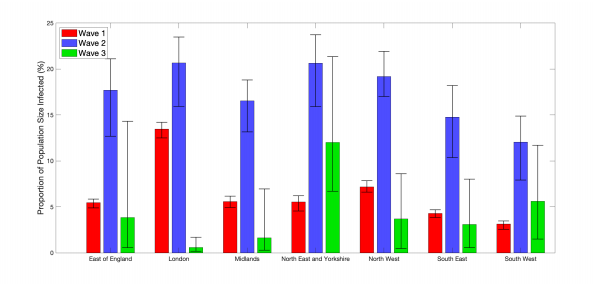
…little press coverage, perhaps because it’s hidden at the back of the papers and doesn’t feature strongly in the summary. But we can see that Warwick are predicting almost no exit wave in London & the Midlands, but a much larger one (e.g.) in the North East & Yorkshire: 17/
9. Even less obvious in the papers is the predicted age split of infections. But in the chart below, focus on the purple elements of the stacked bars, which relate to the exit wave – this shows, unsurprisingly, that it is concentrated in younger, less vaccinated groups. 18/
10. Finally, it’s interesting to note that the Cabinet Office assumption on vaccine rollout has gone back down to 2.7m infections per week in England (reducing to 2m pw in late July). This is OK, if a little frustrating that it keeps moving around! https://twitter.com/PaulMainwood/status/1391792930059345925?s=20">https://twitter.com/PaulMainw... 19/
For anyone who’s interested in reading more, here are the links to the papers:
Summary: https://assets.publishing.service.gov.uk/government/uploads/system/uploads/attachment_data/file/984521/S1227_SPI-M-O_Summary_of_further_modelling_of_easing_restrictions_Roadmap_Step_3__2_.pdf">https://assets.publishing.service.gov.uk/governmen...
Imperial: https://assets.publishing.service.gov.uk/government/uploads/system/uploads/attachment_data/file/984688/S1228_Imperial_Evaluating_the_Roadmap_out_of_Lockdown_Step_3.pdf">https://assets.publishing.service.gov.uk/governmen...
Warwick:
https://assets.publishing.service.gov.uk/government/uploads/system/uploads/attachment_data/file/984533/S1229_Warwick_Road_Map_Scenarios_and_Sensitivity_Steps_3_and_4.pdf">https://assets.publishing.service.gov.uk/governmen...
LSHTM:
https://assets.publishing.service.gov.uk/government/uploads/system/uploads/attachment_data/file/984546/S1230_LSHTM_Interim_roadmap_assessment_prior_to_steps_3_and_4.pdf">https://assets.publishing.service.gov.uk/governmen...
/20
And thanks to the authors and contributors – too many to list but including @mattjkeeling @DrLouiseDyson @mjtildesley @_nickdavies @GrahamMedley – for all the hard work behind this, and for making the models and assumptions transparent for us all to look at and criticise! /end

 Read on Twitter


