Still trying to calibrate how worried to be about B1.617.2 and genuinely don& #39;t know. These kinds of graphs https://twitter.com/TWenseleers/status/1391668827239370754
https://twitter.com/TWenselee... href=" https://twitter.com/theosanderson/status/1390675976472993792
definitely">https://twitter.com/theosande... feel like they are worth taking seriously, in terms of new variants apparently being on a course to dominance.
definitely">https://twitter.com/theosande... feel like they are worth taking seriously, in terms of new variants apparently being on a course to dominance.
But I still feel like there& #39;s a big step from "becoming dominant" to "causing trouble". Feels to me there could be various things going on, including (in increasing order of worry)
1. effects of non-random sampling (e.g. T+T in clusters)
2. higher R in general
3. vaccine escape
1. effects of non-random sampling (e.g. T+T in clusters)
2. higher R in general
3. vaccine escape
On the last, yes I& #39;ve seen reassuring threads from people in white coats, you don& #39;t need to share them with me. But was just wondering if we could see worrying signals in dashboard data, and was wondering what to watch out for.
For example, here& #39;s cases in Bolton by age. It feels to me like the increase is currently in younger less vulnerable age groups. But this might be a good graph to keep an eye on if you visit the dashboard.
Of course, I& #39;ve made tasteless analogies on this subject in the past, but we& #39;ve pumped a lot of chlorine in one end of the pool since then, and so reasonable to hope that has some effect? https://twitter.com/BristOliver/status/1302949052112306177">https://twitter.com/BristOliv...
Another good place to check would be London, since the variant is apparently most dominant there, but the past high peak means that the ongoing lack of a log-scale option on the dashboard basically stops us doing that directly. Sigh.
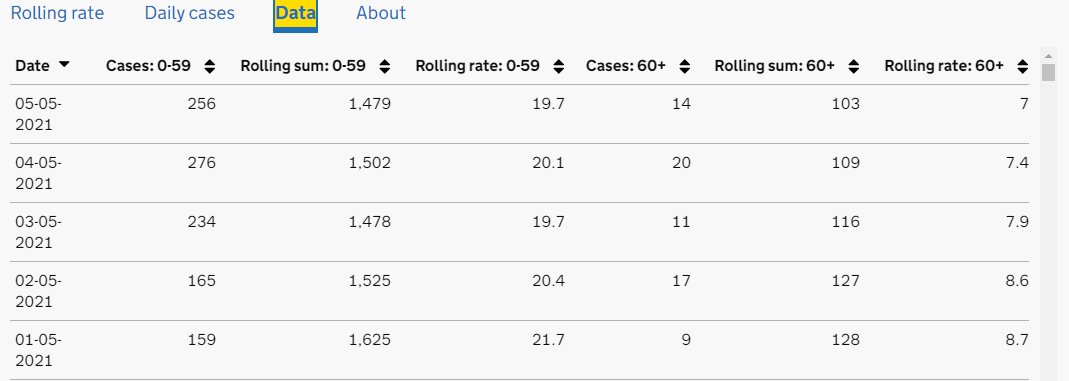
But raw data of averages under 60/over 60:
1st Feb 267 vs 251
1st March 52 vs 36.6
1st April 31.6 vs 14.1
5th May 19.7 vs 7
So ratio is falling, and the latest figure in the over 60s is 7 cases/100k/week. That& #39;s low by any standards.
1st Feb 267 vs 251
1st March 52 vs 36.6
1st April 31.6 vs 14.1
5th May 19.7 vs 7
So ratio is falling, and the latest figure in the over 60s is 7 cases/100k/week. That& #39;s low by any standards.

 Read on Twitter


