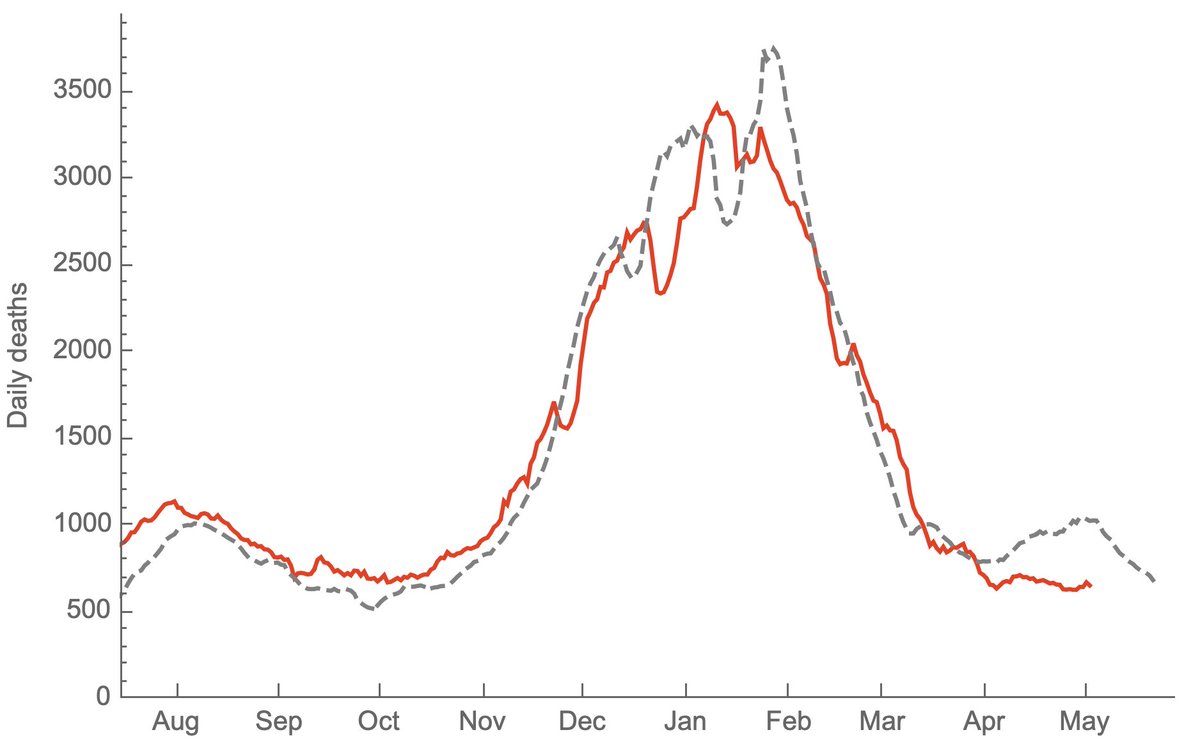
From Aug 2020 to Mar 2021, the lagged case fatality rate (CFR) of the US #COVID19 epidemic had remained largely constant at ~1.5% and provided a simple method to predict subsequent deaths from current cases. 1/6 https://twitter.com/trvrb/status/1334684089400532992">https://twitter.com/trvrb/sta...
I& #39;ve rerun the previous analysis correlating state-level reported cases with state-level reported deaths with different lags. Using @CDCgov data since Aug 2020, I find that a 19 day lag of cases to deaths maximizes average state-level correlation coefficient. 2/6
This shows the resulting projection for deaths where the gray dashed line shows a lookahead projection where 1.5% of reported cases result in reported deaths 19 days later. This can be compared to the solid red line showing realized 7-day average of reported deaths. 3/6
This simple lookahead projection predicted both the rise and the decline of deaths in the US fall/winter wave. However, this projection has not held from April onwards where you can see that projected deaths from cases (gray line) have exceeded realized deaths (red line). 4/6
This separation of cases and deaths is visible in a timeseries of lagged CFR. Here, 19-day lagged CFR remains between 1.25% and 1.75% from Aug 2020 through Feb 2021, but declines from March onwards and falls below 1% for the first time in April. 5/6
I believe this recent drop in CFR can likely be explained by vaccination of older individuals partially shifting burden of cases to younger population, where risk of death is lower. A demographic shift in cases can be seen in this plot from #demographicsovertime">https://covid.cdc.gov/covid-data-tracker/ #demographicsovertime.">https://covid.cdc.gov/covid-dat... 6/6

 Read on Twitter


