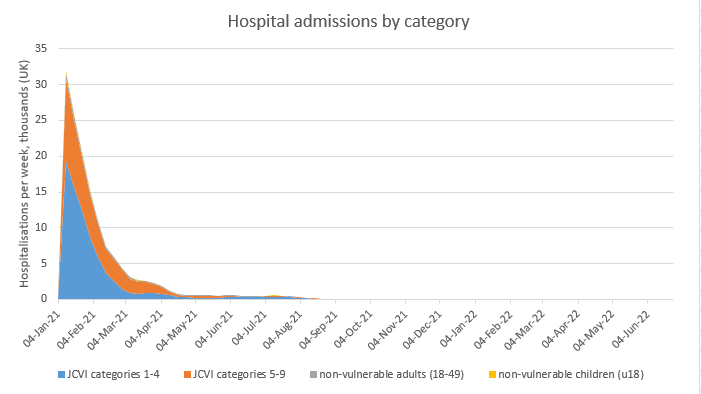
I found some time over the weekend for a quick model update, with all the latest data on vaccine supply, take-up and effectiveness. The net result: no change to my model’s central prediction of a small exit wave, or none at all if you allow for seasonality. 1/n
I now have to do quite serious violence to the model assumptions to get it to produce a material exit wave – suggesting that this conclusion is reasonably robust to the remaining uncertainties. There’s one big caveat on this: my model has no regional structure, 2/n
…and limited age stratification, so it won’t tell us if there’s about to be a (smaller) exit wave concentrated in the under-30s of Yorkshire, for example. For that, we need a more sophisticated model, such as those operated by the teams at Warwick and Imperial. 3/n
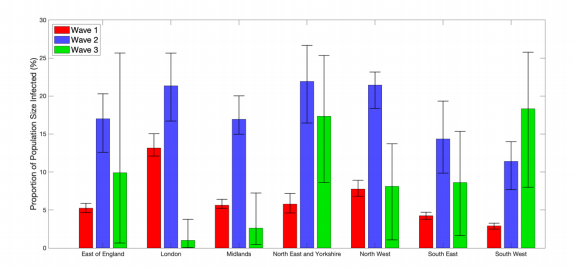
We’ve already seen some hints of their regional analysis in the recent SPI-M papers – see for example the size of the predicted exit wave (the green bar) in London vs. NE & Yorks. If – as rumoured – the latest versions of these models are predicting no national exit wave, 4/n
…it will be very interesting to see what they say about the potential for more localised waves, either in particular regions &/or age groups. Hopefully we’ll see a new set of model outputs published alongside the decision on Step 3, due in early May. 5/n
The rest of this thread is for those geeky enough to want to know which assumptions I changed, in order to produce no material change in my model outputs. For those of you with better things to do, you may depart without shame at this point, you’ve now got the key points. 6/n
Changed assumptions were:
1.Latest vaccine supply data, with actuals up to 25/4, and then projected 3.25 million total doses per week (for the UK), in line with Cabinet Office guidance. This implies that we’d vaccinate all over-30s by the time we unlock in late June. 7/n
1.Latest vaccine supply data, with actuals up to 25/4, and then projected 3.25 million total doses per week (for the UK), in line with Cabinet Office guidance. This implies that we’d vaccinate all over-30s by the time we unlock in late June. 7/n
2. Vaccine efficacy vs. all infections changed to 65% after 1st dose (from 60%) – in line with latest analysis of ONS data https://www.ndm.ox.ac.uk/files/coronavirus/ciscommunityvaccinationpaper20210417complete.pdf.">https://www.ndm.ox.ac.uk/files/cor... I’ve left the 2nd dose assumption at 75%; the study suggests 70% but I believe this is underestimated: https://twitter.com/DevanSinha/status/1385528579124076544?s=20">https://twitter.com/DevanSinh... 8/n
3. Assumption on infectiousness of post-vaccine infections changed from 50% reduction for all those with partial immunity, to 30% after 1st dose and 40% after 2nd dose. This is based on the ONS study plus other papers that link transmission to viral loads &/or the presence 9/n
…of symptoms. It’s not a precise analysis, but I feel happier that this is now based on some partial science, rather than a complete guess. Prior infections are treated similarly to 2 doses of vaccine (i.e. 40% reduction in transmission for those with partial immunity). 10/n
(If I combine the vaccines’ effect in reducing infections, and the reduced infectiousness of post-vaccine infections, I’m now projecting an overall reduction in transmission of 70% after 1 dose, and 83% after 2 doses - about 3 % points lower than before, in each case). 11/n
4. Baseline controls (TTI etc.) are assumed to be retained until end of August – they may need to continue for slightly longer if new variants are growing and suitable booster vaccinations are not quite ready to take over, but this is not included in the model. 12/n
I have not changed my assumptions for vaccine take-up, which remain at 95% in over-50s, 85% in u50s, and 5% dropout from first to second dose (consistent with govt briefings). We still need to watch the u50s take-up carefully, as this is a key driver of what happens next. /end

 Read on Twitter


