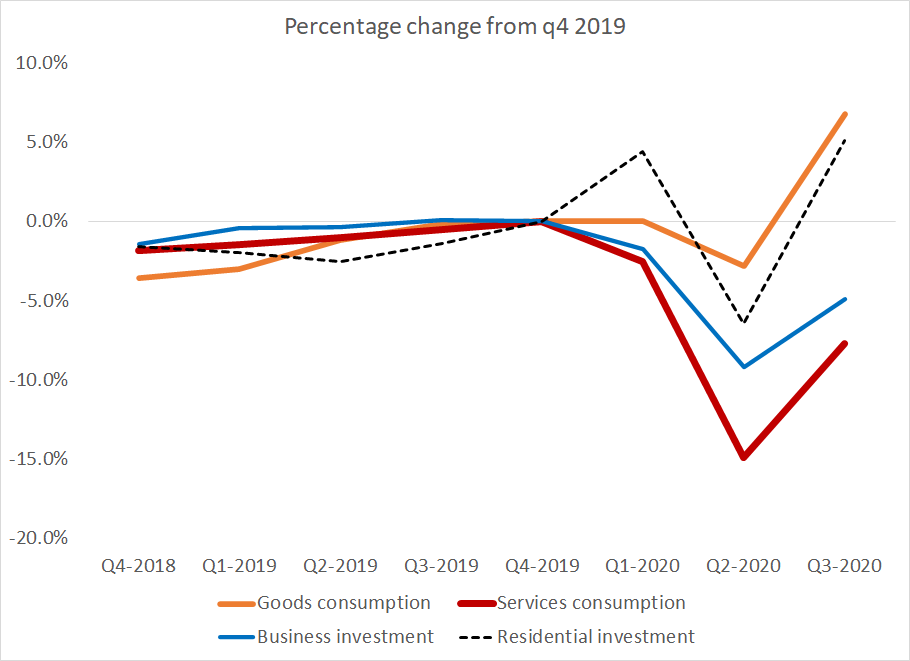
Today& #39;s GDP data obviously has gotten its share of coverage -- but I did want to highlight now unusual the downturn in q2 and partial recovery in q3 are. The downturn was led by services (usually the most stable component), and services are lagging the broader recovery
1/x
1/x
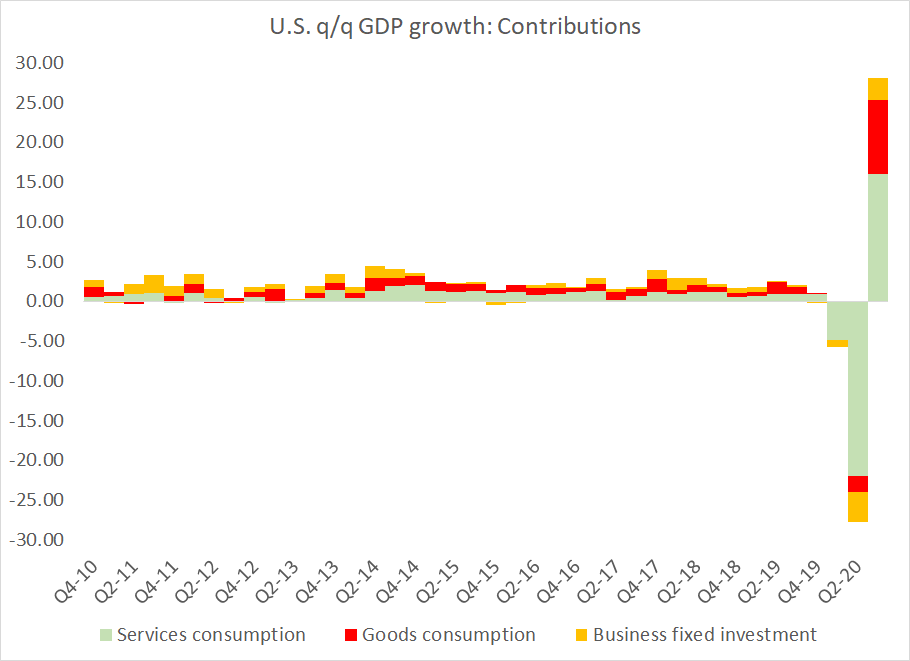
All this is looks totally crazy in the (annualized) contributions data, as, well, data wasn& #39;t designed for these kinds of swings.
But it is clear that goods consumption led the recovery
2/x
But it is clear that goods consumption led the recovery
2/x
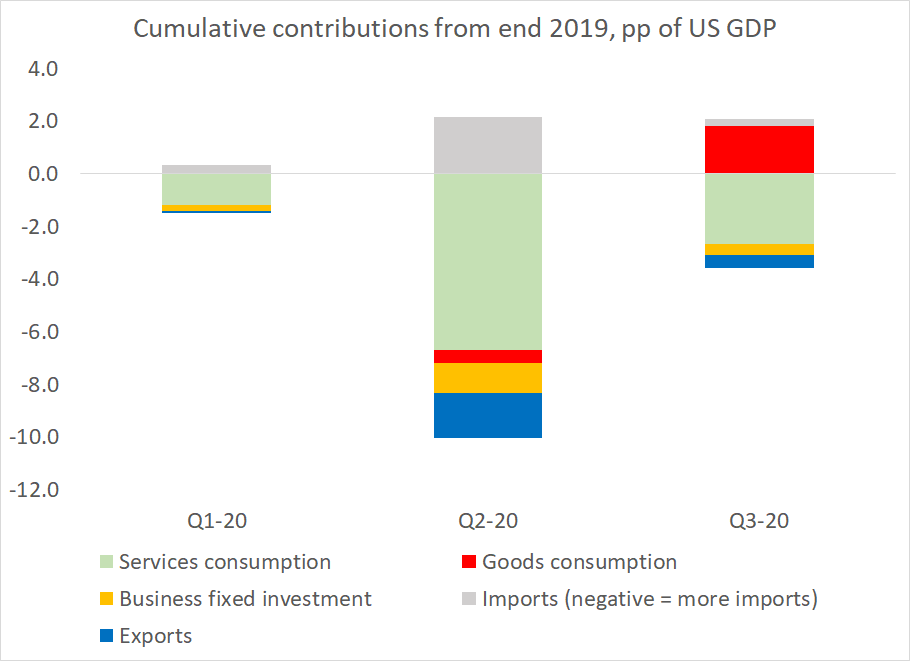
I de-annualized the data to put it on a more reasonable scale over the last year. Goods consumption is now 1.8 pp of US GDP higher than in q4 2019. Services consumption is down 2.7 pp of GDP
3/x
3/x
This of course has important implications for the trade data (my particular interest). Goods imports often closely track business fixed investment. But this year they have moved by far more than can be explained by changes in investment
4/x
4/x
The fit this year is much better if you add in consumption of goods -- about 1.9 pp (7.6% annualized) of the 3 pp of GDP (12% annualized) increase in business investment and goods consumption was met by imported goods.
(imports also buffered the fall in q2 of course)
5/x
(imports also buffered the fall in q2 of course)
5/x
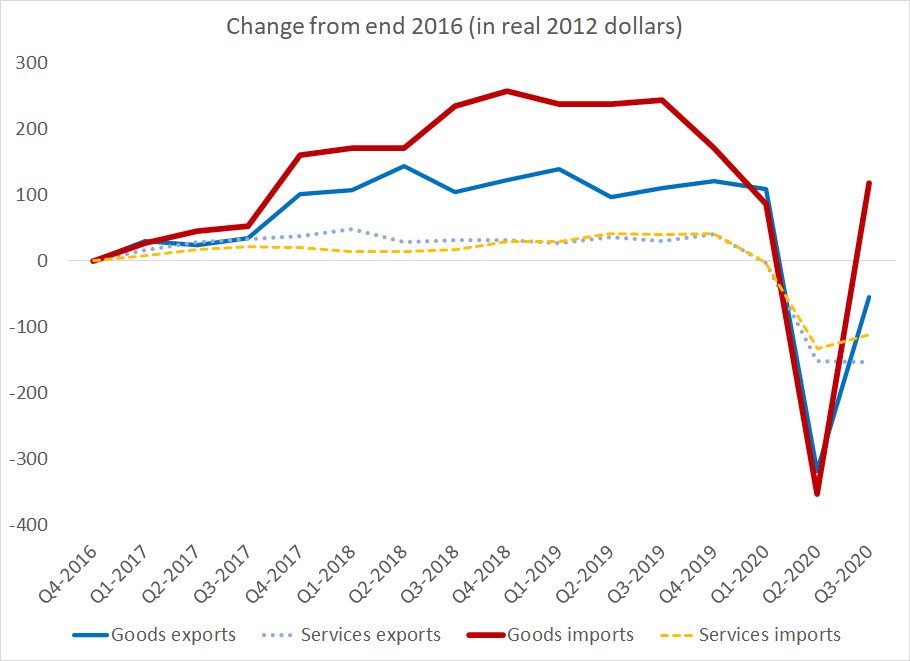
And as we all know, goods exports haven& #39;t bounced back like goods imports ...
(services trade is depressed in both directions because travel is like an amplified version of services in general, and travel hasn& #39;t recovered at all)
6/x
(services trade is depressed in both directions because travel is like an amplified version of services in general, and travel hasn& #39;t recovered at all)
6/x
Really big swings in the components of GDP have generated really big swings in the components of the trade balance ...
(mucking around with most old models, which sort of implicitly assumed much more stability in services, which mostly aren& #39;t traded)
7/7
(mucking around with most old models, which sort of implicitly assumed much more stability in services, which mostly aren& #39;t traded)
7/7

 Read on Twitter


