Brexitland is out today! To celebrate the release of our new book I& #39;m going to put up a graph a day here highlighting some of the big themes we discuss.
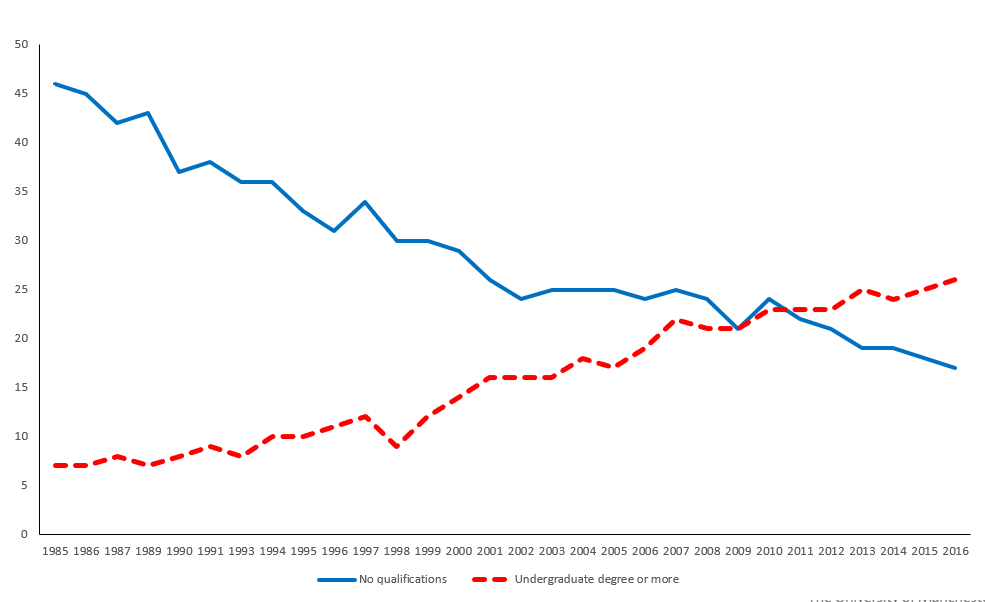
Graph 1: share of graduates and school leavers in the population 1986-2016
Graph 1: share of graduates and school leavers in the population 1986-2016
Educational expansion has reshaped our nation over past few decades. In the Thatcher years, nearly half of voters had no educational qualifications at all, and fewer than 10% had a university degree.
School leavers outnumbers graduates 2:1 when Blair was first elected in 1997
School leavers outnumbers graduates 2:1 when Blair was first elected in 1997
By the time of the EU referendum, graduates were one quarter of the electorate, and voters with no qualifications had fallen to 20%.
The shift is still ongoing - the share of graduates rises about 0.7 points a year, the share with GCSEs or less declines over a point a year
The shift is still ongoing - the share of graduates rises about 0.7 points a year, the share with GCSEs or less declines over a point a year
Why does this matter? Educational qualifications strongly predict differences in identity attachments and values.
On issues such as national identity, immigration, the EU and diversity, education is a far stronger predictor of views than class or economic ideology
On issues such as national identity, immigration, the EU and diversity, education is a far stronger predictor of views than class or economic ideology
The social roots of our current polarised politics on such issues lie in this fundamental democratic shift, with Britain gradually moving from a society where school leavers dominate and set the tone to one where graduates increasingly do so.
Plenty more discussion of this in the book! Available here:
https://www.cambridge.org/gb/academic/subjects/politics-international-relations/british-government-politics-and-policy/brexitland-identity-diversity-and-reshaping-british-politics?format=PB">https://www.cambridge.org/gb/academ... https://www.amazon.co.uk/Brexitland-Identity-Diversity-Reshaping-Politics/dp/1108461905/ref=tmm_pap_swatch_0?_encoding=UTF8&qid=&sr=">https://www.amazon.co.uk/Brexitlan...
https://www.cambridge.org/gb/academic/subjects/politics-international-relations/british-government-politics-and-policy/brexitland-identity-diversity-and-reshaping-british-politics?format=PB">https://www.cambridge.org/gb/academ... https://www.amazon.co.uk/Brexitland-Identity-Diversity-Reshaping-Politics/dp/1108461905/ref=tmm_pap_swatch_0?_encoding=UTF8&qid=&sr=">https://www.amazon.co.uk/Brexitlan...
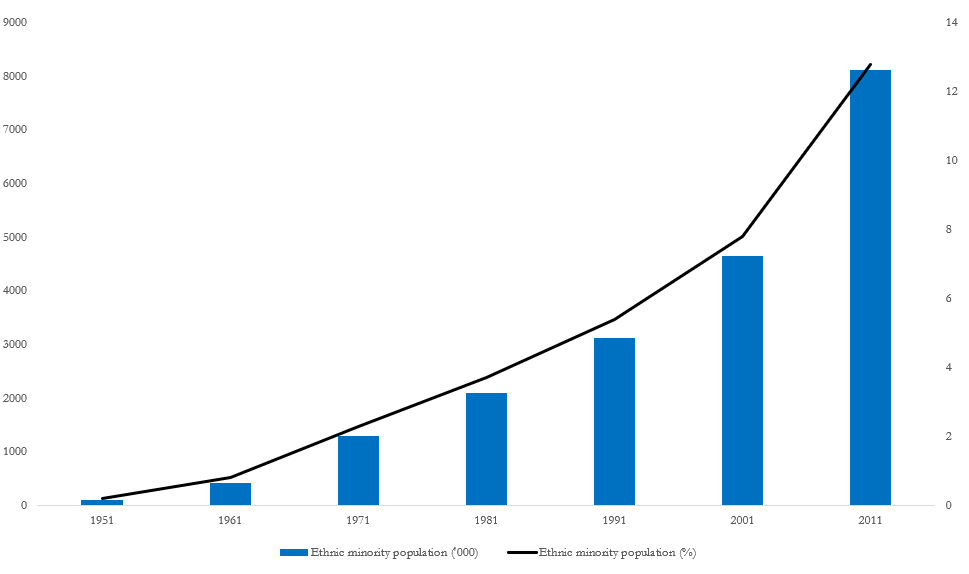
Time for graph 2: this shows the second big demographic trend driving political change in Britain - rising diversity. This chart shows the share of British residents from ethnic minority backgrounds in censuses from 1951-2011. Next year& #39;s census will reveal a further sharp rise
This accelerating rise in ethnic diversity matters politically because, as we show in the book, ethnic minorities have distinctive political priorities and behaviour, and different reactions to diversity and cultural change also have an important impact on how white voters behave
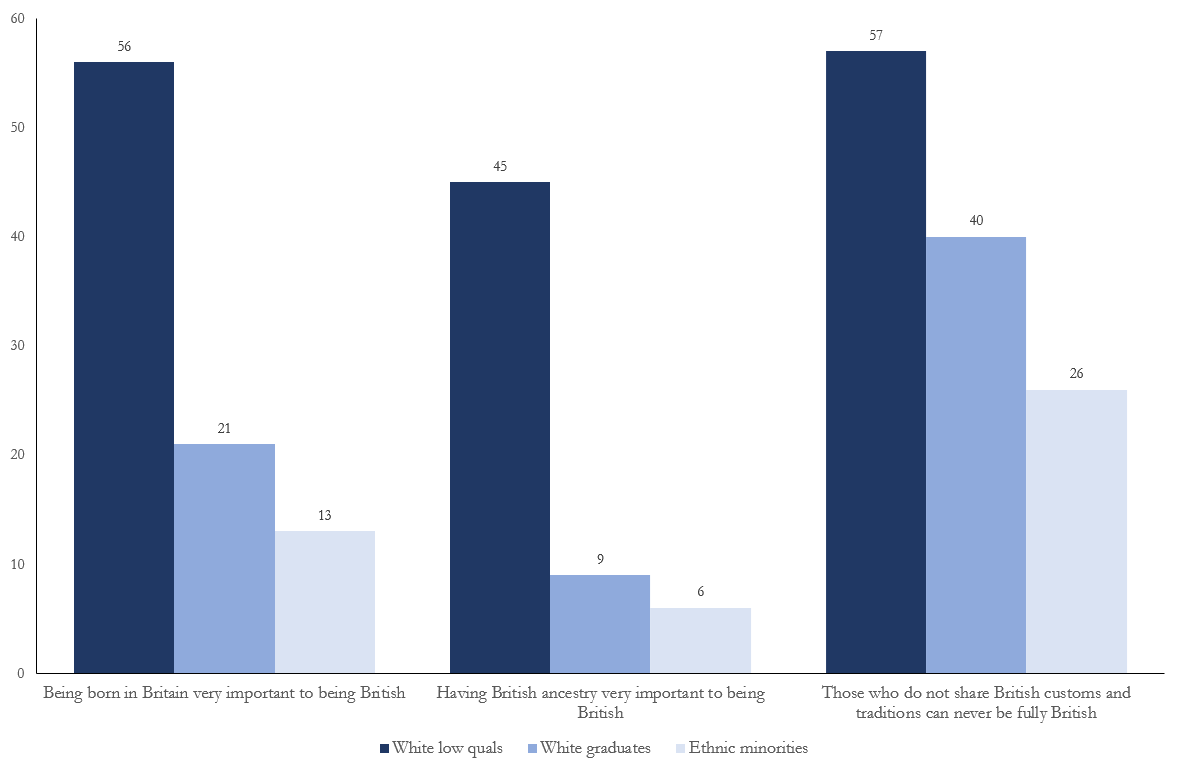
Third graph of the day illustrates one big reason why educational expansion and ethnic change matter: ethnocentrism. White school leavers express strong attachments to narrow, exclusionary forms of national identity. Graduates and ethnic minorities reject these @ProfSobolewska
The same pattern recurs on many other measures - views of immigration, negative stereotypes of ethnic minorities & other outgroups,desire for social distance from outgroups and so on. White school leavers tend to see politics in terms of "us against them"; grads & EMs reject this
As always, if you& #39;d like to learn more, Brexitland is available to buy here:
https://www.amazon.co.uk/Brexitland-Identity-Diversity-Reshaping-Politics/dp/1108461905/ref=tmm_pap_swatch_0?_encoding=UTF8&qid=&sr=">https://www.amazon.co.uk/Brexitlan... https://www.cambridge.org/gb/academic/subjects/politics-international-relations/british-government-politics-and-policy/brexitland-identity-diversity-and-reshaping-british-politics?format=PB">https://www.cambridge.org/gb/academ...
https://www.amazon.co.uk/Brexitland-Identity-Diversity-Reshaping-Politics/dp/1108461905/ref=tmm_pap_swatch_0?_encoding=UTF8&qid=&sr=">https://www.amazon.co.uk/Brexitlan... https://www.cambridge.org/gb/academic/subjects/politics-international-relations/british-government-politics-and-policy/brexitland-identity-diversity-and-reshaping-british-politics?format=PB">https://www.cambridge.org/gb/academ...
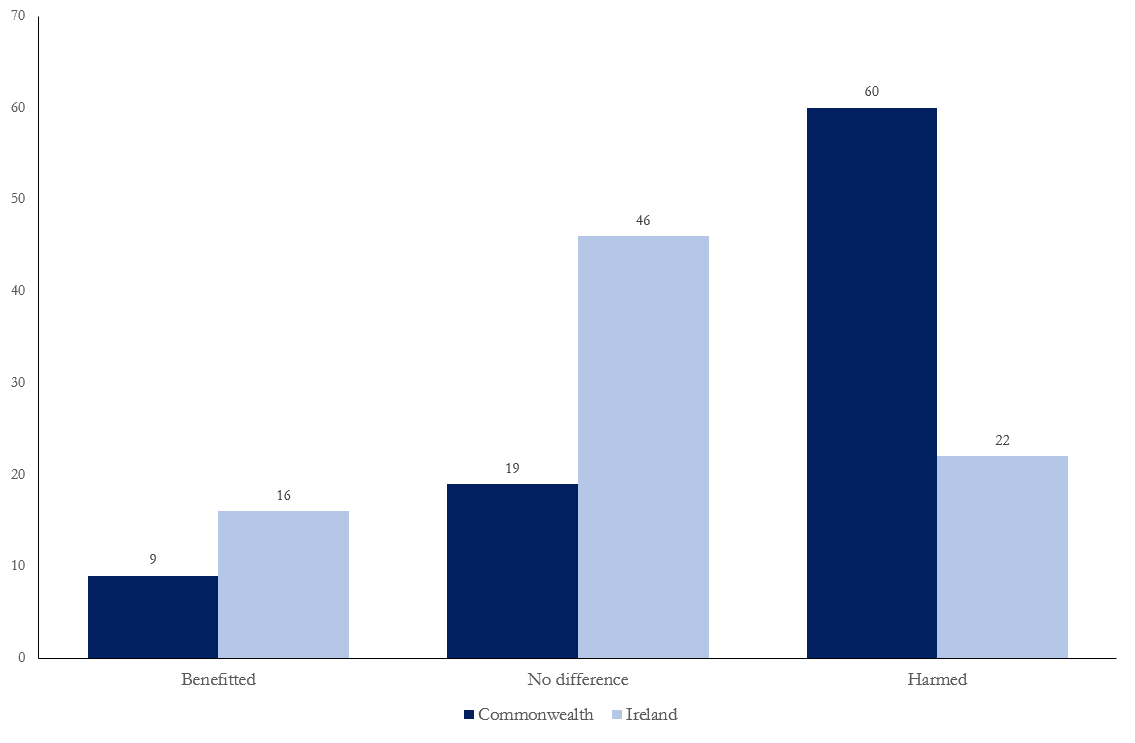
Time for today& #39;s daily graph. This one& #39;s a blast from the past. In 1967, Gallup asked voters whether they thought Britain had benefitted from immigration or been harmed by it. The twist was that half were randomly assigned to be asked about Commonwealth imm, half abt Irish imm
The share who saw Commonwealth immigration (then overwhelmingly interpreted as immigration from black and Asian Commonwealth members) as harmful was 60%, nearly three times the level for white Irish immigration (22%), though the latter was a larger source of immigration
What this underlines is the powerful impact of ethnocentric, "us against them" sentiment in driving reactions to immigration. Commonwealth imms were much more often seen as a threatening "other" by ethnocentric voters, driving much stronger opposition to their settlement
This opposition would produce political turmoil a year after this poll was fielded, when Enoch Powell gave his infamous "Rivers of Blood" speech
Plenty more in the book, where we review the history of immigration politics in Britain, and why the events of the 1960s and 1970s continued to echo through to the present day:
https://www.amazon.co.uk/Brexitland-Identity-Diversity-Reshaping-Politics/dp/1108461905/ref=tmm_pap_swatch_0?_encoding=UTF8&qid=&sr=">https://www.amazon.co.uk/Brexitlan... https://www.cambridge.org/gb/academic/subjects/politics-international-relations/british-government-politics-and-policy/brexitland-identity-diversity-and-reshaping-british-politics?format=PB">https://www.cambridge.org/gb/academ...
https://www.amazon.co.uk/Brexitland-Identity-Diversity-Reshaping-Politics/dp/1108461905/ref=tmm_pap_swatch_0?_encoding=UTF8&qid=&sr=">https://www.amazon.co.uk/Brexitlan... https://www.cambridge.org/gb/academic/subjects/politics-international-relations/british-government-politics-and-policy/brexitland-identity-diversity-and-reshaping-british-politics?format=PB">https://www.cambridge.org/gb/academ...
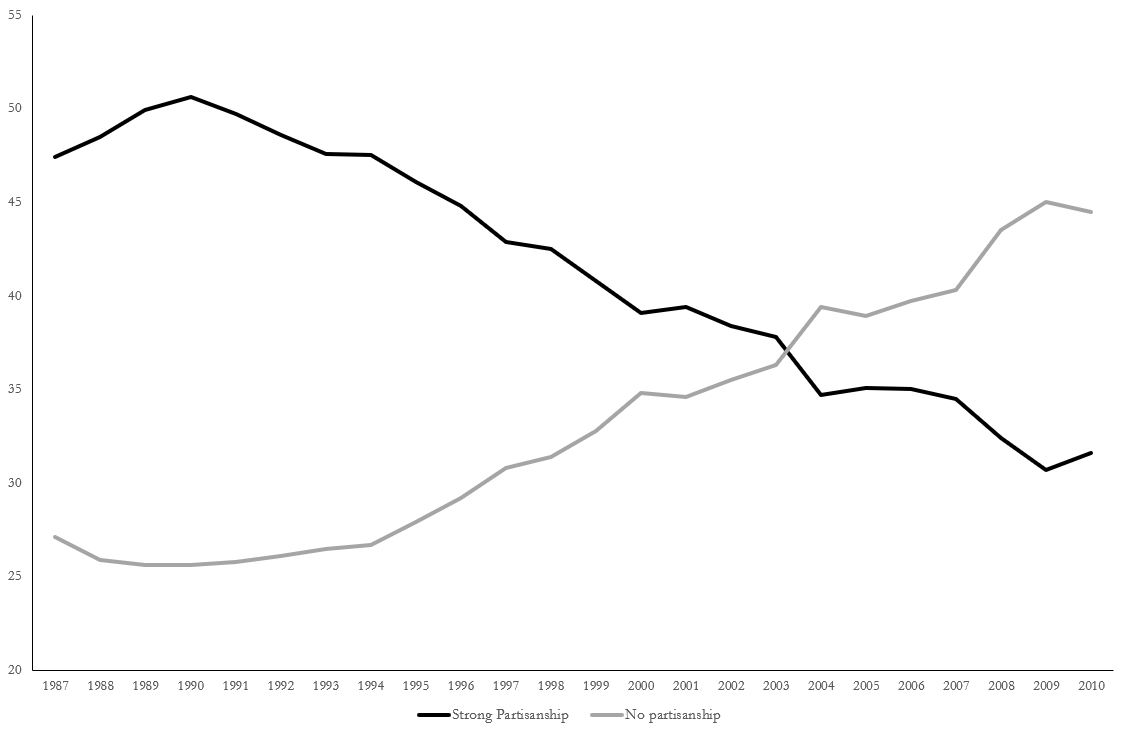
Time for the Brexitland graph of the day! Alongside demographic change, political change also helps set the scene for our current disruption. This latest graph charts decline in partisan attachments in the electorate from the 1980s to the start of the Coalition @ProfSobolewska
Half of voters expressed a strong party ID in late 1980s. By 2010, nearly half expressed no party ID
This decline in traditional party attachments opened up the political market, facilitating the volatile disruptions which began under the Coalition and have continued ever since
This decline in traditional party attachments opened up the political market, facilitating the volatile disruptions which began under the Coalition and have continued ever since
Time for Brexitland graph of the day #6 @ProfSobolewska
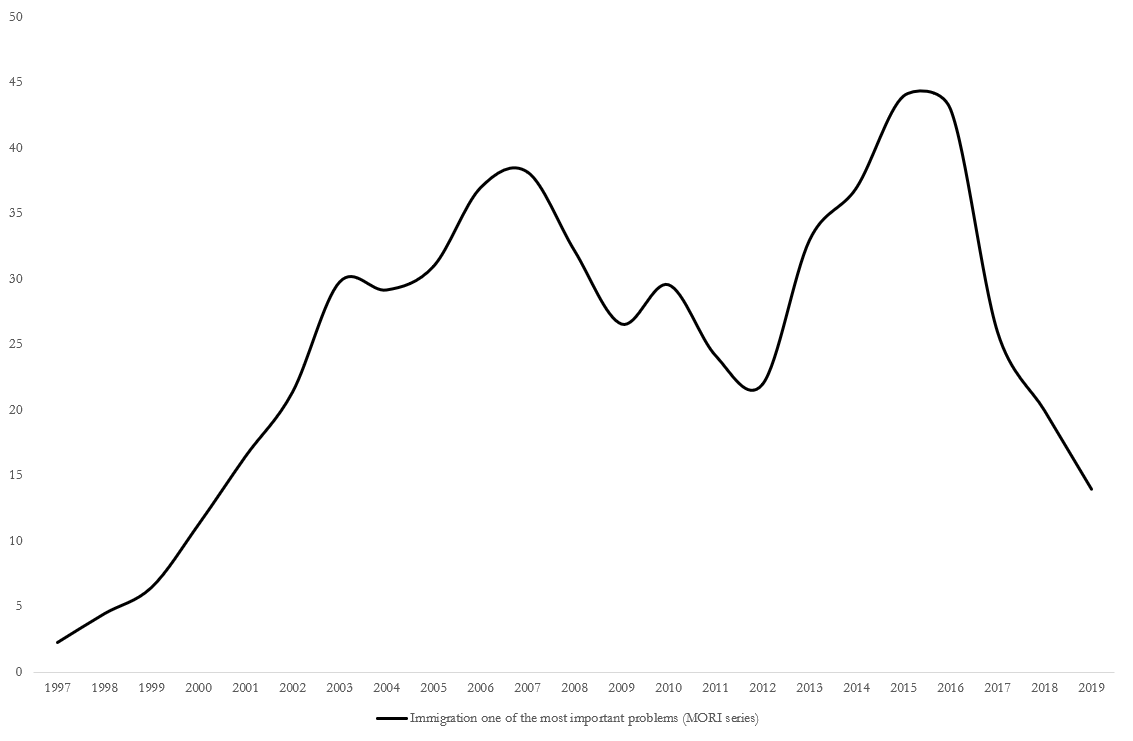
Today& #39;s graph documents the rise to the top of the political agenda of an issue with the potential to mobilise identity politics divides: immigration
Today& #39;s graph documents the rise to the top of the political agenda of an issue with the potential to mobilise identity politics divides: immigration
This is data from IPSOS-MORI& #39;s long running "most important problem" series, which records verbatim what people name unprompted as the most important issues of the day.
Immigration shot up the agenda in the early 2000s - by 2002 over 25% of voters were naming it.
Immigration shot up the agenda in the early 2000s - by 2002 over 25% of voters were naming it.
The issue then remained at or near the top of the agenda - named by 20-45% of voters month in, month out - for nearly 15 years thereafter. Immigration was a top concern even during the depths of the global financial crisis
Imm became the trigger issue which mobilised ethnocentric feelings of us against them, becoming a threatening outgroup which identity conservative voters focussed on and wanted controlled. They prioritised such control over all other issues through this period & voted accordingly
Time for the next Brexitland graph of the day @ProfSobolewska
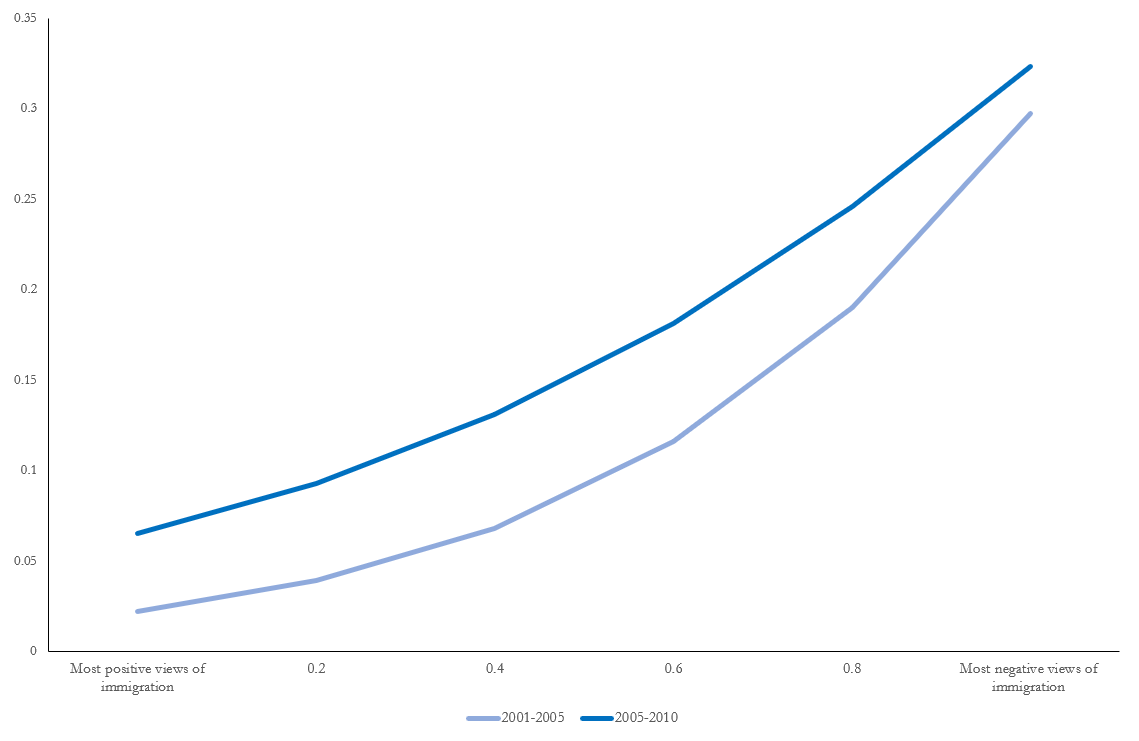
This one shows why the growing salience of immigration mattered for our politics - it shifted votes. The graph shows the predicted probability of Labour voters switching to Cons in 2005 and 2010
This one shows why the growing salience of immigration mattered for our politics - it shifted votes. The graph shows the predicted probability of Labour voters switching to Cons in 2005 and 2010
In both of the final elections of the New Lab govts (and indeed in 2001) negative views of imm & immigrants, and emphasising imm as a most important political problem, predicted switching from Labour to the Conservatives. Imm was an issue which really hurt Labour electorally
The political power of imm reflected the power of ethnocentric "us against them" psychology - ethoncentric voters far more likely to see imms as threat to be controlled - & political legacies/reputation: perception of Cons as the best party to do so a legacy of Powell/Thatcher
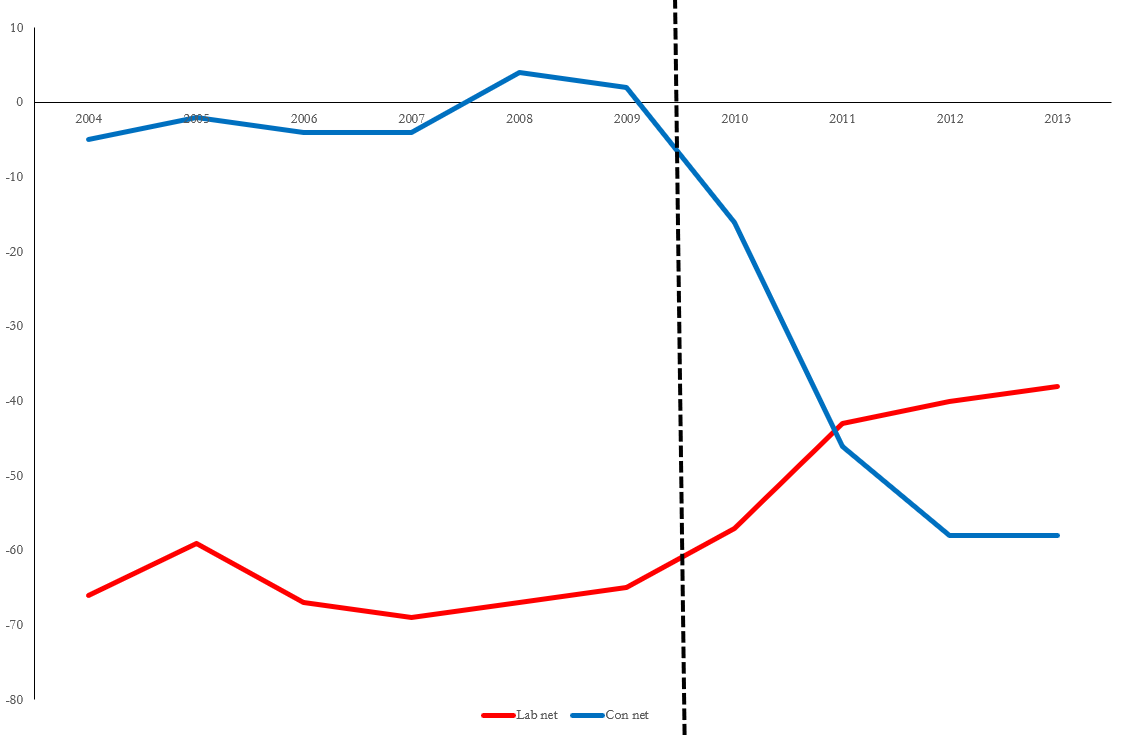
Time for the next Brexitland graph of the day. This chart shows net approve-disapprove ratings for Labour and the Conservatives betewen 2004 and 2013. The black dashed line marks when the Conservatives took office in Coalition with the Lib Dems
As the previous graphs had illustrated, the Conservative opposition gained in the 2000s by mobilising ethnocentric opposition to immigration, capitalising on an anti-imm reputation they had held since the 1960s.
What happened once they gained office? That reputation collapsed.
What happened once they gained office? That reputation collapsed.
The reason for this collapse is clear: Cameron and May promised a policy outcome (net migration under 100k) which was undeliverable. They stubbornly stuck to this commitment, despite repeatedly failing to get anywhere near delivering it. This was a potent way to destroy trust.
By repeatedly promising something they could not deliver, and refusing to level with voters about why they were failing to deliver, Cameron and May destroyed a 50 year reputational advantage on immigration in 18 months. By late 2011, the Cons were behind Labour on immigration.
UKIP& #39;s surge in the polls began soon after. The timing is no coincidence. The collapse in the Conservatives& #39; reputation as a party of immigration control opened the door to a radical alternative able to address ethnocentric voters& #39; concerns.
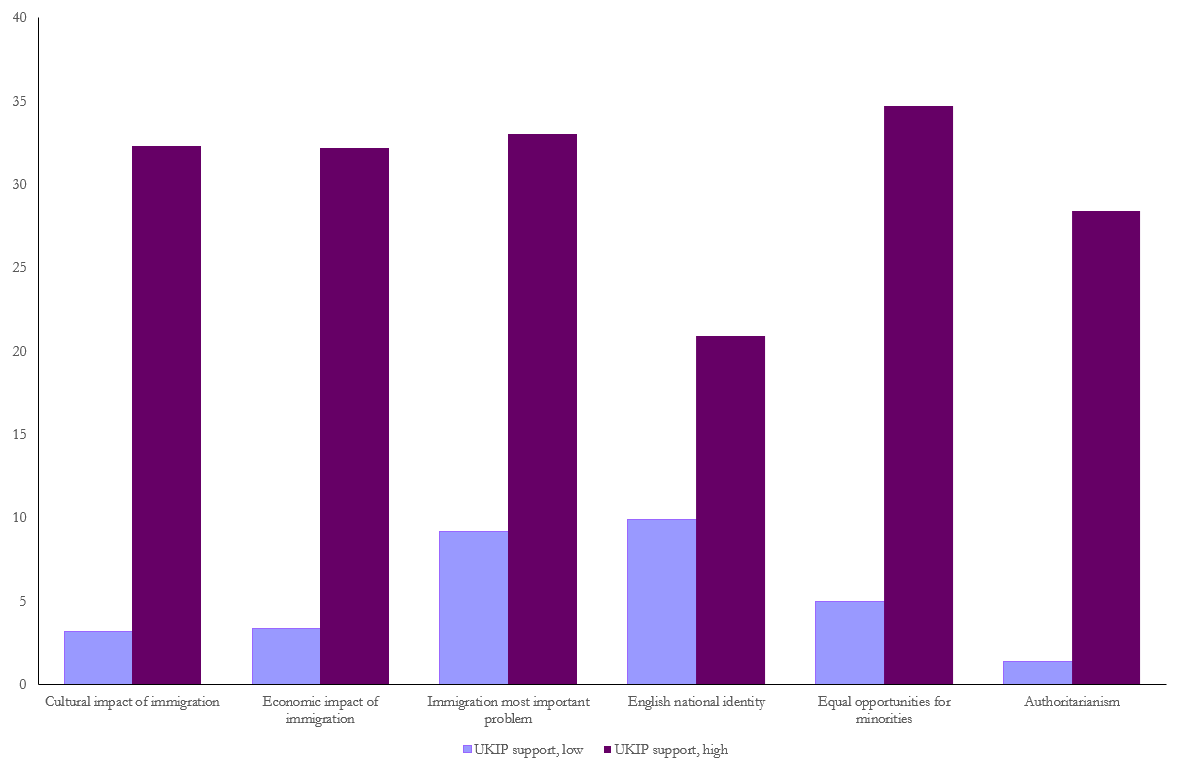
Time for another Brexitland graph of the day! High levels of voter concern about imm & Conservatives& #39; failure on the issue, opened the door for radical right insurgent: UKIP. As this graph shows, UKIP support at its 2014 peak overwhelmingly concentrated among ethnocentric voters
Most W European countries have a large rad rt party. But in Britain emergence of substantial party of this kind was delayed by the electoral system and (critically) alignment of ethnocentric voters with Conservatives. Cameron/May failure on the issue therefore a critical moment
Emergence of UKIP cements the linkage of immigration and EU in minds of British voters, and creates growing electoral pressure for Cons to offer something more radical on this issue agenda. Something like a renegotiation to secure imm control. Or a referendum.
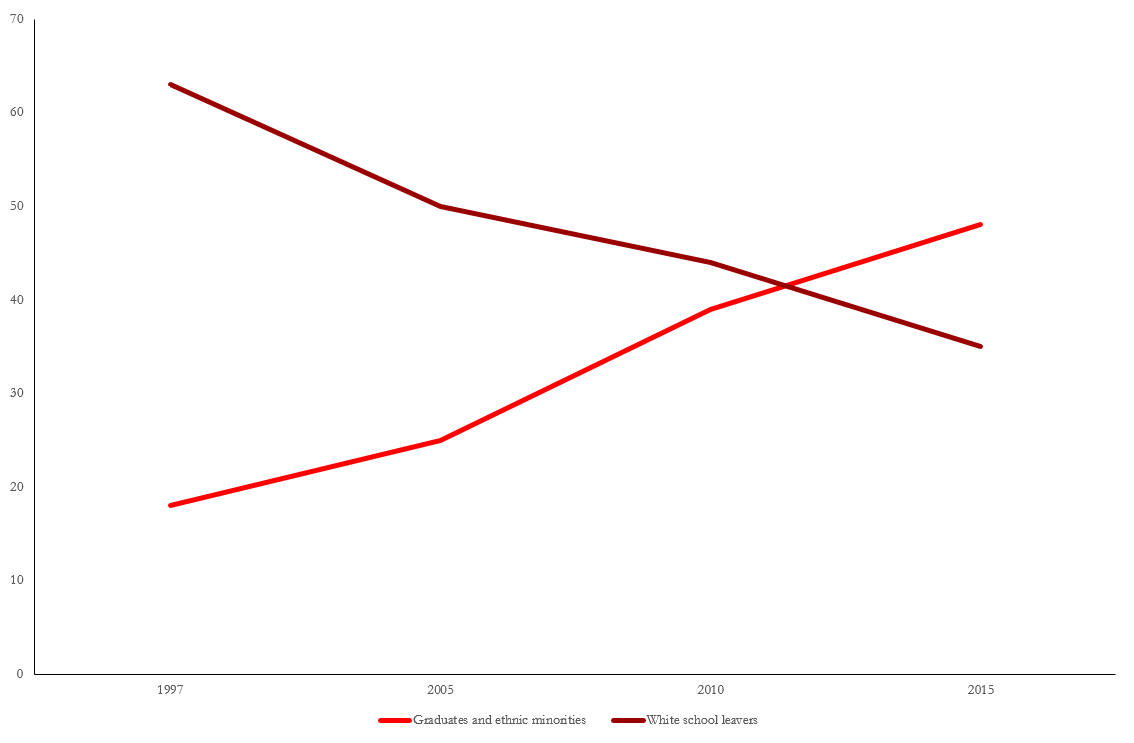
Time for another Brexitland graph of the day! This graph shows changing social base of Labour support. In 1997, two thirds of Labour& #39;s vote came from white school leavers, and less than a fifth from graduates and ethnic minorities. By 2015, grads & ems were the majority...
...and white school leavers had declined to under 40% of Labour& #39;s support. This transformation partly reflects LT social change, but also reflects circumstances of 2010-15, when Lab was losing ethnocentric white school leavers to UKIP at same time as it was gaining grads from LDs
This underlying demographic shift is really important. Before 2015, white school leavers had always been Labour& #39;s largest constituency (and hence had a v strong electoral voice in the party). After 2015, this ceased to be true. Lab became a majority identity liberal party.
This shift is unlikely to reverse - ID lib groups still growing & Lab appeal to ID cons fell further after 2015. But it continues to cause Lab electoral headaches. Its contemporary base is cosmopolital liberals.But seats it needs to win are still old, white, socially conservative
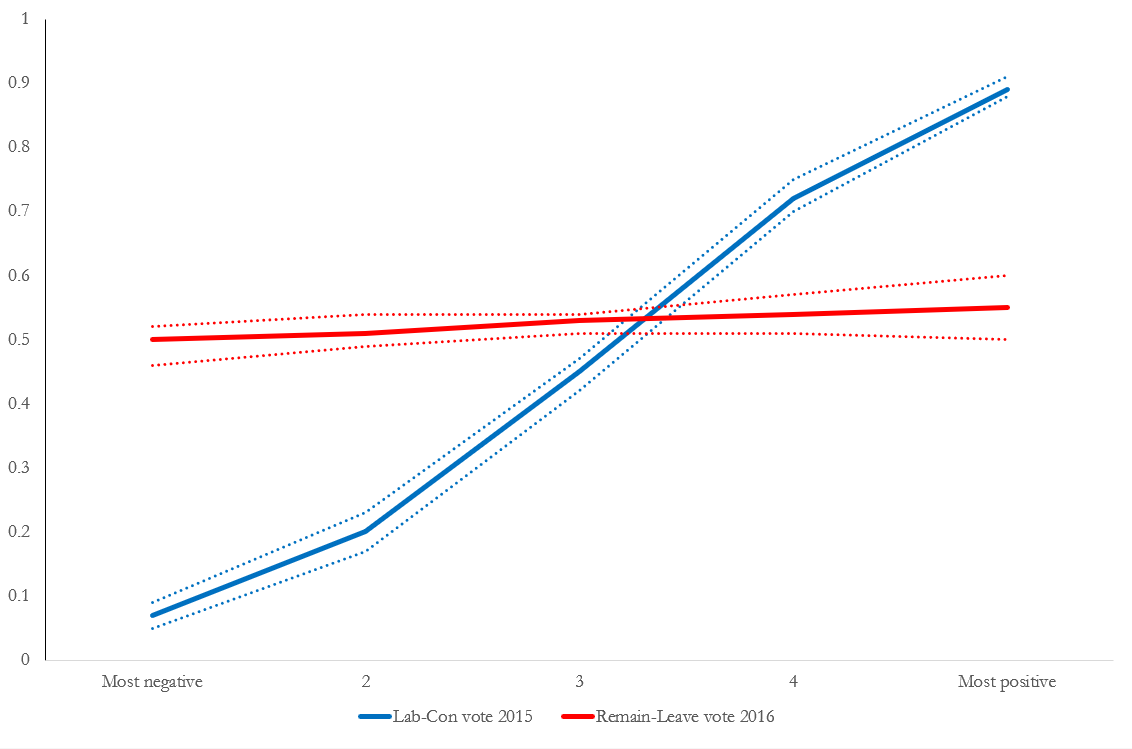
The latest Brexitland graph of the day takes us to the Brexit vote itself. Brexit divided the country, but in new ways quite at odds with typical voting patterns. This graph shows relationship between economic perceptions and vote choices in 2015 (Lab-Con) & 2016 (Leave-Remain)
In 2015, as in most elections, we see a strong relationship between economic perceptions and vote choice - people who are positive about economic conditions voted for the incumbent Conservatives, those who were negative broke towards Labour.
In 2016? No relationship at all.
In 2016? No relationship at all.
This is something of a challenge for accounts which foreground the role of economic deprivation or discontent in driving the Leave vote - there simply isn& #39;t any relationship at all between negative economic perceptions and support for Brexit.
Brexit was more popular among "working class" voters (however defined) and (somewhat) more popular amongst those with lower incomes etc. But these correlations were largely driven by the distinctive identity politics alignments of such voters.

 Read on Twitter