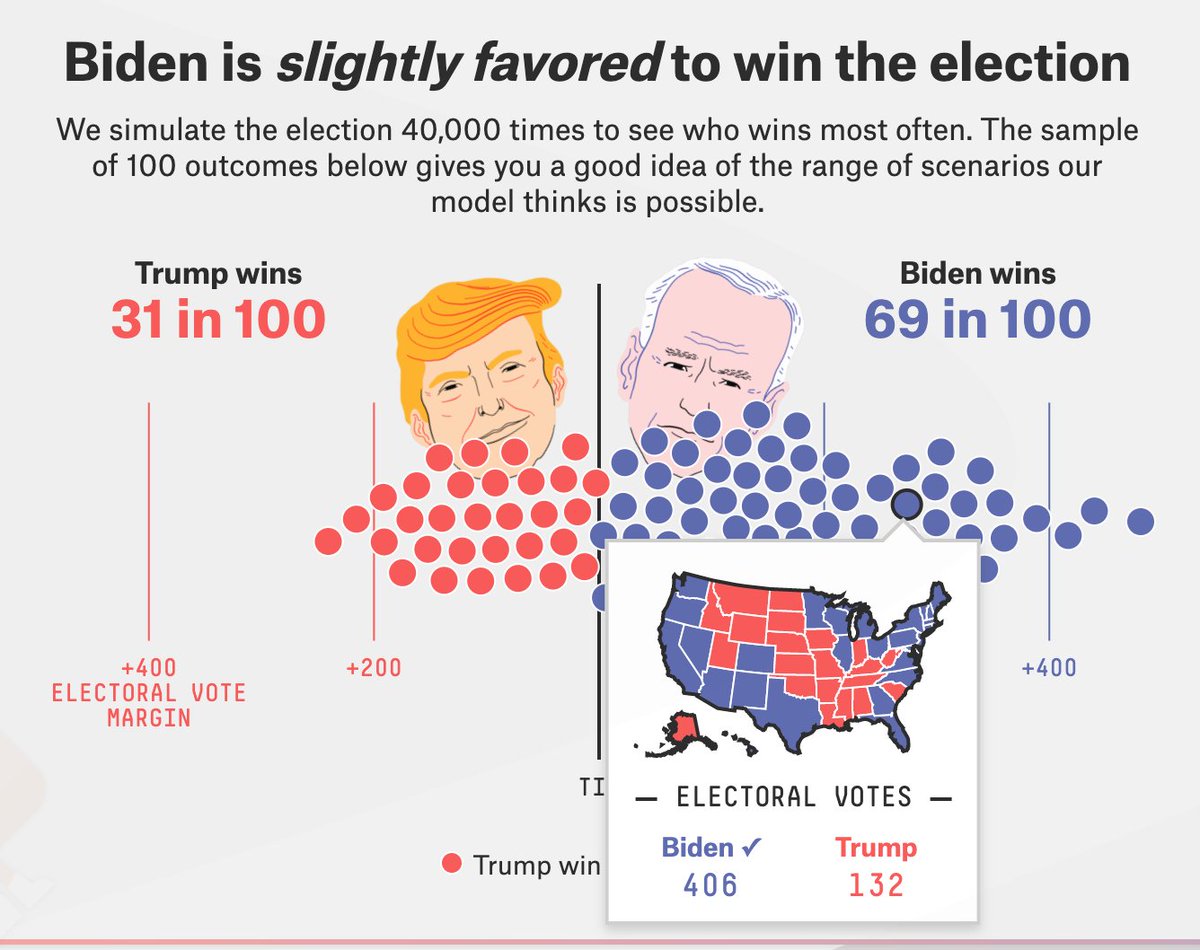
So, every time we run our presidential model, we show 100 maps on our interactive. The maps are randomly selected, more or less, out of the 40,000 simulations we conduct with each model run. People really like looking at these but they can sometimes yield misconceptions.
THREAD
THREAD
If you look through these, you can usually find a few maps that look *pretty* weird (say, Biden winning GA but losing FL) and maybe 1 or 2 that look *really* weird.
This is how the model is supposed to work accounting for a small chance of fat-tailed errors.
This is how the model is supposed to work accounting for a small chance of fat-tailed errors.
But it& #39;s important to keep in mind that if we happen to show a given map out of the sample of 100 the program randomly selects, that doesn& #39;t mean it has a 1 in 100 chance of occurring. The odds of that *exact* scenario might be 1 in 10,000 or 1 in a million, etc.
*Collectively*, the long tail of very weird 1-in-1,000 and 1-in-10,000 scenarios might have a 1-5% chance of occurring, or something on that order, depending on what your threshold is for "very weird", so a few of them will come up when we show a batch of 100 maps.
There is a long discussion about how we generate these maps in our methodology guide. Our model assumes that the majority of the error (something like 75%, although the amount varies over time) is correlated across states rather than applying to any one state individually.
This includes the possibility of clustered errors, where errors are based on demographic, political or geographical relationships between the states, or errors related to mail voting and COVID-19 prevalence. https://fivethirtyeight.com/features/how-fivethirtyeights-2020-presidential-forecast-works-and-whats-different-because-of-covid-19/">https://fivethirtyeight.com/features/...
In one sim, for example, the model might randomly draw a map where Biden underperforms its projections with college-educated voters but over-performs with Hispanics. In that case, might win AZ but not VA.
Or, if Biden happens to win MO in one simulation, he& #39;ll often win KS too.
Or, if Biden happens to win MO in one simulation, he& #39;ll often win KS too.
We spend a lot of time setting up these mechanics. It& #39;s a hard problem. It& #39;s tricky because it& #39;s hard to distinguish say a 1-in-1,000 chance from a 1-in-100,000 chance given the paucity of data in presidential elections.
But we want our projections to reflect real-world uncertainties as much as possible, including model specification error. There are many gray areas here, and there are certain contingencies we don& #39;t account for (e.g. widespread election tampering) but that is the general idea.
If you& #39;re backtesting, you can make highly precise state-by-state predictions (using some combination of polls and priors) in most recent elections (2004, 2008, 2012) but these wouldn& #39;t have been especially good in 2016 and many years before 2000 produce big surprises.
(I don& #39;t want to overly harp on 2016, but it& #39;s not unconcerning. If you think there& #39;s a secular trend toward polls/forecasts being more accurate, then 2016 being quite a bit less accurate than 2004/08/12, especially for state-by-state forecasts, is problematic.)
I& #39;m sure their authors would disagree, but we think some other models are closer to *conditional* predictions. IF certain assumptions about partisanship, how voters respond to economic conditions, etc., hold, then maybe then Biden has a 90% chance of winning instead our ~70%.
These assumptions are *highly plausible*, but they are a long way from *proven*. It is easy to forget how little data we have to work with, including only a handful of presidential elections for which we have particularly robust state polling data. https://fivethirtyeight.com/features/our-election-forecast-didnt-say-what-i-thought-it-would/">https://fivethirtyeight.com/features/...
Further, the map from 2000-2016 was unusually stable by historical standards. There have been SOME shifts (Ohio getting redder, Missouri getting bluer) but these are small in comparison to how much the map would typically change over 16 years.
When will the next major "realignment" be? Probably not this year. But, maybe! Or there could be some one-off weirdness caused by the economy, by COVID-19, or by an abrupt increase in mail voting.
So again, there& #39;s a balancing act here, but we think it& #39;s appropriate to make fairly conservative choices *especially* when it comes to the tails of your distributions. Historically this has led 538 to well-calibrated forecasts (our 20%s really mean 20%). https://projects.fivethirtyeight.com/checking-our-work/">https://projects.fivethirtyeight.com/checking-...

 Read on Twitter


