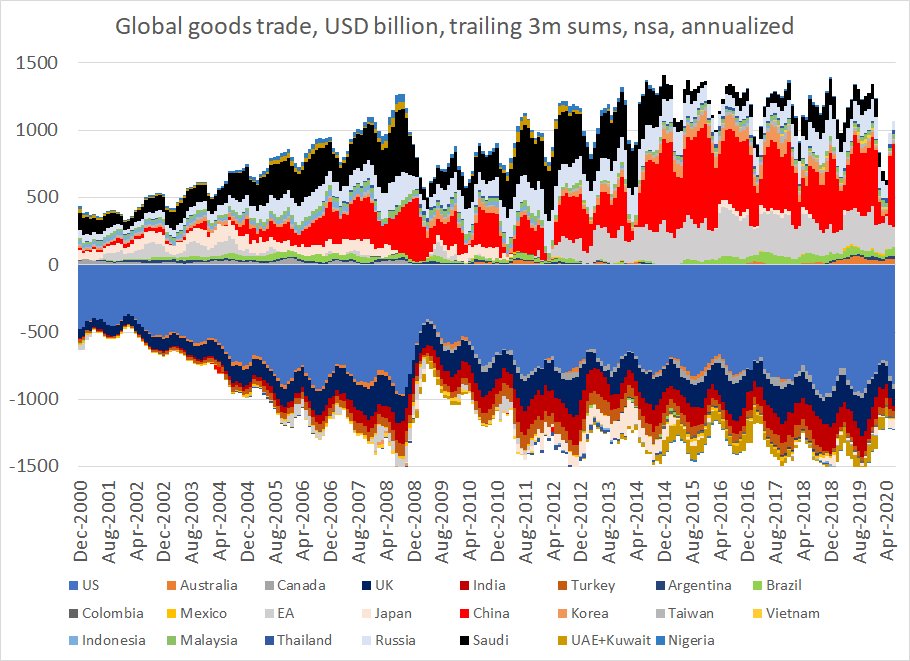
COVID-19 has had an obvious impact on global trade volumes. It also is changing the pattern of global trade imbalances. Tracking such changes at a high frequency though takes a bit of work. This is a start.
1/x
1/x
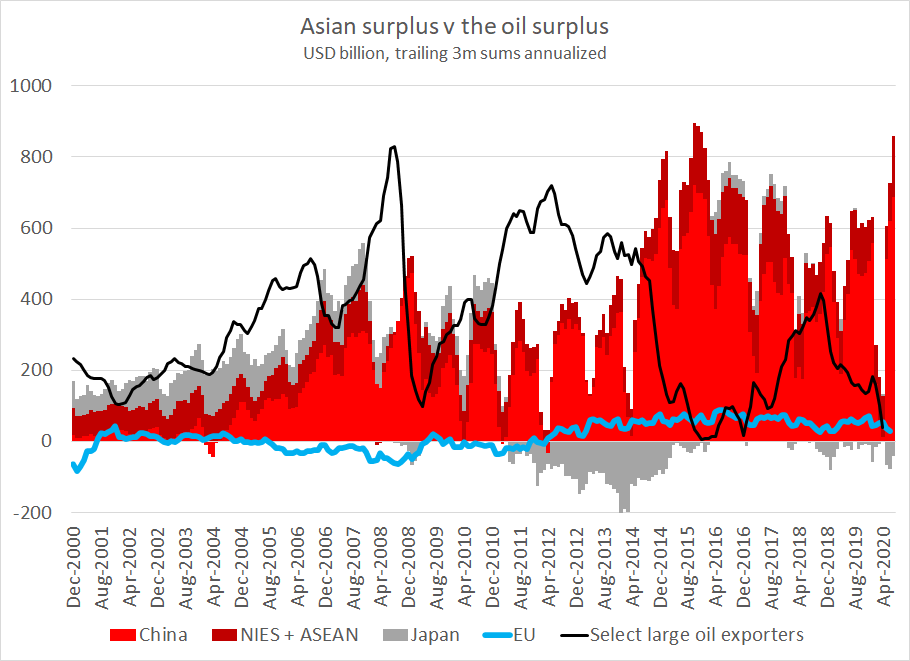
Any such analysis serves as a reminder of just how important oil is to global trade. From 2003 to 2013 an awful large large of the goods imbalance stemmed from the oil surplus.
Another important stylized fact: Asia& #39;s aggregate goods surplus is much larger than that of the EU
Another important stylized fact: Asia& #39;s aggregate goods surplus is much larger than that of the EU
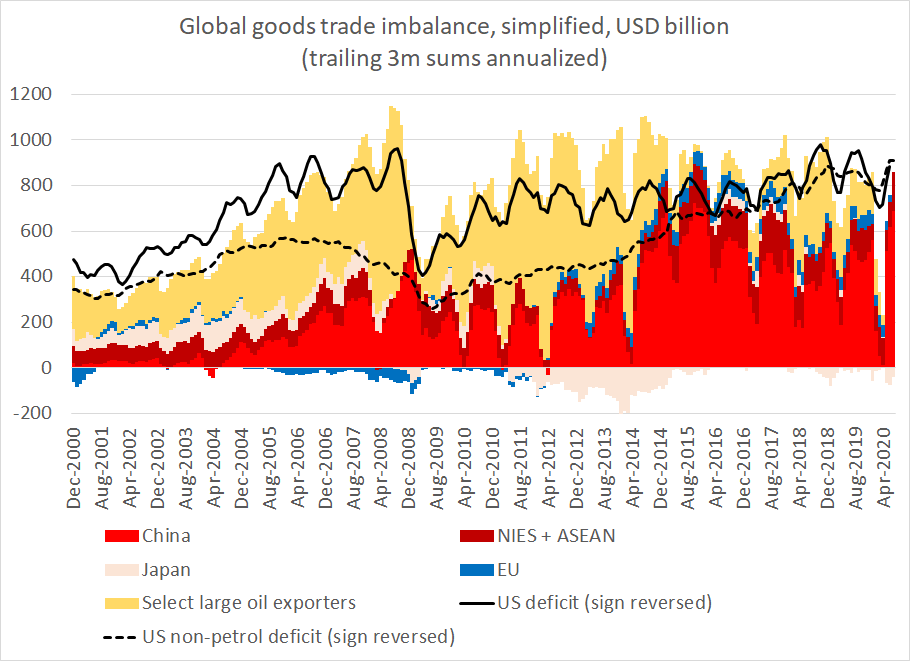
To make the fit between the deficit and surplus side of the ledger clearer I flipped the sign for the world& #39;s biggest deficit country --
This chart shows how global trade currently cannot "add up" without the U.S. goods deficit
3/x
This chart shows how global trade currently cannot "add up" without the U.S. goods deficit
3/x
Asia can write all the rules it wants for trade inside Asia it wants -- until Asian demand absorbs more of Asia& #39;s goods production, Asia will still need access to external markets ...
4/x
4/x
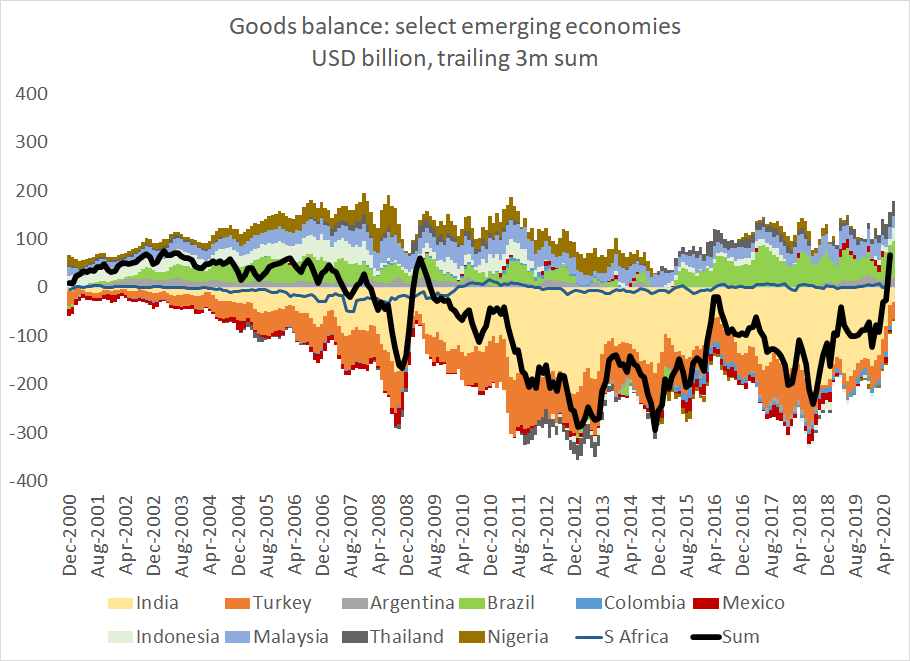
The other big theme that emerges out of the data is the collapse of large surpluses outside of Asia -- and larger deficits in the emerging world. With a lower oil import bill, the traditional deficit countries are moving toward surplus
5/x
5/x
The big deficits in goods trade right now are found in the US -- and I suspect in many of the bigger oil exporting economies. But the oil exporters often report data only with long lags ...
6/x
6/x
The U.S. trade data for July (due out next week I think) will help flesh out the global picture (expect an increase in U.S. imports from China).
And the August numbers from Asia will provide a hint as to whether or not the rise in Asia& #39;s surplus in July will be sustained
7/x
And the August numbers from Asia will provide a hint as to whether or not the rise in Asia& #39;s surplus in July will be sustained
7/x
Stay tuned -- the capital flow data used to be considered more interesting than the trade data, but right now I suspect the trade data is also telling us a fair amount about global capital flows.
8/8
8/8

 Read on Twitter


