It& #39;s abundantly clear that societal behavior strongly impacts #COVID19 spread. We saw this early on where social distancing resulted in significant reductions to epidemic spread. With the surge of cases in the south, what can we expect going forward? 1/14 https://twitter.com/trvrb/status/1248096610887675904">https://twitter.com/trvrb/sta...
With changes in behavior starting in May, we& #39;ve seen a "surge" in confirmed cases of COVID-19. However, we shouldn& #39;t treat the US as a single epidemic. 2/14 https://twitter.com/COVID19Tracking/status/1278809676801470464">https://twitter.com/COVID19Tr...
Very broadly, we might consider a "Northeast US epidemic" that had a large peak in March/April, but is now mostly contained and a "South US epidemic" that is just now picking up steam. 3/14 https://twitter.com/COVID19Tracking/status/1278816142790803460">https://twitter.com/COVID19Tr...
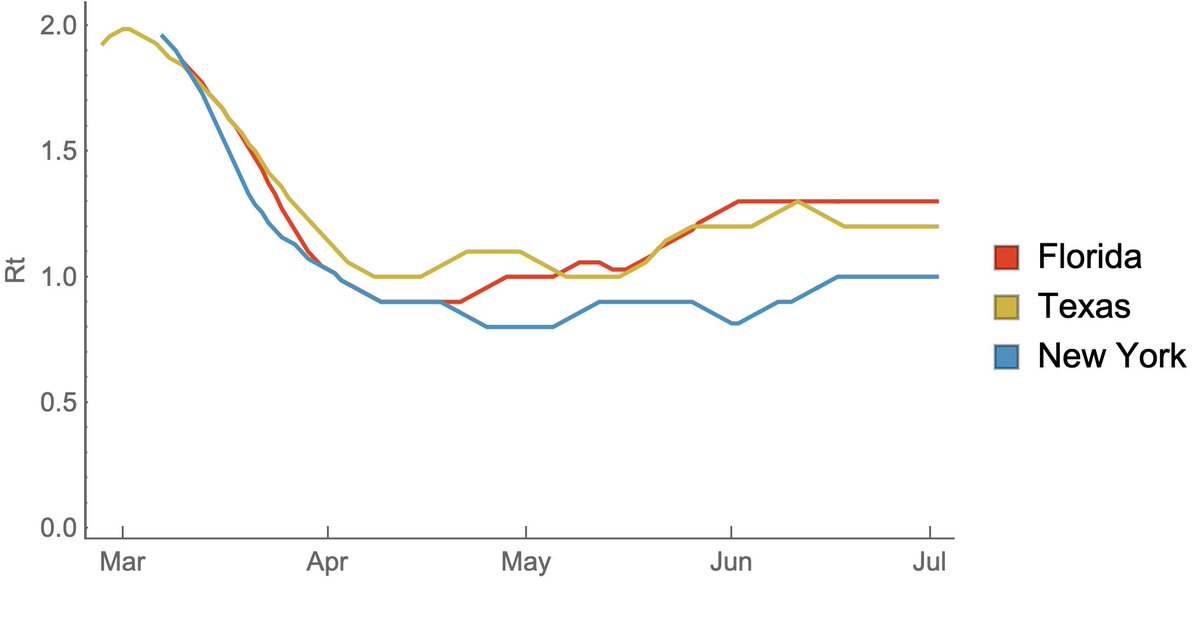
Here, I& #39;ve taken data from https://epiforecasts.io/covid/ ">https://epiforecasts.io/covid/&qu... by @cmmid_lshtm to plot reproductive number (Rt) for Florida, Texas and New York. Rt above 1 indicates a growing epidemic and Rt below 1 indicates a declining epidemic. Florida and Texas currently have Rt around 1.3. 4/14
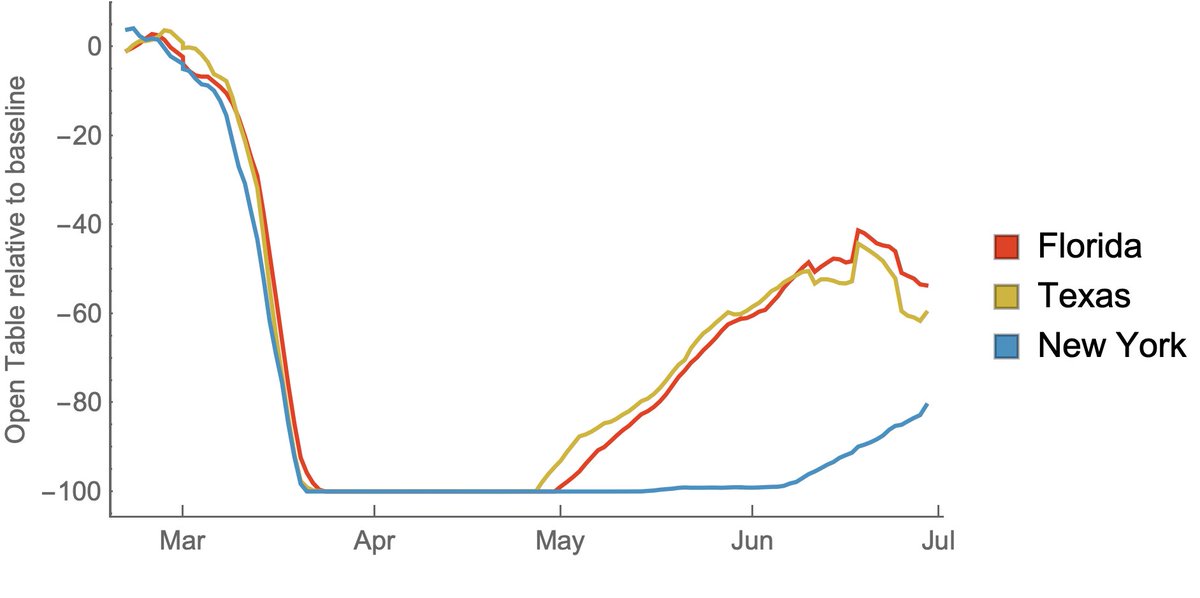
One convenient indicator for societal behavior is @OpenTable reservations. Here& #39;s data from https://www.opentable.com/state-of-industry">https://www.opentable.com/state-of-... that shows reservations relative to baseline. There is a precipitous decline in March, and increases in Florida and Texas beginning in May. 5/14
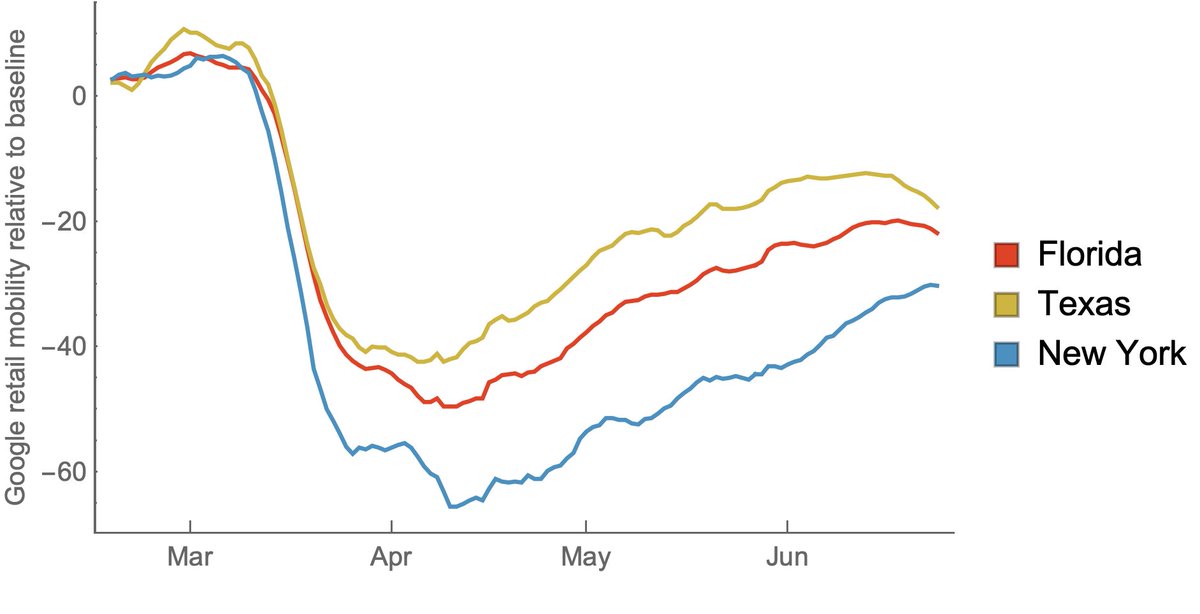
We can also look at cell phone mobility patterns for "retail and recreation" from @Google ( https://www.google.com/covid19/mobility/),">https://www.google.com/covid19/m... where we see a similar steep decline in March and a slow rebound starting in April with a faster return in Florida and Texas relative to New York. 6/14
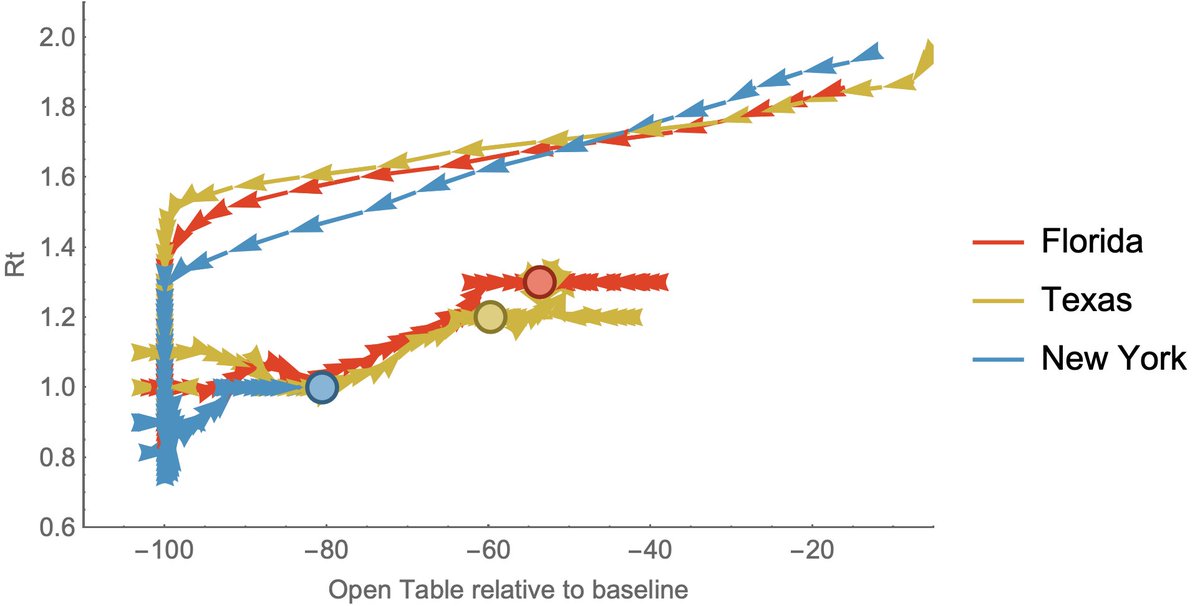
We can also plot the trajectory of Open Table reservations against Rt through time. You can see that Florida, Texas and New York all start with rapid epidemic expansion (Rt ~ 1.8), but along with declining restaurant reservations we see a matching decline in Rt. 7/14
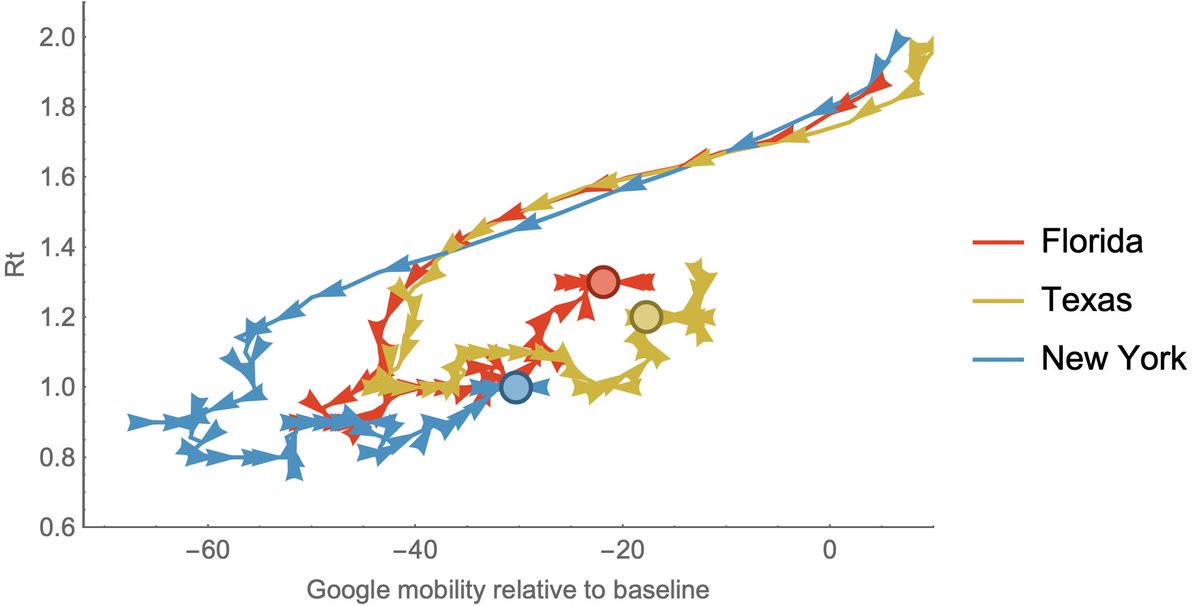
More recently, we see a trend back upwards in Open Table reservations that is tracked by an increase in Rt, with Florida and Texas marching towards baseline more rapidly than New York. Filled circles are values at present. 8/14
You can see that an Open Table value of "-60" means a different thing today than it did in March. I take this to indicate that societal attempts at hygiene (masks, etc...), are having an effect. Overall Rt is dampened relative to March, but this has only gone so far. 9/14
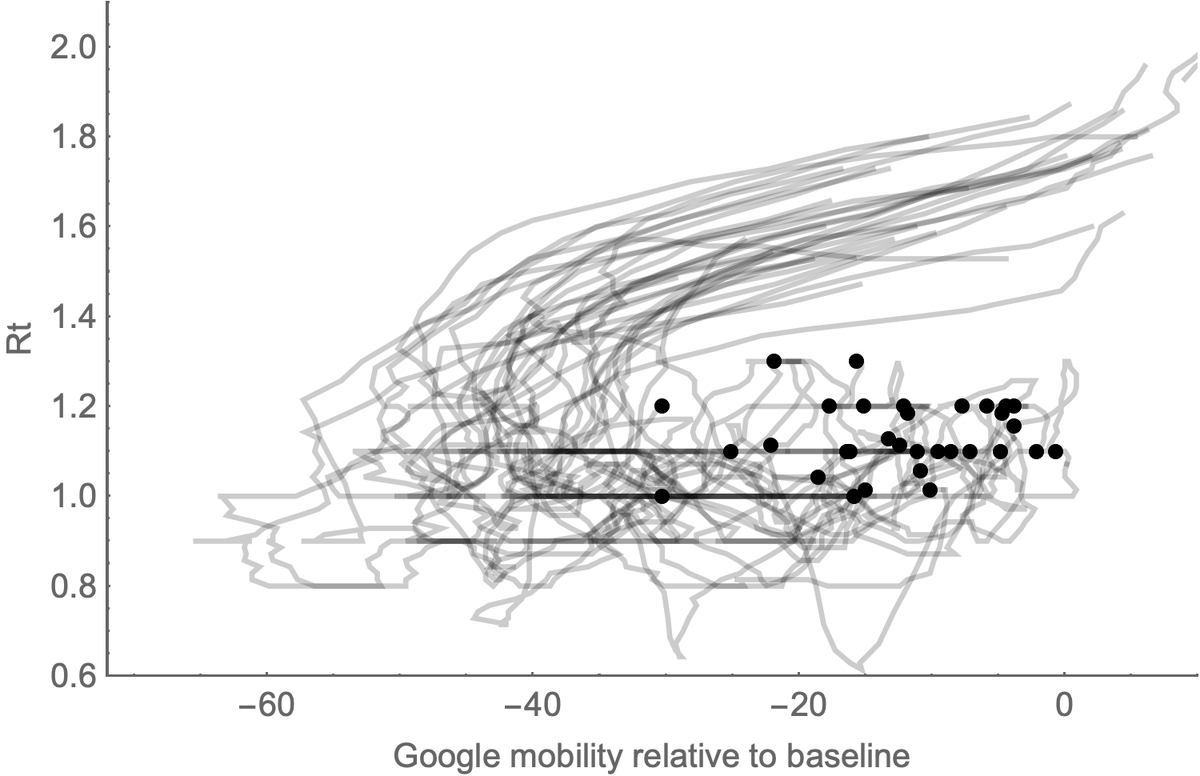
We can make a similar comparison plot of Google mobility against Rt through time. We see mobility and Rt declining in tandem early on and then both rising slowly in the past couple months. Florida and Texas now have greater mobility and Rt than New York. 10/14
New York responded dramatically to its epidemic and was able to bring things under control. What is worrisome is that we& #39;ve seen a very noticeable rise in cases in Florida and Texas beginning June ~15, but little societal response so far (at least in this data). 11/14
I& #39;m presuming that once things get bad enough there will be a concomitant societal response and the epidemic in the southern US will be slowed, but it& #39;s unclear to me when we will reach this point. 12/14
It& #39;s easy to predict continued epidemic growth of the virus if behavior stays the same, it& #39;s much harder for me to predict human response. 13/14

 Read on Twitter