THINK LIKE AN EPIDEMIOLOGIST:
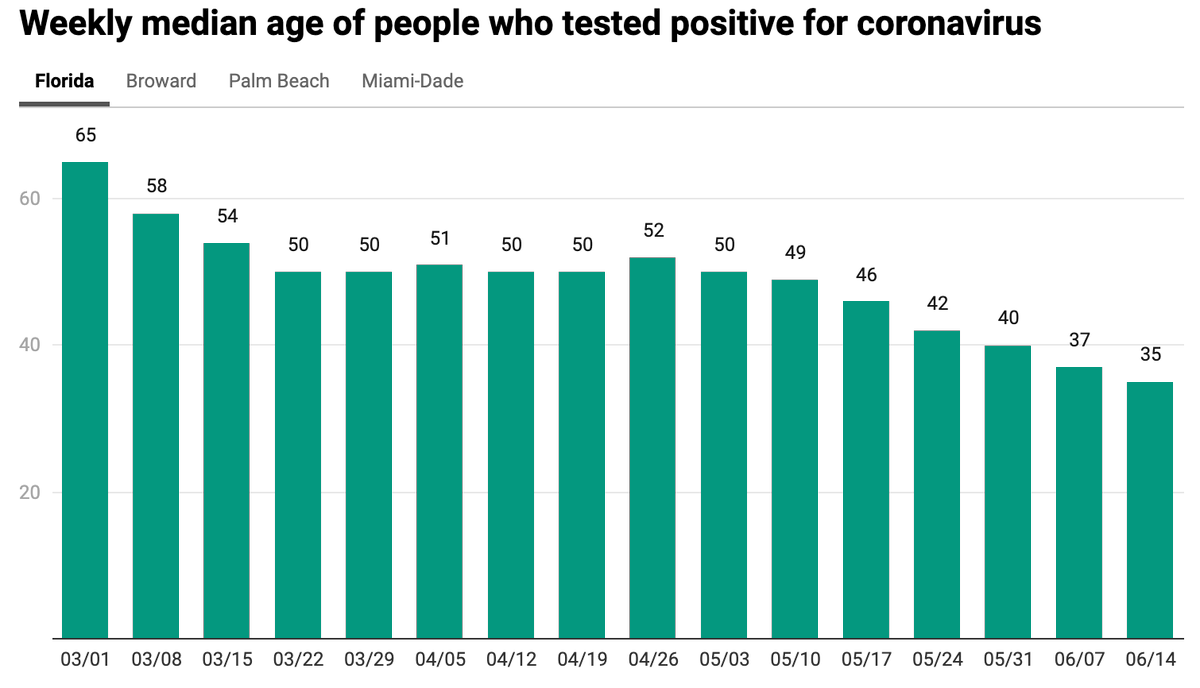
What does it mean that the median age of new cases is dropping in some areas? I see three possible explanations, not all good. A thread on how to distinguish between them. 1/10
(Figure h/t @ScottGottliebMD)
What does it mean that the median age of new cases is dropping in some areas? I see three possible explanations, not all good. A thread on how to distinguish between them. 1/10
(Figure h/t @ScottGottliebMD)
Explanation 1: More testing.
As we do more testing in the community, we are able to capture more mild or even asymptomatic infections. This is especially true for routine workplace testing. As younger people have milder disease, this shifts the age distribution lower. 2/10
As we do more testing in the community, we are able to capture more mild or even asymptomatic infections. This is especially true for routine workplace testing. As younger people have milder disease, this shifts the age distribution lower. 2/10
If median age drops because of more testing only, we expect:
- Increase in number of cases detected across all age groups
- Test positivity to drop in all age groups (size of drop depends on which groups are targeted for testing)
- No change in hospitalizations
3/10
- Increase in number of cases detected across all age groups
- Test positivity to drop in all age groups (size of drop depends on which groups are targeted for testing)
- No change in hospitalizations
3/10
Explanation 2: Elderly people are more cautious.
Median age could also drop if the elderly were protecting themselves better, even with no change in testing. For example, we are preventing more nursing home outbreaks. 4/10
Median age could also drop if the elderly were protecting themselves better, even with no change in testing. For example, we are preventing more nursing home outbreaks. 4/10
If median age drops only because the elderly are more cautious, we expect:
- Drop in number of new cases in the elderly
- Drop in test positivity among the elderly (fever/illness is more likely due to other non-COVID causes)
- Drop in hospitalizations (after a lag)
5/10
- Drop in number of new cases in the elderly
- Drop in test positivity among the elderly (fever/illness is more likely due to other non-COVID causes)
- Drop in hospitalizations (after a lag)
5/10
Explanation 3 (the not good one): Young people are less cautious.
This is distinct from the previous scenario. It means that young people are being infected even more than before. This could occur if there are many bar/nightclub or workplace outbreaks. 6/10
This is distinct from the previous scenario. It means that young people are being infected even more than before. This could occur if there are many bar/nightclub or workplace outbreaks. 6/10
If median age drops only because young people are being infected more, we expect:
- Numbers of new cases to rise in young people
- Test positivity to increase in young people
- More young people being hospitalized (after a lag)
7/10
- Numbers of new cases to rise in young people
- Test positivity to increase in young people
- More young people being hospitalized (after a lag)
7/10
Besides the fact that young people can face unknown long-term outcomes of infection, they can also inadvertently spread the virus to their communities. So the median age could start to creep back up if it moves from bars out to coworkers, family members, etc. 8/10
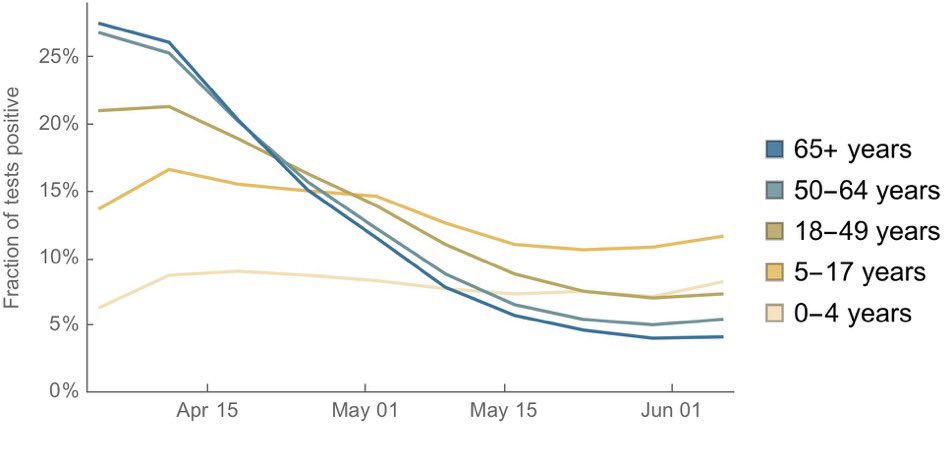
The reality is almost certainly some mixture of all three explanations. In this figure (h/t @trvrb), test positivity drops for everyone (more testing), but most in the elderly (more protection). But it is flatlining in 18-49 y/o and could start increasing (more infection). 9/10
Ultimately, we need more high quality age-stratified data on cases, testing, and hospitalizations. These are my preliminary thoughts on how to distinguish between these scenarios. Looking forward to discussing with #epitwitter more! 10/END

 Read on Twitter


