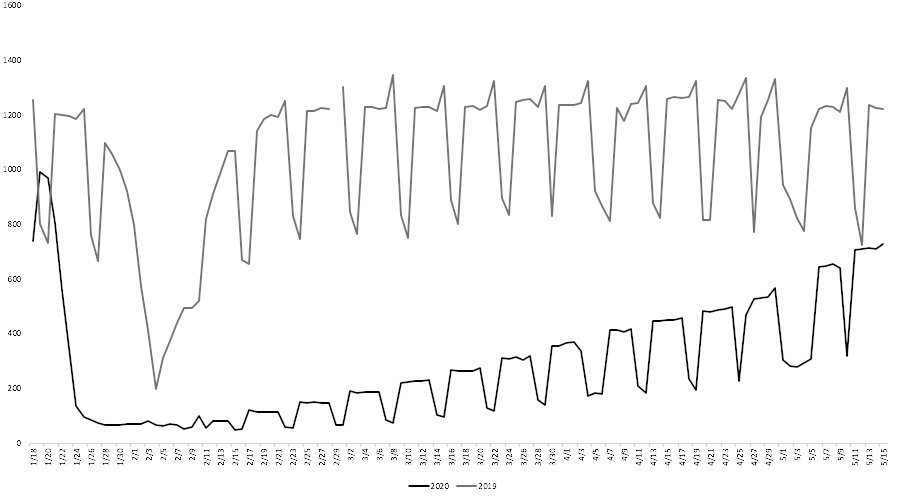
Tang Jie, one of the very smart students in my Sunday seminar, presented the following graph in today’s meeting. It shows subway ridership this year in 30 major Chinese cities compared to the same period last year. Jie pointed out at least three interesting things about this...
...graph. First, while subway ridership dropped sharply during Chinese New Year for both years, in 2019 it recovered within a week, whereas this year we have seen only a partial recovery over the 14 weeks of lockdown. As of last week ridership during the work week (the graph...
...shows, not surprisingly, how ridership is much higher on weekdays than on weekends) was just over 60% of 2019’s level.
Second, notice how every Friday, in 2019, ridership surges. This is almost certainly because after work, there is a second wave of ridership as people go...
Second, notice how every Friday, in 2019, ridership surges. This is almost certainly because after work, there is a second wave of ridership as people go...
...out on weekend nights. So far this year even as ridership recovers we haven’t seen the Friday surge. This shows pretty clearly that while life is returning to normal from a work perspective, it is taking longer from an entertainment perspective.
The third interesting thing...
The third interesting thing...
...about the graph reinforces the second: weekend ridership has recovered by a lot less than weekday ridership – it is just over 50% of normal. Together these suggest that it might take a lot longer for most people to return to their normal lives as consumers than to return...
...to their normal lives as workers.
Another of my students, Zhou Yizhing, checked usage on different entertainment apps that are popular in China. He found that normally these apps are more actively used on weekends than on weekdays, which wasn’t a surprise. This...
Another of my students, Zhou Yizhing, checked usage on different entertainment apps that are popular in China. He found that normally these apps are more actively used on weekends than on weekdays, which wasn’t a surprise. This...
...weekday/weekend divergence completely disappeared during the early weeks of the lockdown, which again isn’t a surprise as everyone stayed home.
In the last four weeks, however, the weekend/weekday divergence has re-emerged for entertainment apps that are more likely to be...
In the last four weeks, however, the weekend/weekday divergence has re-emerged for entertainment apps that are more likely to be...
...used by middle and upper income households, whereas it hasn’t re-emerged for entertainment apps that are more likely to be used by lower income households. We interpret this to suggest that middle and upper income households are far more likely to have returned to work than...
...lower income households, although the disparity is so striking that we are worried that we may be catching something else in the data, and so Yizhing plans do some more work on the topic.

 Read on Twitter


