I was asked by the UK Treasury to review intl. evidence on minimum wage, with focus on impact at higher levels.
My review is now out.
It aims to provide comprehensive, up-to-date assessment of how minimum wages affect labor market, esp jobs.
https://www.gov.uk/government/publications/impacts-of-minimum-wages-review-of-the-international-evidence
1/">https://www.gov.uk/governmen...
My review is now out.
It aims to provide comprehensive, up-to-date assessment of how minimum wages affect labor market, esp jobs.
https://www.gov.uk/government/publications/impacts-of-minimum-wages-review-of-the-international-evidence
1/">https://www.gov.uk/governmen...
Here is a press release from  https://abs.twimg.com/emoji/v2/... draggable="false" alt="🇬🇧" title="Flagge des Vereinigten Königreiches" aria-label="Emoji: Flagge des Vereinigten Königreiches"> @hmtreasury.
https://www.gov.uk/government/news/independent-review-backs-chancellor-pledge-for-higher-national-living-wage
2/">https://www.gov.uk/governmen...
https://www.gov.uk/government/news/independent-review-backs-chancellor-pledge-for-higher-national-living-wage
2/">https://www.gov.uk/governmen...
I want to thank Chancellor @sajidjavid and @PhilipHammondUK for their support in my conducting this review.
HUGE thanks to the awesome HMT/BEIS team whose help was super important!
And for help from @LPC, who play a key role making minimum wage a success story in UK.
3/
HUGE thanks to the awesome HMT/BEIS team whose help was super important!
And for help from @LPC, who play a key role making minimum wage a success story in UK.
3/
A higher minimum wage raises wages for those at the bottom. But does that come with the unintended consequence of fewer jobs?
Key factors:
• Labor-capital and labor-labor substitution
• How easily labor costs can be passed on to prices
• Extent of monopsony
4/
Key factors:
• Labor-capital and labor-labor substitution
• How easily labor costs can be passed on to prices
• Extent of monopsony
4/
There is a large literature on the employment effect of minimum wages for a wide variety of groups.
To make apples-to-apples comparison, I use “own-wage employment elasticity” (OWE) which scales the employment effect by the wage effect.
5/
To make apples-to-apples comparison, I use “own-wage employment elasticity” (OWE) which scales the employment effect by the wage effect.
5/
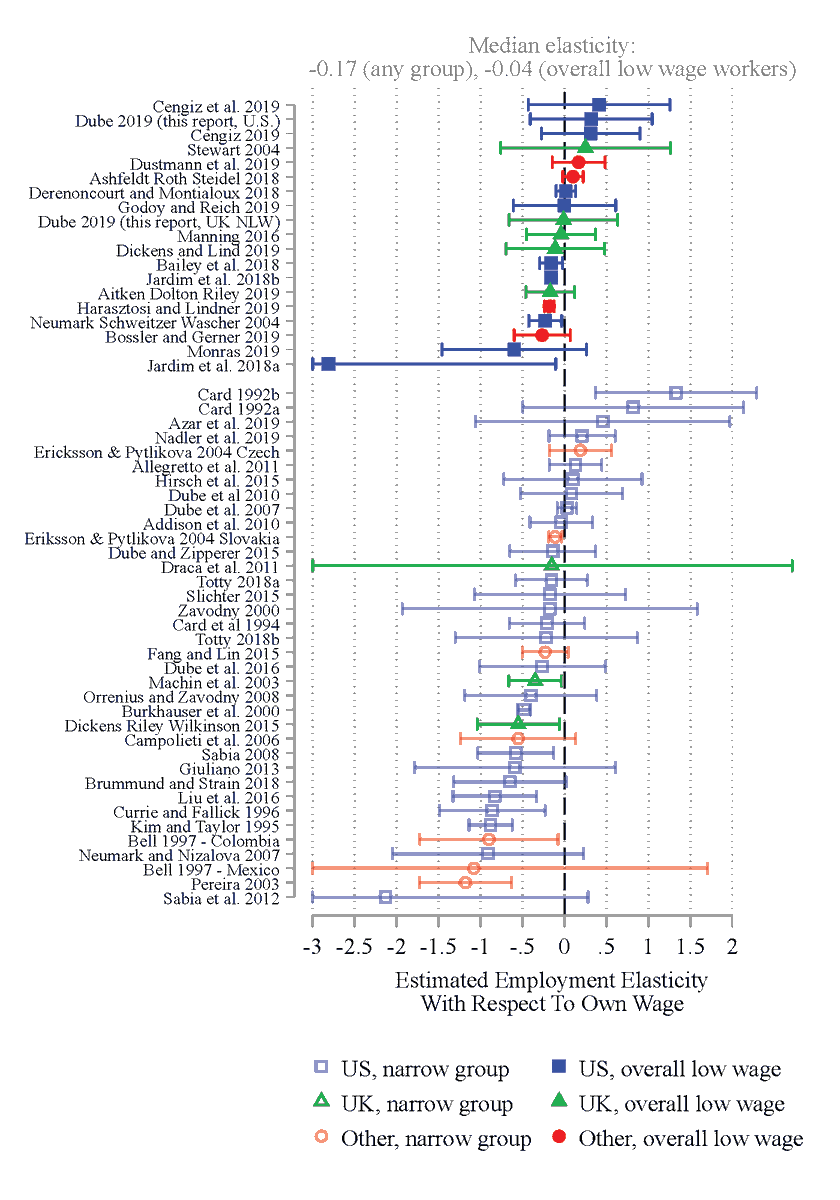
Here is arguably the most comprehensive picture to date of the literature on emp effects of min. wage that makes estimate comparable.
55 OWE estimates for all studies (esp US, UK, and other developed economies) that report both wage and emp effect that I was able to find.
6/
55 OWE estimates for all studies (esp US, UK, and other developed economies) that report both wage and emp effect that I was able to find.
6/
A key takeaway, across 55 estimates, the median OWE is around -0.17.
This is a very small number, and suggests MW raises wages much more than affect jobs: e.g., if a MW hike raises wages of group by 10%, it reduces employment by around 1.7%.
7/
This is a very small number, and suggests MW raises wages much more than affect jobs: e.g., if a MW hike raises wages of group by 10%, it reduces employment by around 1.7%.
7/
Importantly, when we consider studies that attempt to provide an *overall* employment effect (as opposed to for subgroups like teens), the OWE is around -0.04 (right around zero).
8/
8/
A good starting point to understand overall employment effects of MW in the US context is our 2019 QJE paper.
Shows how a minimum wage leads to fewer jobs paying below the new MW, but about equal # paying at or just above, leaving total # low wage jobs mostly unchanged.
9/
Shows how a minimum wage leads to fewer jobs paying below the new MW, but about equal # paying at or just above, leaving total # low wage jobs mostly unchanged.
9/
Our 2019 QJE paper also shows the effect by bite of the policy, relevant when considering the right level.
Overall, little indication of job losses for events going as high as 59% of the median wage. Relevant for UK case.
10/
Overall, little indication of job losses for events going as high as 59% of the median wage. Relevant for UK case.
10/
I also provide *new estimates* applying 2019 QJE methodology to recent big increases: states (CA,OR,WA,CO,NY,MA,ME) that raised minimum wages >$10.50 by 2018.
Bottom line: these policies had much bigger bite, but employment effects similar as before (OWE 0.32 [SE 0.37).
11/
Bottom line: these policies had much bigger bite, but employment effects similar as before (OWE 0.32 [SE 0.37).
11/
The details behind this new analysis are provided in Technical Annex A here: https://assets.publishing.service.gov.uk/government/uploads/system/uploads/attachment_data/file/844149/Annex_A_High_MW_States_in_US.pdf
12/">https://assets.publishing.service.gov.uk/governmen...
12/">https://assets.publishing.service.gov.uk/governmen...
There are papers that find more negative estimates in US context. Causal inference of policies is tricky! The report discusses a variety of recent US studies.
There& #39;s also publication bias, which boosts studies finding statistically significant findings of job loss.
13/
There& #39;s also publication bias, which boosts studies finding statistically significant findings of job loss.
13/
My report explains how some studies using longer panels (w/ 1980s and early 90s – a period w/o much MW variation) fall prey to quirky cyclicality of red/blue states in that period.
If you’re interested in understanding min wage controversy, read this section (p 37-40)!
14/
If you’re interested in understanding min wage controversy, read this section (p 37-40)!
14/
I also discuss new US research evaluating:
* big 1966 FLSA expansions during a high MW period
* recent city minimum wages
* effect in low-wage (high bite) counties.
15/
* big 1966 FLSA expansions during a high MW period
* recent city minimum wages
* effect in low-wage (high bite) counties.
15/
Next up: evidence from UK.
Because there is not variation in the nominal MW in UK, evaluations either compare groups with different bite, eg., by demography/region, or by pre-treatment wages.
16/
Because there is not variation in the nominal MW in UK, evaluations either compare groups with different bite, eg., by demography/region, or by pre-treatment wages.
16/
The consensus view in UK: 1999 intro of NMW raised wages with limited effect on jobs. There are some indications of slower job growth for some specific groups, but overall assessment is that it was a success. Thanks to @lpcminimumwage for commissioning research on this.
17/
17/
Perhaps the most compelling evidence comes from Manning 2016 who compares region-by-demograph groups with different shares below NMW in 1999. Very clear wage effect. Minimal employment effect.
18/
18/
The 2016 introduction of the NLW (raised pay substantially for those 25+) provided a further opportunity to assess the MW effects.
The bite in this period has been between 55 and 60% of median. So I payed particularly close attention to this evidence.
19/
The bite in this period has been between 55 and 60% of median. So I payed particularly close attention to this evidence.
19/
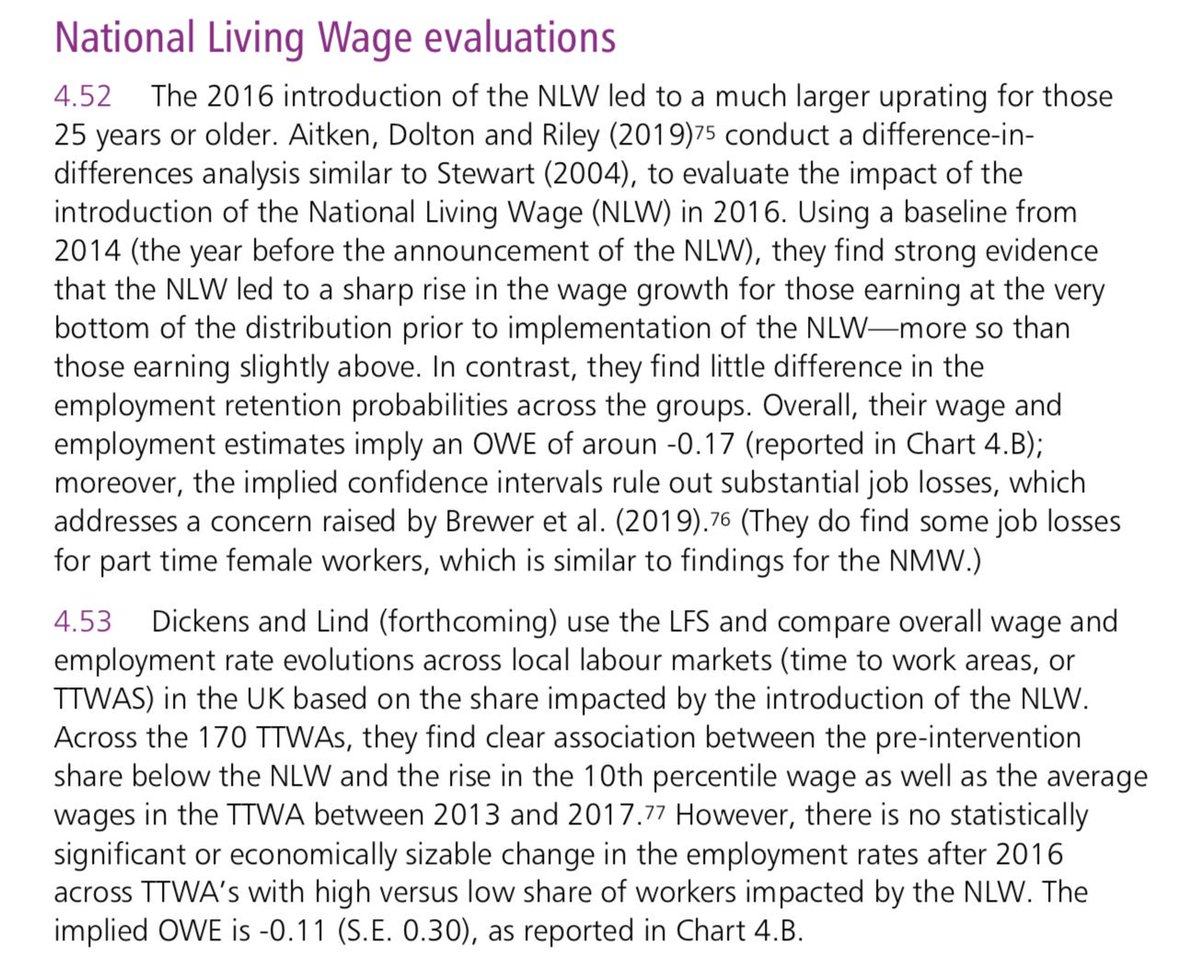
Work by @richardFDickens and others have suggested the overall impact through 2018 on overall low-wage employment has been quite modest. The relevant OWE& #39;s are in the -0.11 to -0.17 range: again quite small (and statistically indistinguishable from 0).
20/
20/
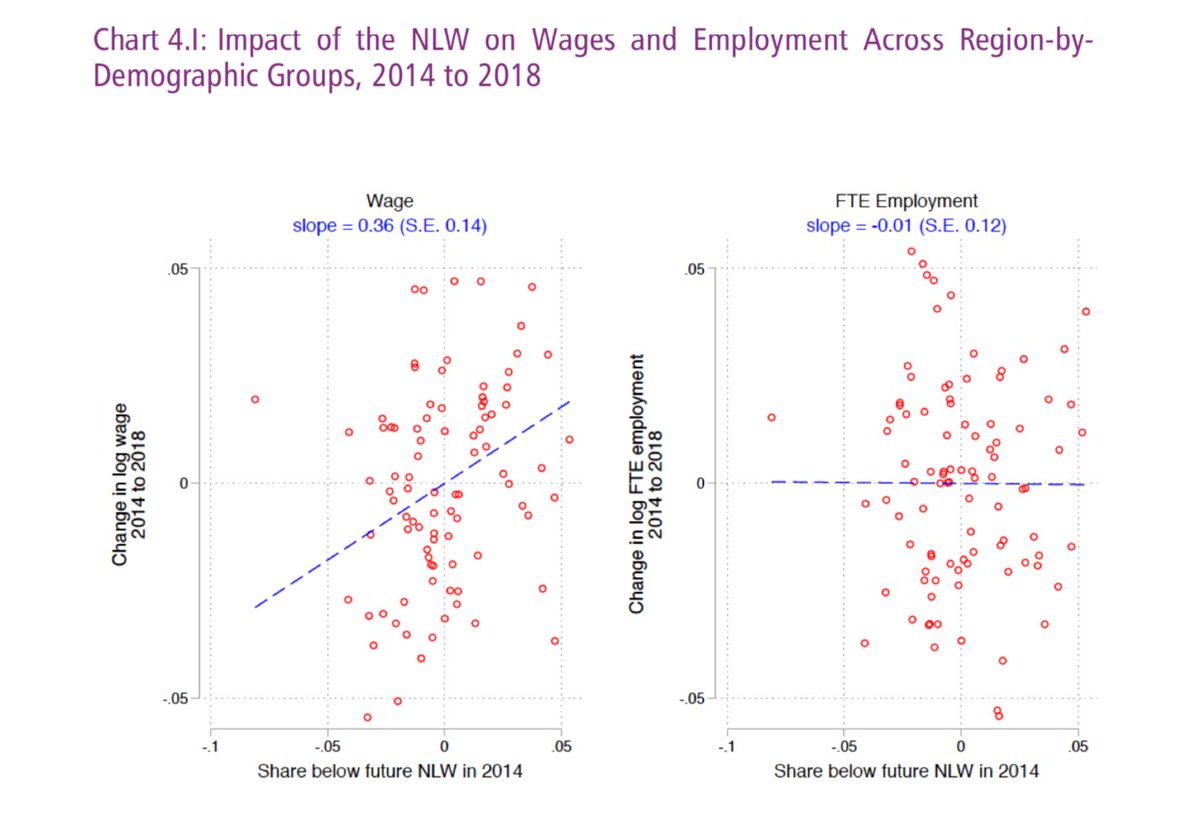
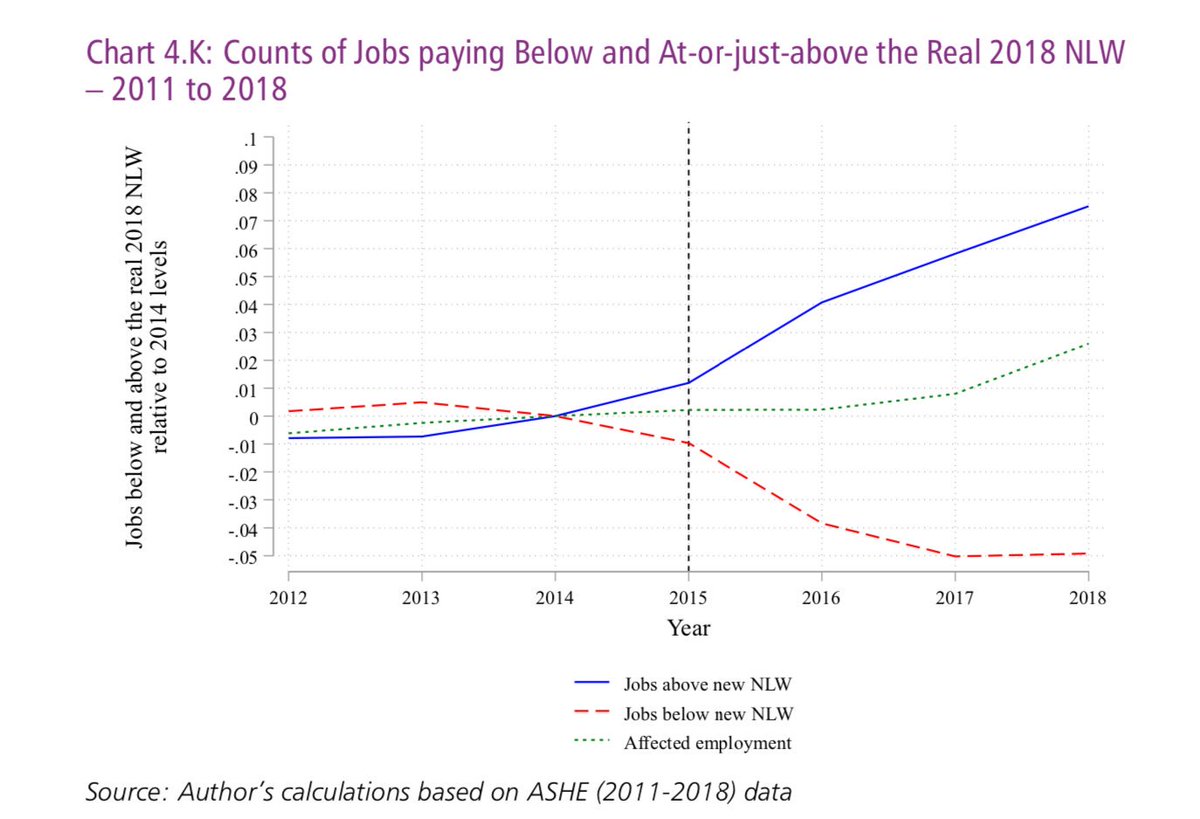
I also conducted my own investigation of the NLW using 2 different approaches
1) a grouping estimator comparing different region-demographic groups like Manning (2016).
2) a bunching estimator similar to what we did in US and others in Hungary.
21/.
1) a grouping estimator comparing different region-demographic groups like Manning (2016).
2) a bunching estimator similar to what we did in US and others in Hungary.
21/.
When I compared employment change between 2014 and 2018, using an approach similar to Manning 2016, I found a very clear wage increase by the 2014 shares below the NLW. But little effect on employment. Adjusting for hours the OWE was -0.01 (SE 0.12).
22/
22/
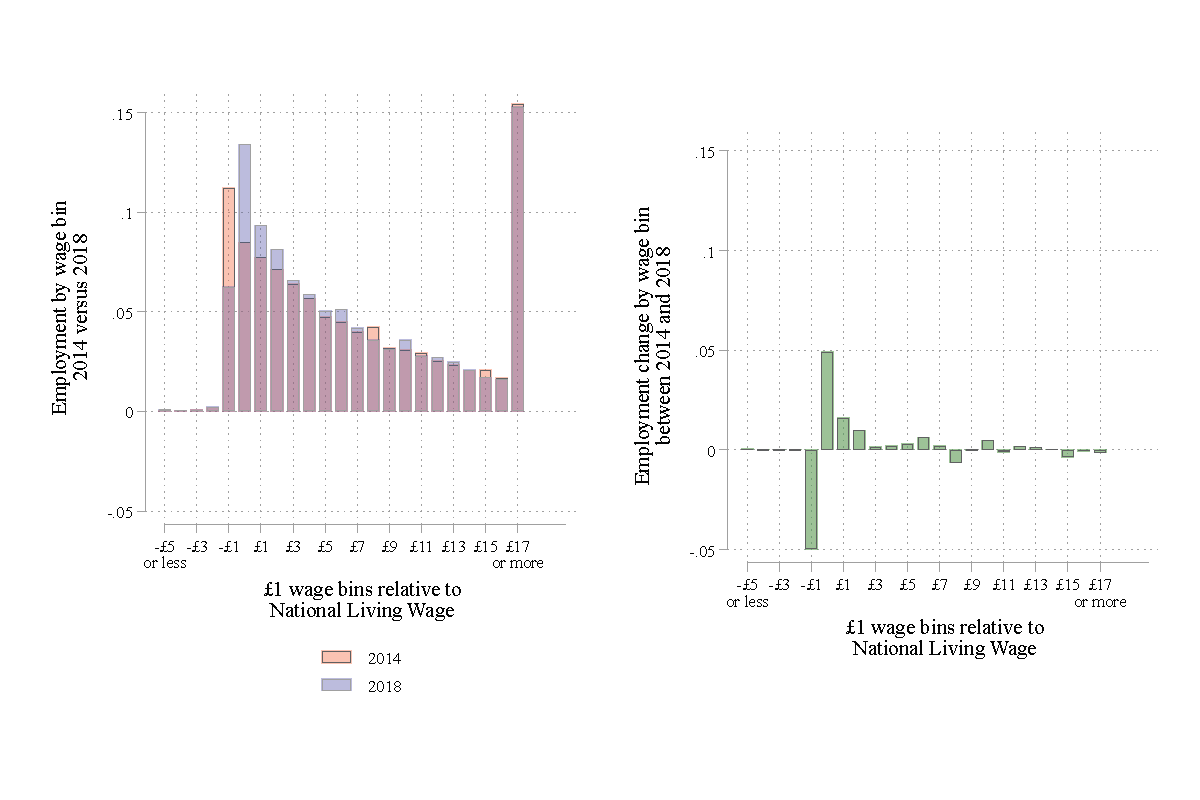
I also used a "bunching estimator" that shows how the # of jobs changed along the frequency distribution of real hourly wages. (Similar to our 2019 QJE paper, but using time series variation only, like Harasztosi & Lindner 2019)
Very clear bite. Little change in jobs.
23/.
Very clear bite. Little change in jobs.
23/.
The details behind these new estimates of the impact of the UK NLW can be found in Technical Annex B:
https://assets.publishing.service.gov.uk/government/uploads/system/uploads/attachment_data/file/844126/Dube_Review_Technical_Annex_B.pdf
24/">https://assets.publishing.service.gov.uk/governmen...
https://assets.publishing.service.gov.uk/government/uploads/system/uploads/attachment_data/file/844126/Dube_Review_Technical_Annex_B.pdf
24/">https://assets.publishing.service.gov.uk/governmen...
Finally, I also discuss the evidence from Germany and Hungary. The German evidence to date suggests somewhere between a small + and a small - OWE.
25/
25/
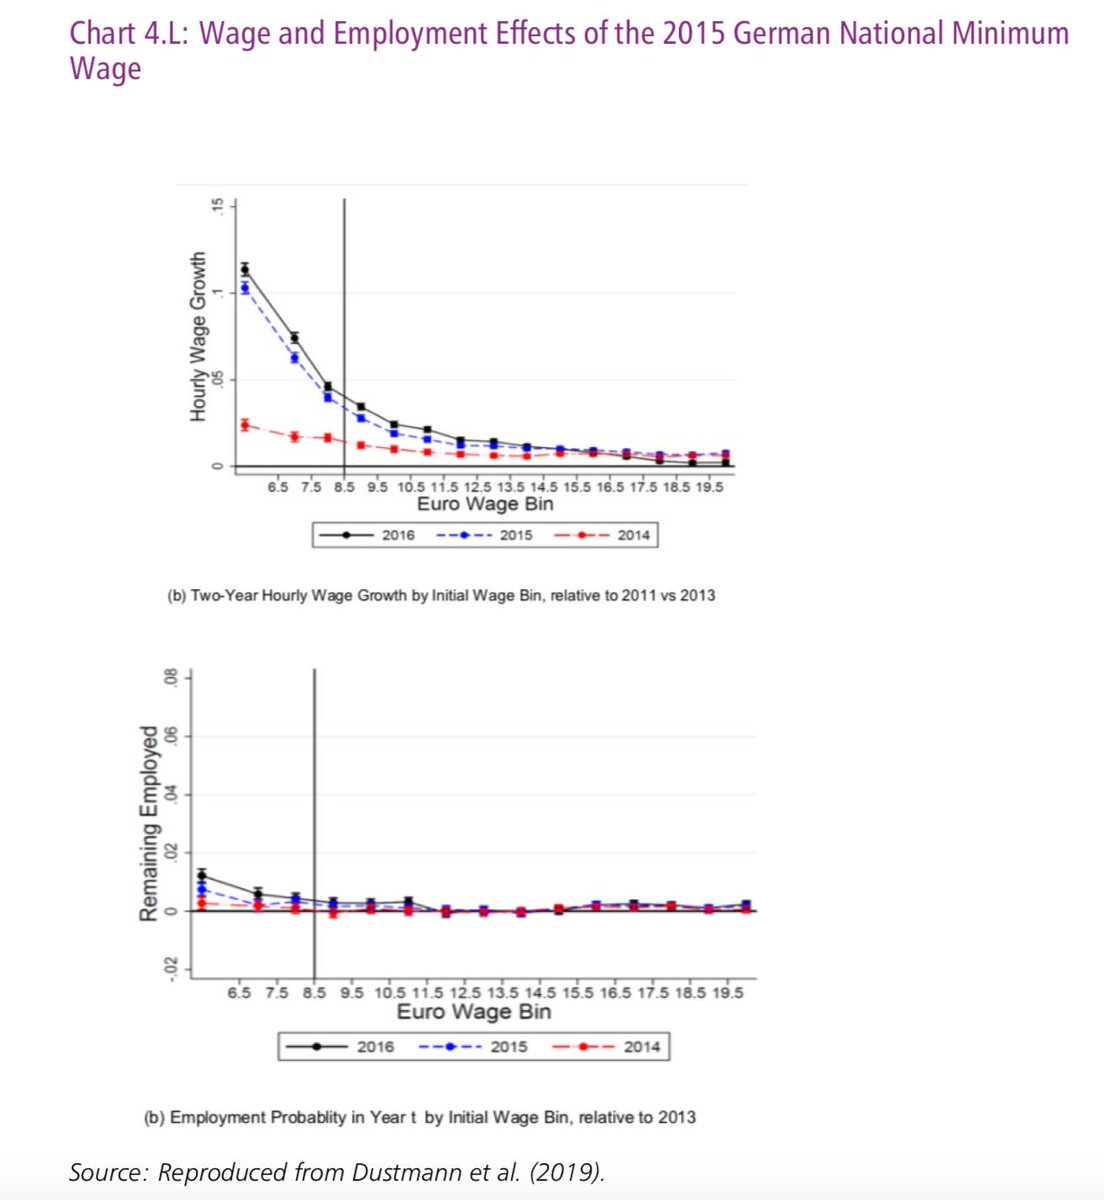
Dustmann et al. 2019 provides what I think is the most compelling evidence, in part because it also helps rationalize differences across other studies. Overall, an OWE of around 0.17.
Importantly, shows reallocation of work from low to high wage firms.
26/
Importantly, shows reallocation of work from low to high wage firms.
26/
Overall, across a fairly wide range of studies, including recent high quality evidence, I find the evidence in net points to fairly muted employment response.
Again, not every study, but the totality of evidence points in this direction.
27/.
Again, not every study, but the totality of evidence points in this direction.
27/.
Based on this evidence, I concluded that the UK government has room to explore a more ambitious NLW in the UK, in the range of 60% to two-thirds of the median wage.
At the same time, I stressed that there are unknowns! And that it is vital to keep an eye on the data.
28/
At the same time, I stressed that there are unknowns! And that it is vital to keep an eye on the data.
28/
It is important that the @lpcminimumwage is able to evaluate further changes in the NLW and NMW, and that these findings are used to recalibrate the policy trajectory as needed.
29/
29/
I also made a number of recommendations regarding the availability of timely and high quality data needed for evaluation.
Includes making ASHE data available earlier to researchers; making the administrative data from Real Time Information available for research purposes.
30/
Includes making ASHE data available earlier to researchers; making the administrative data from Real Time Information available for research purposes.
30/
Overall, I hope these findings will be of use to @lpcminimumwage, @hmtreasury & others interested in understanding how minimum wages affect the labor market, and those interested in using evidence to inform policy making.
Personally speaking, it was a great experience!
31/31
Personally speaking, it was a great experience!
31/31

 Read on Twitter
