https://twitter.com/8graphs/status/1009905800226267137">https://twitter.com/8graphs/s...
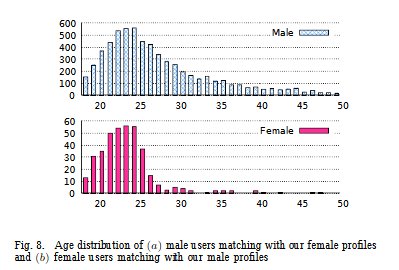
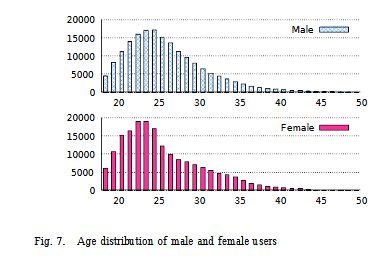
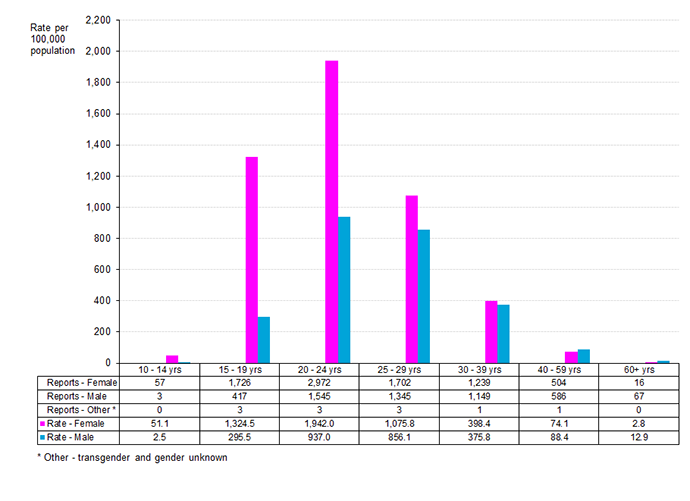
age of tinder users matching
there is a steep drop off after 25 for females
- biological imperative to settle, after tindering ?
and women use it more, when younger
there is a steep drop off after 25 for females
- biological imperative to settle, after tindering ?
and women use it more, when younger
https://twitter.com/GRITCULT/status/1007378251042435073">https://twitter.com/GRITCULT/...
Graphs, graphs and graphs
cite tweet : https://twitter.com/NotDeadGlomar/status/1021449626451312641">https://twitter.com/NotDeadGl...
cite tweet : https://twitter.com/NotDeadGlomar/status/1021449626451312641">https://twitter.com/NotDeadGl...
Lorenz curve for Tinder economy
lower than curve for US economy.
inequality in Tinder wealth distribution is larger than inequality of income in US
cite: https://medium.com/@worstonlinedater/tinder-experiments-ii-guys-unless-you-are-really-hot-you-are-probably-better-off-not-wasting-your-2ddf370a6e9a">https://medium.com/@worstonl...
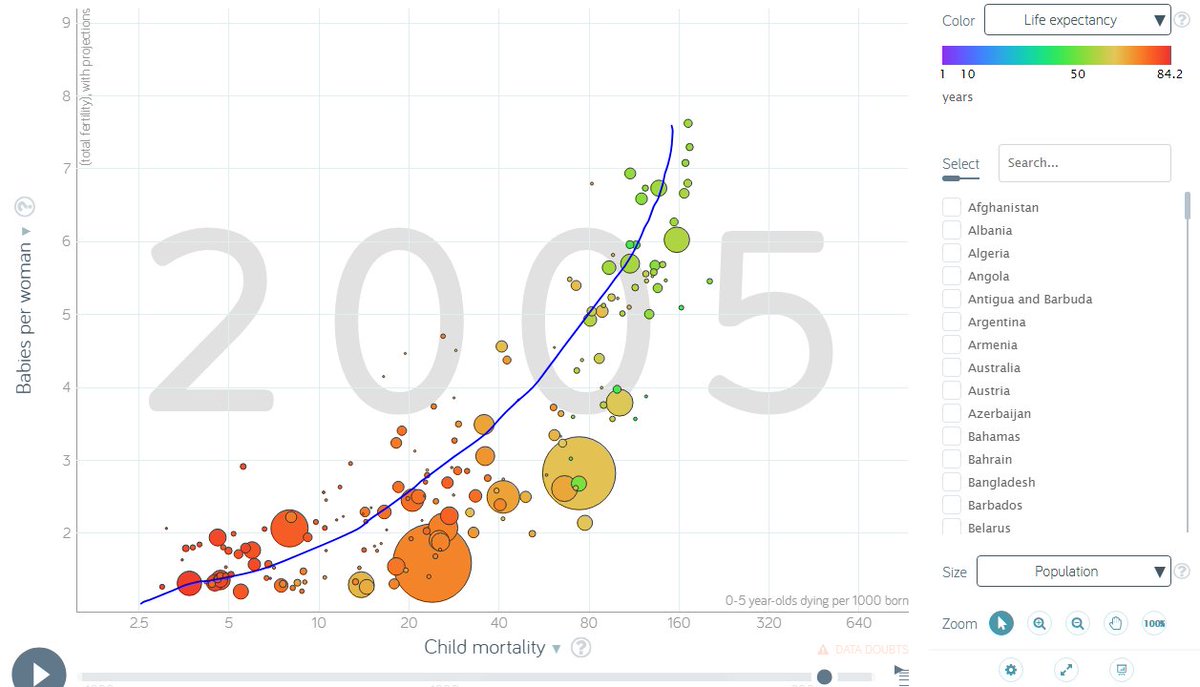
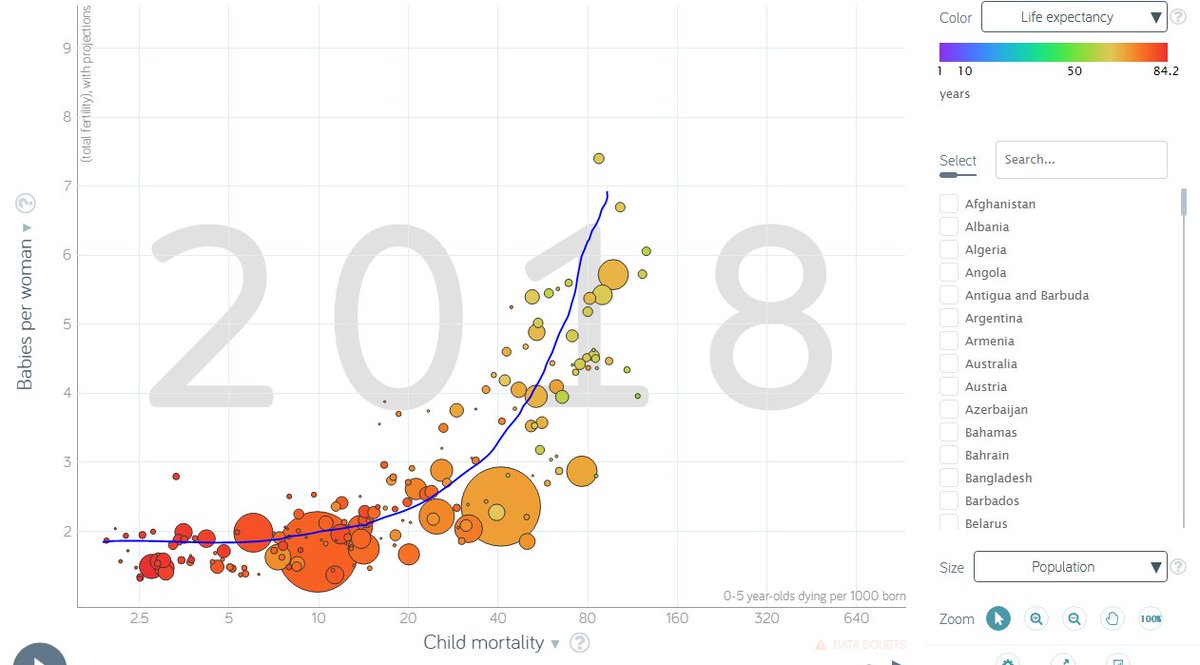
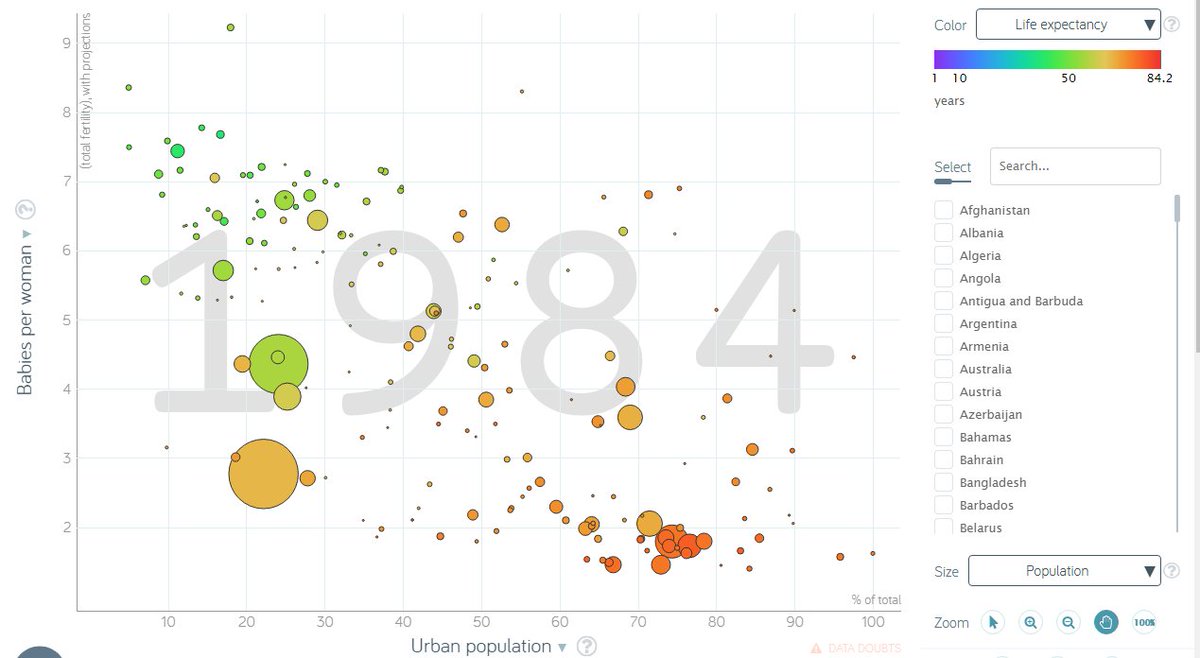
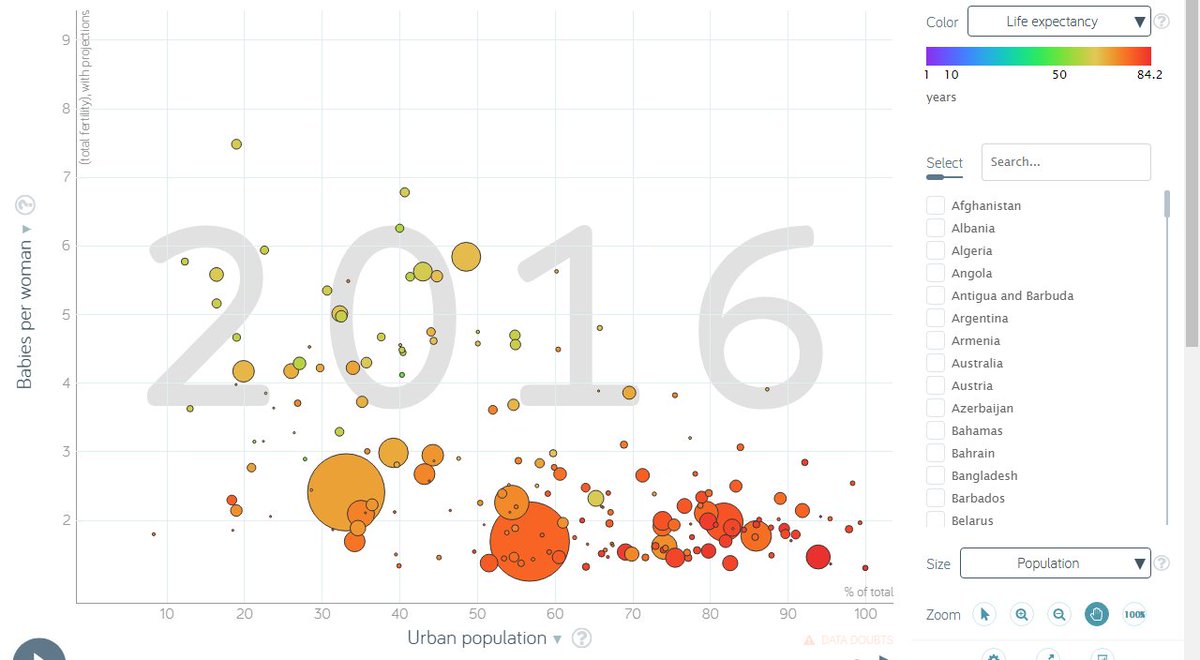
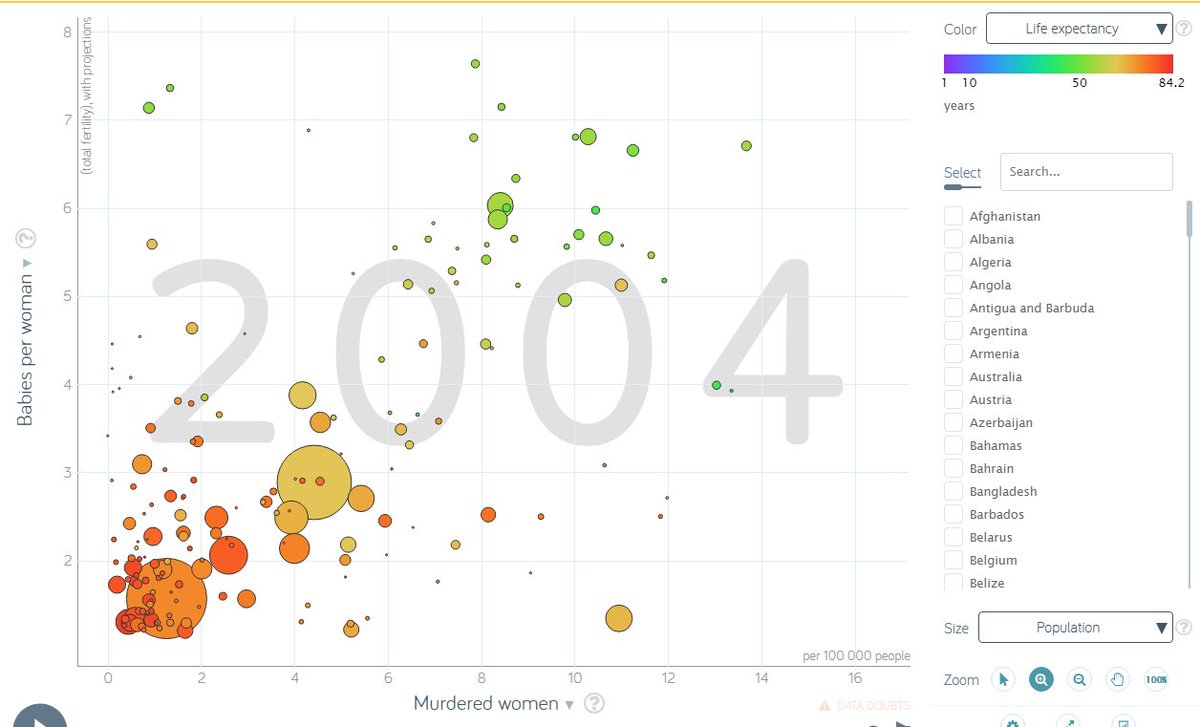
fertility rate
vs
urbanisation
1984
vs
2016
correlation :
high urbanisation and lower fertility rates
trend :
urbanisation increasing
fertility rate decrease across rural and urban areas
population has increased, but will see a reverse in trend
vs
urbanisation
1984
vs
2016
correlation :
high urbanisation and lower fertility rates
trend :
urbanisation increasing
fertility rate decrease across rural and urban areas
population has increased, but will see a reverse in trend
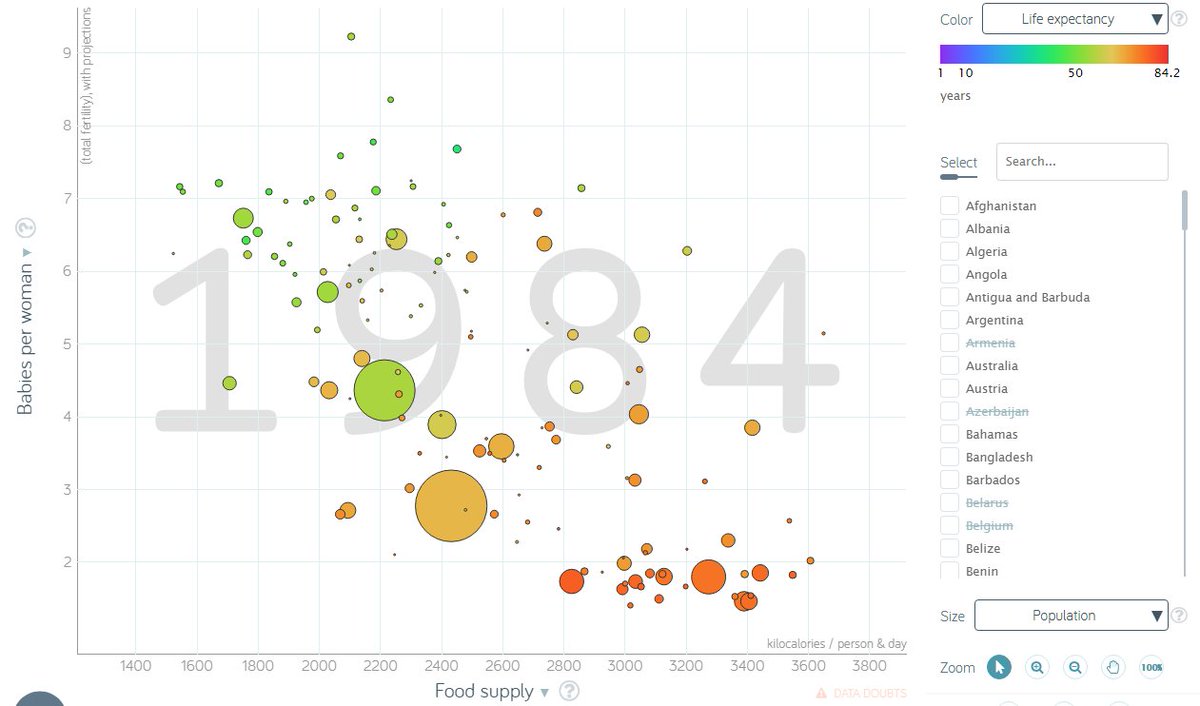
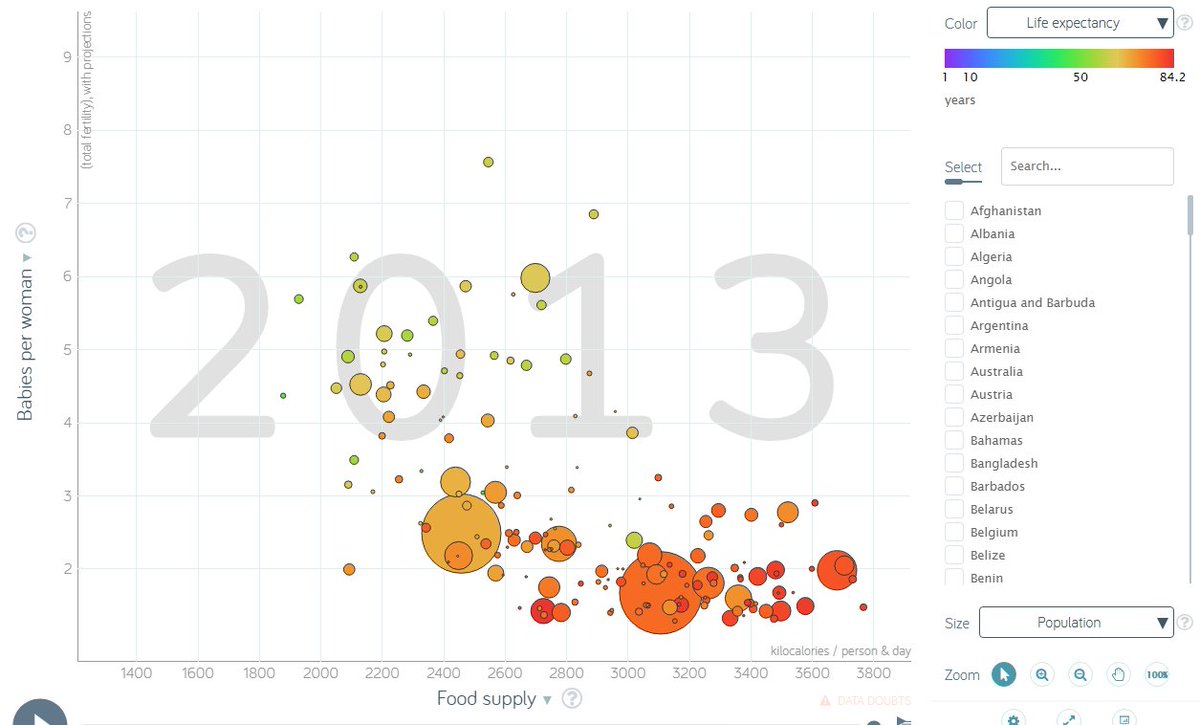
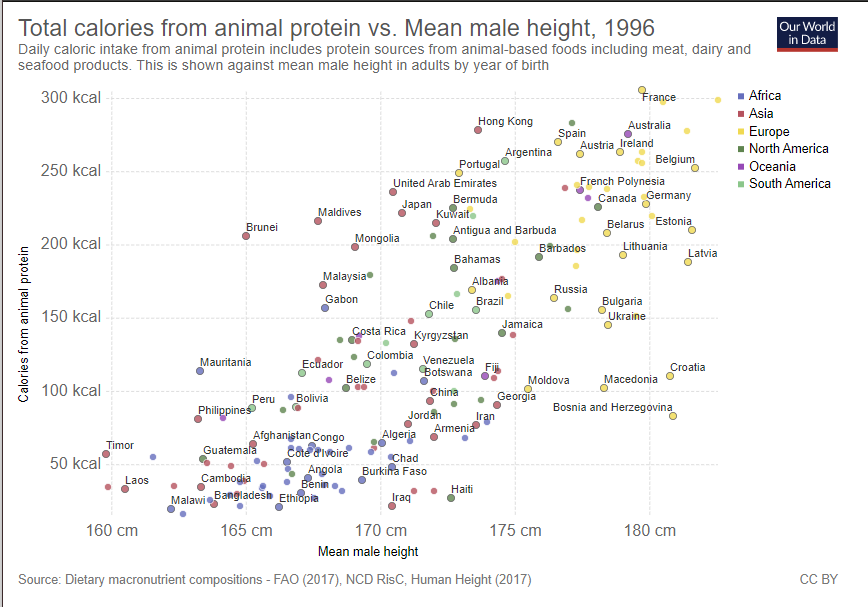
food supply increases
also correlates with
falling fertility rate
1984 vs 2013
(no im not saying being fat causes a decline in fertility)
also correlates with
falling fertility rate
1984 vs 2013
(no im not saying being fat causes a decline in fertility)
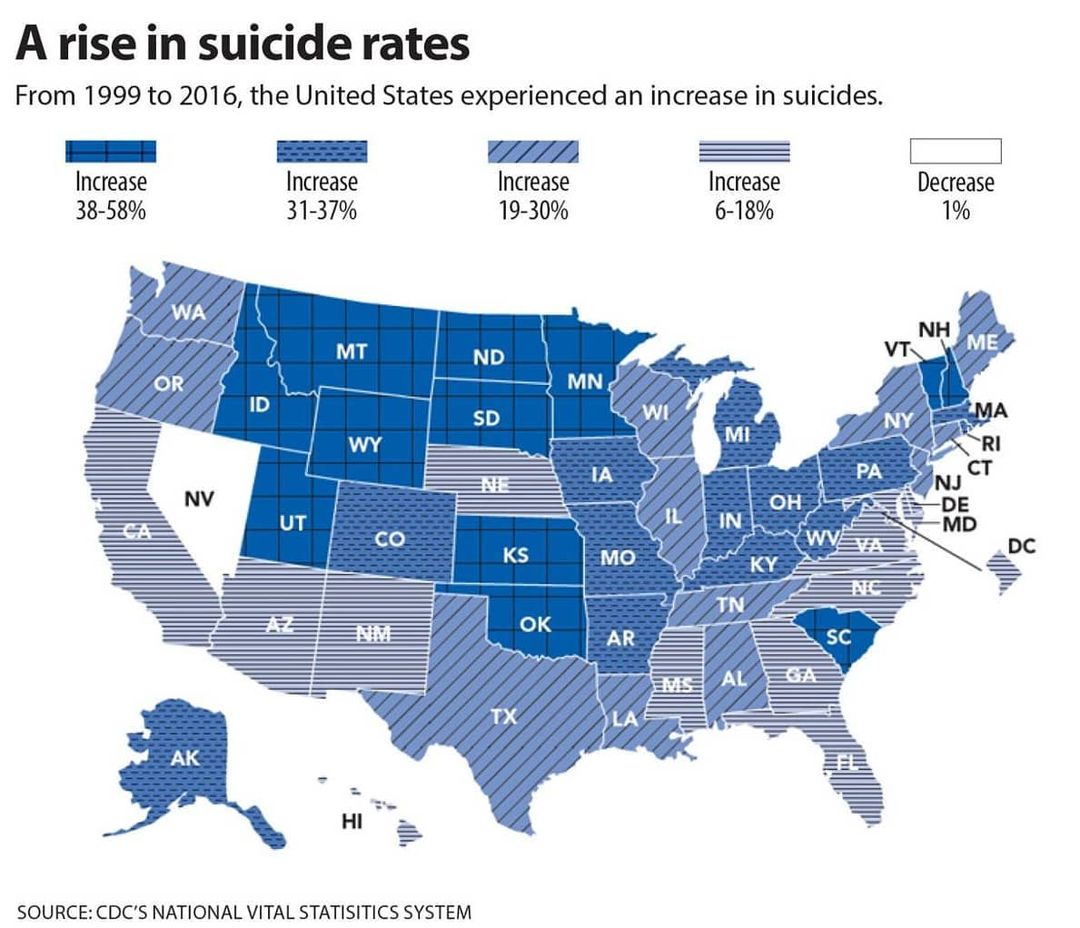
self employment rate and suicide rate
1984
2000
2005
less self employed, more suicide ?
most recent data is 10+ years old
trend doesnt look promising
1984
2000
2005
less self employed, more suicide ?
most recent data is 10+ years old
trend doesnt look promising
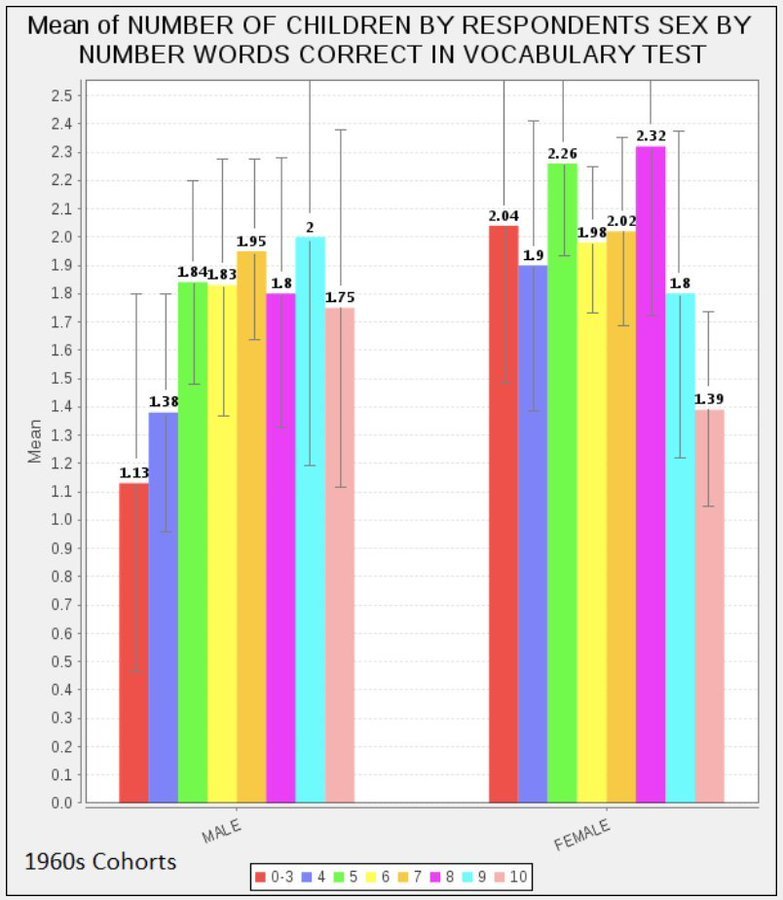
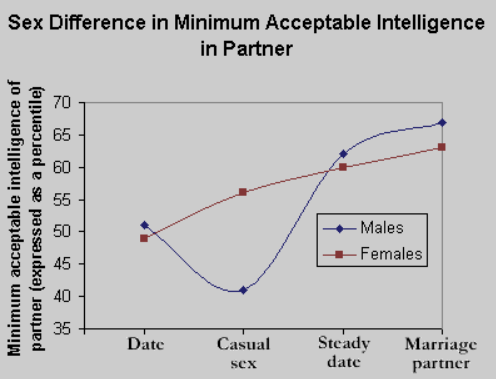
lower iq *tends* to have sex more
ergo
sex younger ages
higher iq => less kids
or kids later age => genetic degradation ?
but those from latter households tend to better
effect has to be observed over multiple generations to be empirical imo https://twitter.com/17cShyteposter/status/1029957892449812480">https://twitter.com/17cShytep...
cite : https://unews.utah.edu/u-researcher-more-sex-partners-before-marriage-doesnt-necessarily-lead-to-divorce/">https://unews.utah.edu/u-researc...
From : "30 Years of American Anxieties - What 20,000 letters to an advice columnist"
declining religious issues correlate with increasing LGBT issues
the most debated issues
source : https://pudding.cool/2018/11/dearabby/">https://pudding.cool/2018/11/d...
declining religious issues correlate with increasing LGBT issues
the most debated issues
source : https://pudding.cool/2018/11/dearabby/">https://pudding.cool/2018/11/d...
Porn Vs cocaine.
Cite; http://thevisualcommunicationguy.com/wp-content/uploads/2014/09/Infographic_PornVsCocaine2.jpg">https://thevisualcommunicationguy.com/wp-conten...
Cite; http://thevisualcommunicationguy.com/wp-content/uploads/2014/09/Infographic_PornVsCocaine2.jpg">https://thevisualcommunicationguy.com/wp-conten...
https://fightthenewdrug.org/how-consuming-porn-can-lead-to-violence/
One">https://fightthenewdrug.org/how-consu... example of citation : https://www.tandfonline.com/doi/abs/10.1080/01639625.1994.9967974">https://www.tandfonline.com/doi/abs/1...
One">https://fightthenewdrug.org/how-consu... example of citation : https://www.tandfonline.com/doi/abs/10.1080/01639625.1994.9967974">https://www.tandfonline.com/doi/abs/1...
Unmarried males and days lost.
Quite a high magnitude effect on health.
Link to earlier deaths. Usually correlated with loneliness and male suicide.
They measure regression of cause and thus likelihood of health impact
https://www.ncbi.nlm.nih.gov/pubmed/8350032/
Stress">https://www.ncbi.nlm.nih.gov/pubmed/83... as a epigenetic factor.
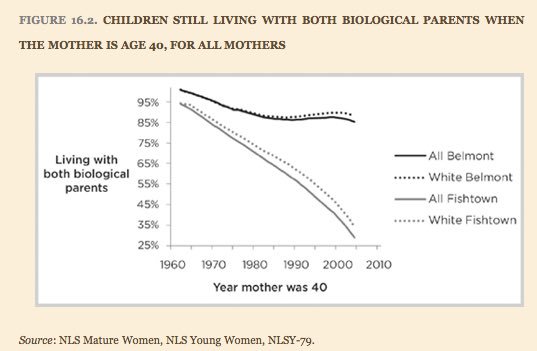
Children living with both biological parents
Affluent families in 1960: 95%
Working class families in 1960: 95%
Affluent families in 2005: 85%
Affluent families in 1960: 95%
Working class families in 1960: 95%
Affluent families in 2005: 85%
very interesting and counter intuitive.
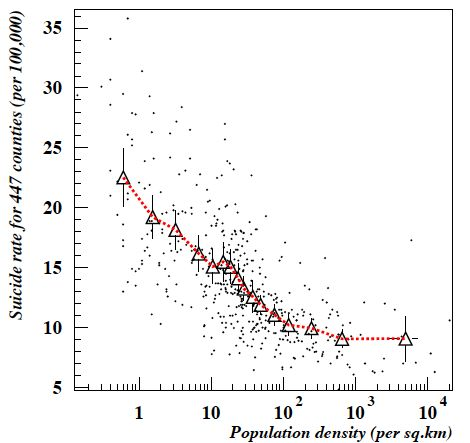
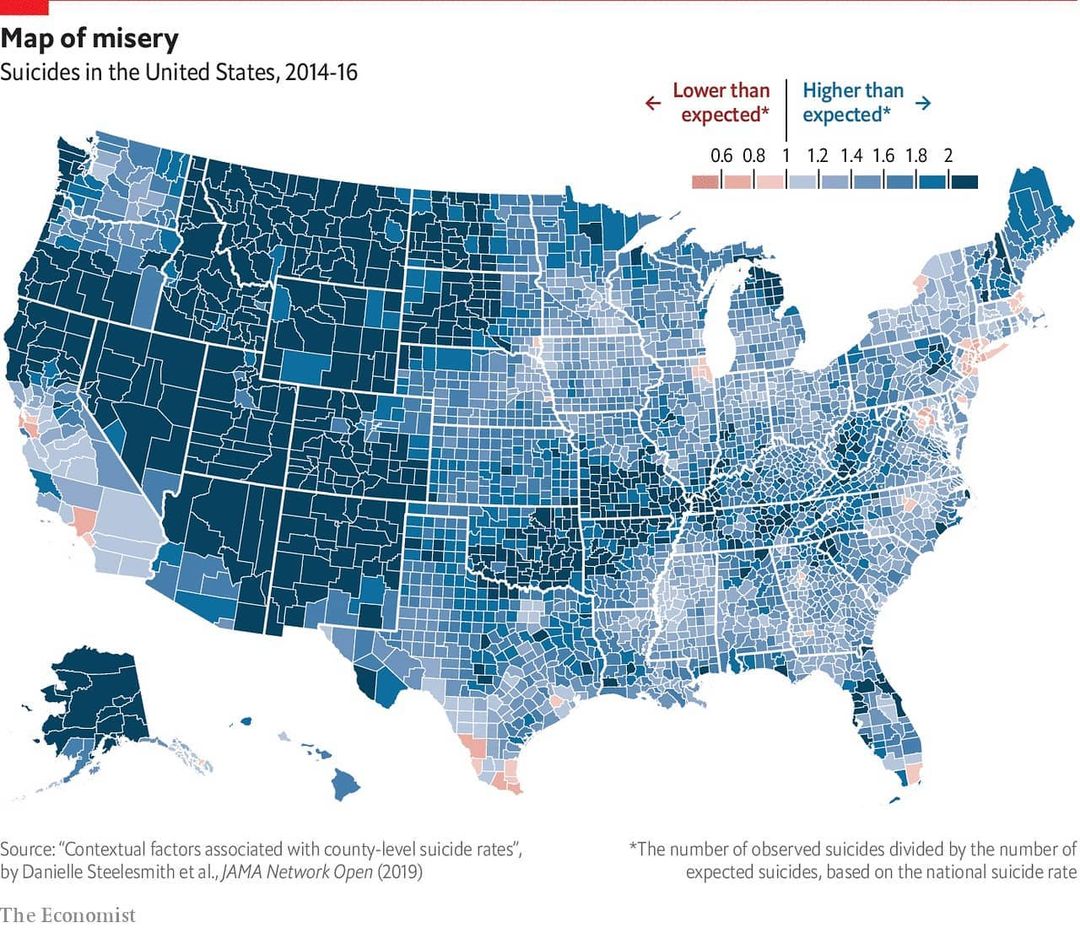
lower population density = higher suicide rate
https://lifeedited.com/sprawl-linked-to-suicide-violent-death-and-unemployment/">https://lifeedited.com/sprawl-li...
lower population density = higher suicide rate
https://lifeedited.com/sprawl-linked-to-suicide-violent-death-and-unemployment/">https://lifeedited.com/sprawl-li...
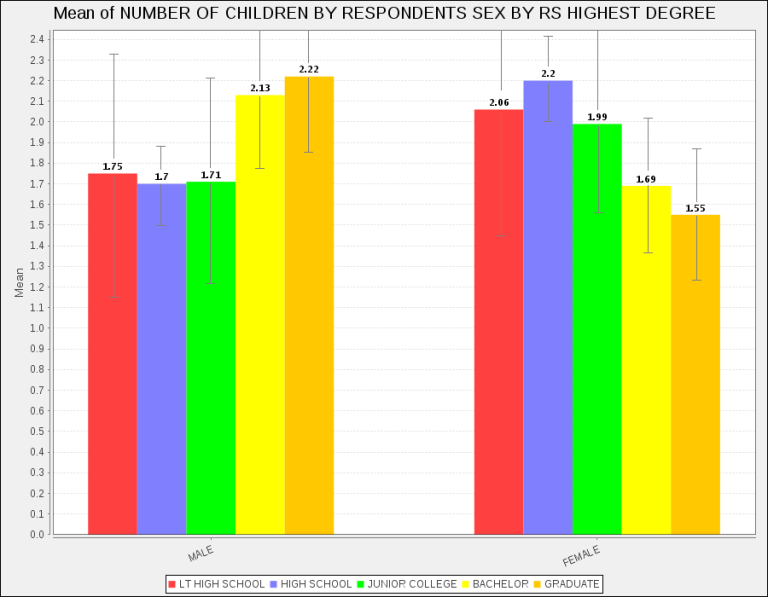
Intelligence leads to lower fertility in women, but higher fertility in men. https://jaymans.wordpress.com/2014/07/28/idiocracy-can-wait/">https://jaymans.wordpress.com/2014/07/2...
h/t @sovereignfamily
my main criticism, is how outdated this data is however. still fascinating.
h/t @sovereignfamily
my main criticism, is how outdated this data is however. still fascinating.
Again no.
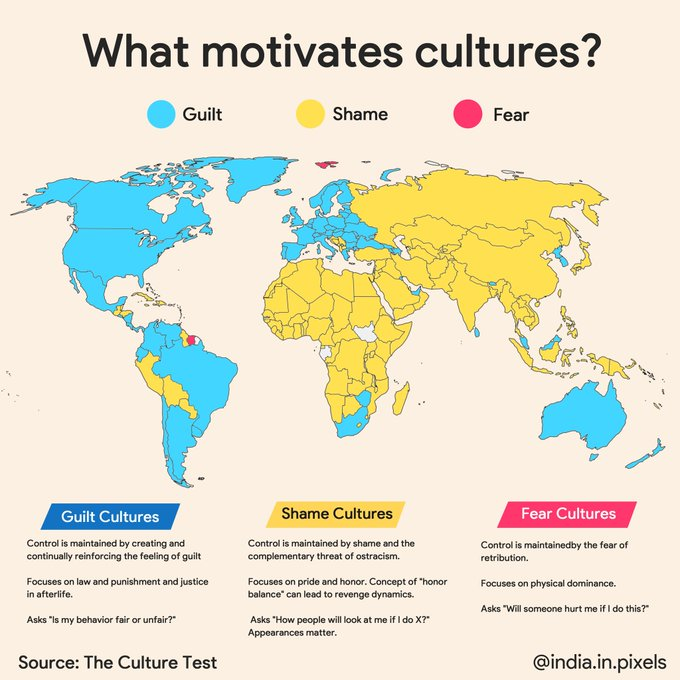
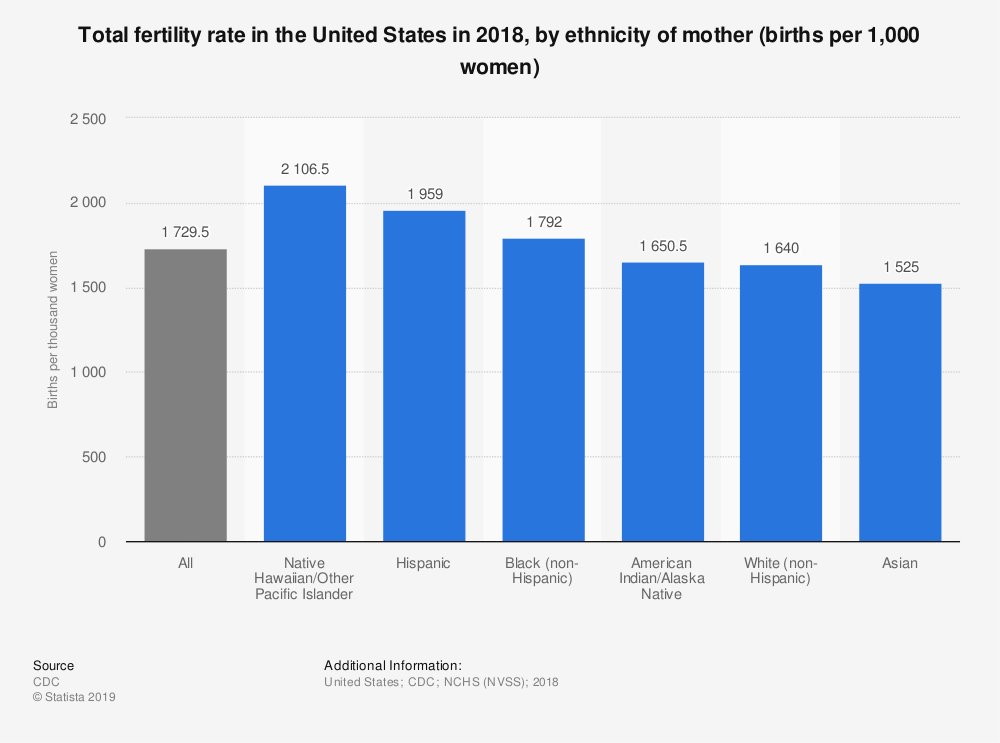
Japan is breeding less. And whites breeding more than asians. It could be a cultural cause.
Also disproves theory Africans breed Most
https://twitter.com/rozzaboyo/status/1297259979032760320?s=20">https://twitter.com/rozzaboyo...
Japan is breeding less. And whites breeding more than asians. It could be a cultural cause.
Also disproves theory Africans breed Most
https://twitter.com/rozzaboyo/status/1297259979032760320?s=20">https://twitter.com/rozzaboyo...
Posting graphs in my graph thread.
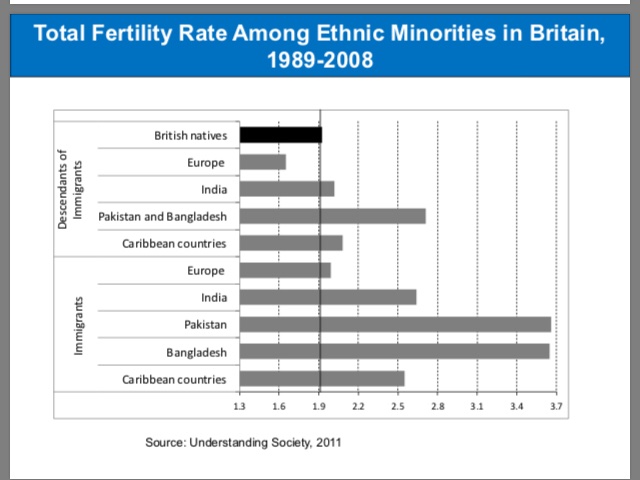
This is a break down of UK natives cite https://www.humanfertility.org/Docs/Symposium2/HKulu.pdf">https://www.humanfertility.org/Docs/Symp...
https://twitter.com/rozzaboyo/status/1297262339041894405?s=20">https://twitter.com/rozzaboyo...
The rate is 1.9
I might check the raw data myself n run regressions and make a blog post on it.
Criticism is that& #39;s it& #39;s UK and 9 year old data
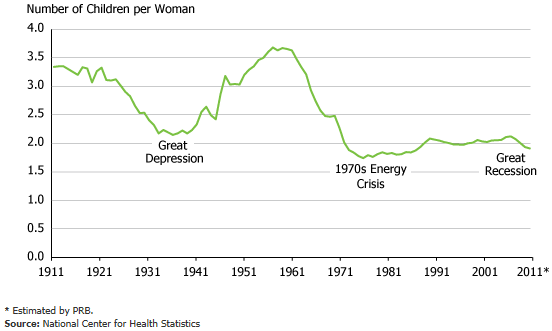
Graph showing the time line of women’s rights and fertility rate.
https://twitter.com/KHyperborea/status/1297269455739744258?s=20
My">https://twitter.com/KHyperbor... main thesis for university centered around liberalisation via industrialisation and it’s effect on population dynamics and fertility.
https://twitter.com/KHyperborea/status/1297269455739744258?s=20
My">https://twitter.com/KHyperbor... main thesis for university centered around liberalisation via industrialisation and it’s effect on population dynamics and fertility.
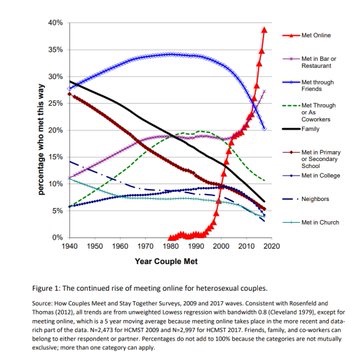
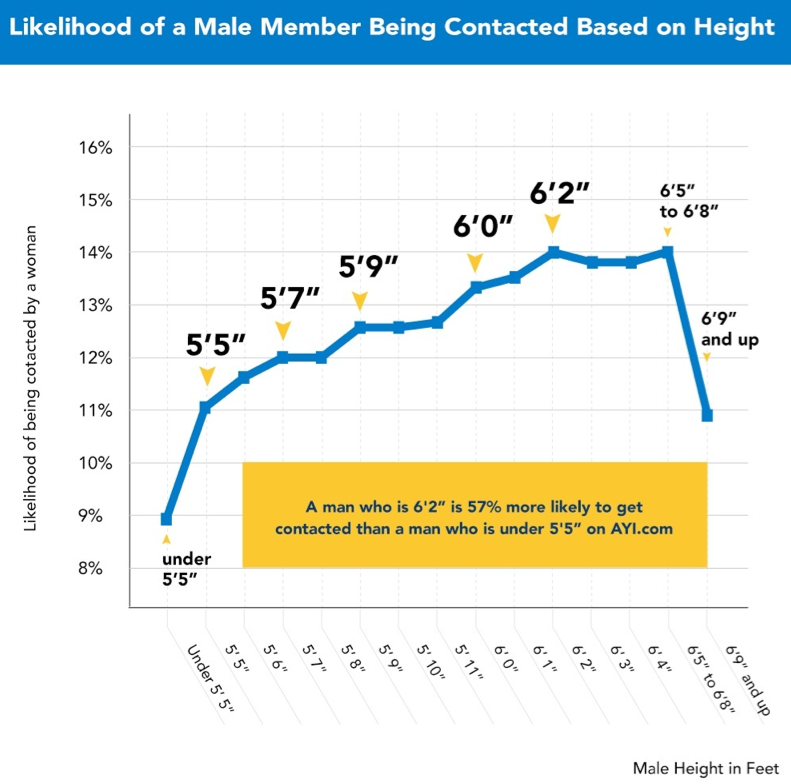
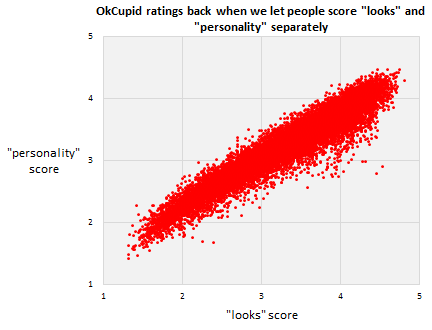
adding trends of "dating" and meeting partner into this thread.
https://twitter.com/GRITCULT/status/1302615256129249280?s=20
the">https://twitter.com/GRITCULT/... thread is from the larger impacts of remote working and the dematerialisation of the "office" as a conceptual space.
https://twitter.com/GRITCULT/status/1302615256129249280?s=20
the">https://twitter.com/GRITCULT/... thread is from the larger impacts of remote working and the dematerialisation of the "office" as a conceptual space.
thread on contractors and gig economy.
graph showing increasing gig workers. https://twitter.com/GRITCULT/status/1302614599959801856?s=20">https://twitter.com/GRITCULT/...
graph showing increasing gig workers. https://twitter.com/GRITCULT/status/1302614599959801856?s=20">https://twitter.com/GRITCULT/...
correction above graph is for mortality of birth https://twitter.com/fistlosopher/status/1308025099333771265?s=20">https://twitter.com/fistlosop...
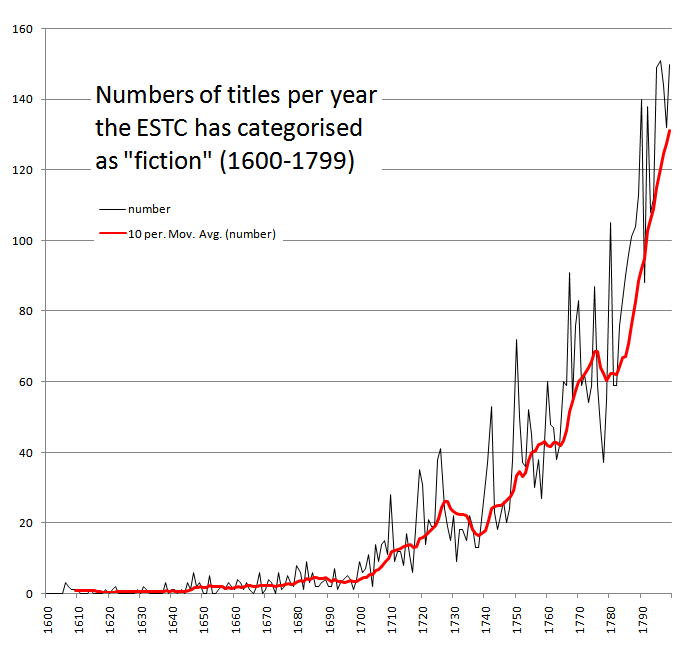
interesting graphs about books.
the amount published has skyrocketed.
the average price of books has effectively now gone to zero. with PDFs... that you can copy and paste...
https://twitter.com/GRITCULT/status/1308845423176675329?s=20">https://twitter.com/GRITCULT/...
the amount published has skyrocketed.
the average price of books has effectively now gone to zero. with PDFs... that you can copy and paste...
https://twitter.com/GRITCULT/status/1308845423176675329?s=20">https://twitter.com/GRITCULT/...
i think this graph is very interesting.
it shows the effects of the seismic shift... but main detail is that it occured over a long period of time, and it fluctuated up and down... much like the markets shifting... its never smooth nor overnight
it shows the effects of the seismic shift... but main detail is that it occured over a long period of time, and it fluctuated up and down... much like the markets shifting... its never smooth nor overnight
Graph of "knowledge" or data doubling in an exponential manner.
now if you pair this with my theoritical graph on subsequent disruptions by innovations. https://twitter.com/GRITCULT/status/1311026918855245833?s=20
the">https://twitter.com/GRITCULT/... diffusion rate lowers for the innovation to spread out...
now if you pair this with my theoritical graph on subsequent disruptions by innovations. https://twitter.com/GRITCULT/status/1311026918855245833?s=20
the">https://twitter.com/GRITCULT/... diffusion rate lowers for the innovation to spread out...
https://twitter.com/GRITCULT/status/1031927609058181120?s=20">https://twitter.com/GRITCULT/...
thread that has alot of graphs on japan and the demographics of japan. https://twitter.com/GRITCULT/status/1313612327426678784?s=20">https://twitter.com/GRITCULT/...
h/t @LINDY_POPSTAR
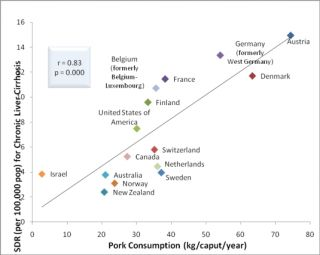
liver cirrhosis, and pork consumption, and alcohol consumption.
h/t to limoo from my discord server idk his twitter @ sorry bro
h/t to limoo from my discord server idk his twitter @ sorry bro
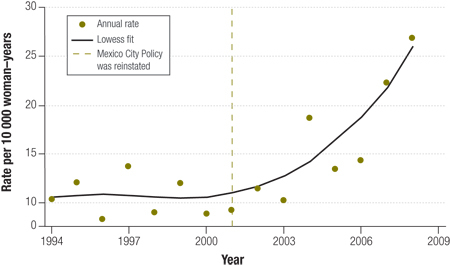
graphs of abortion in sub sahara africa
(left)
and
graphs of US aid and "democratisation" in sub sahara africa (right)
(left)
and
graphs of US aid and "democratisation" in sub sahara africa (right)
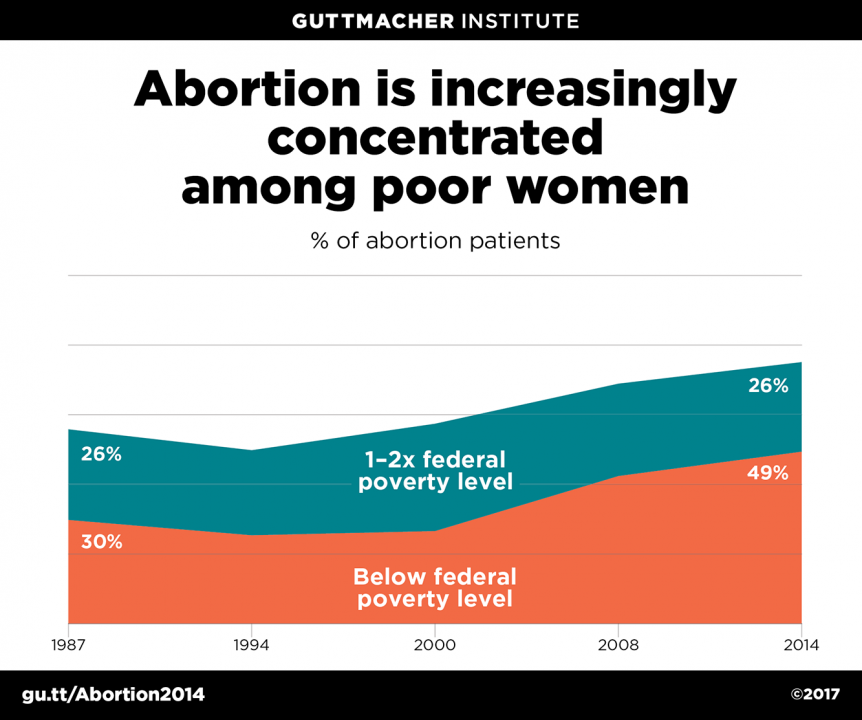
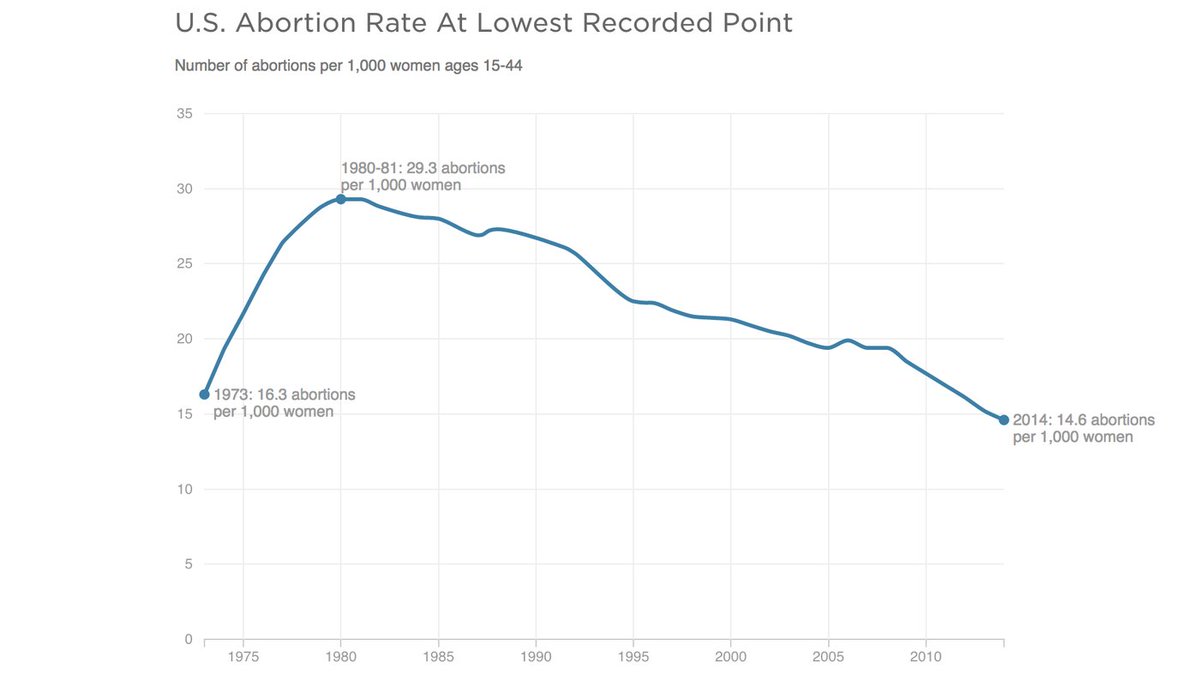
abortion for poor women going up. yet abortion rate declining overall
could be correlated with education improving in society but decreasing in low income areas, also low income areas tend to have higher birth rate.
could be correlated with education improving in society but decreasing in low income areas, also low income areas tend to have higher birth rate.
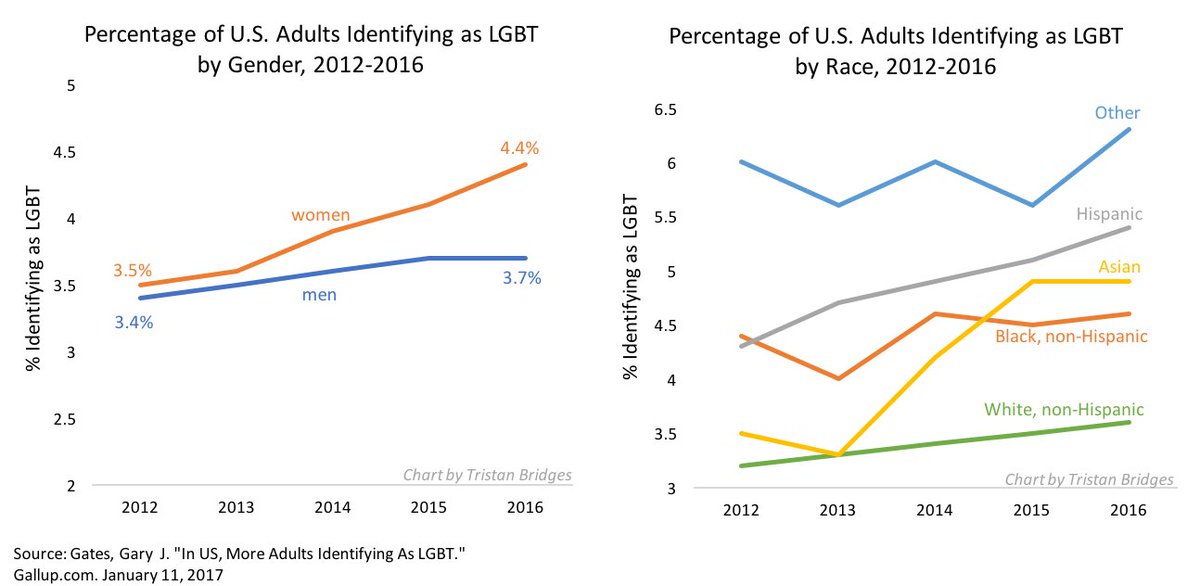
lgbt self identification rates going up.
lgbt marriage support going up
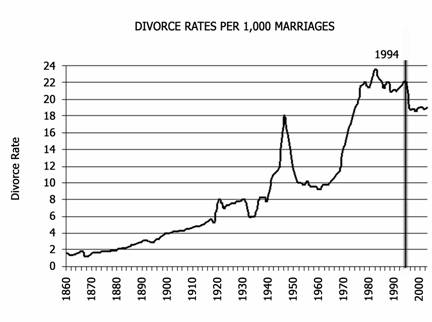
divorce rate for all marriage going up
lgbt marriage support going up
divorce rate for all marriage going up
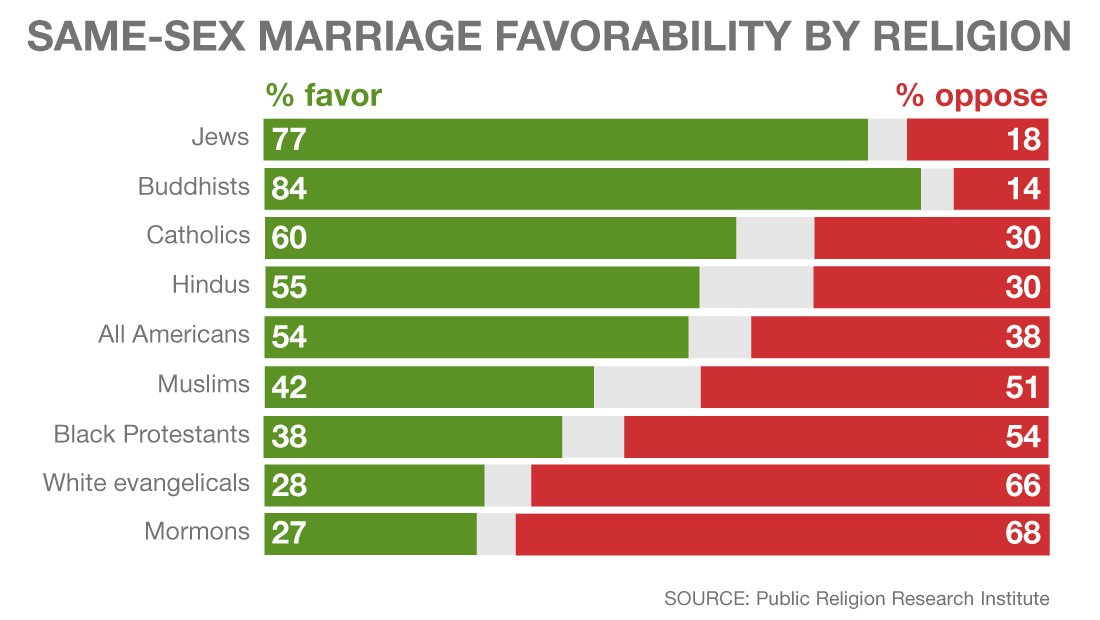
jewish people the most in favour of LGBTQ marriage
whereas other minorities more opposed,
non religoius / atheist also in favour for LGBTQ marriage
whereas other minorities more opposed,
non religoius / atheist also in favour for LGBTQ marriage
consistent finding of jewish people and their strong support of Gay Marriage, also buddhists tend to be more in favour of LGBTQ marriage
catholics tend to be more pro LGBTQ marriage than muslims, mormons the least.
catholics tend to be more pro LGBTQ marriage than muslims, mormons the least.
declining menarche age and increasing of birth out of wedlock. v also increase in gdp and increasing divorce rates
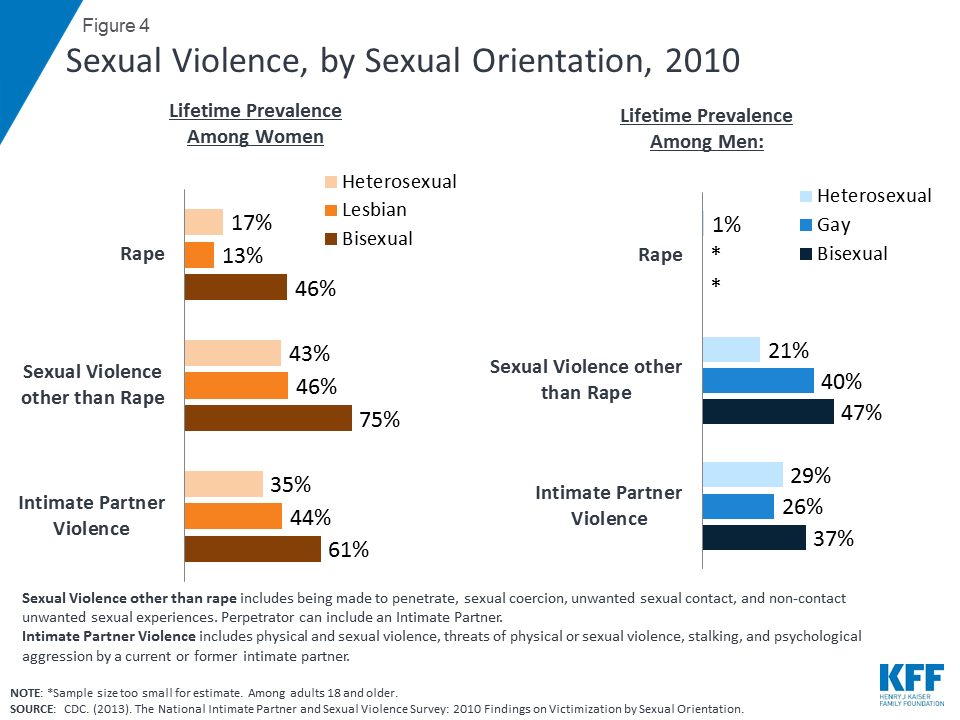
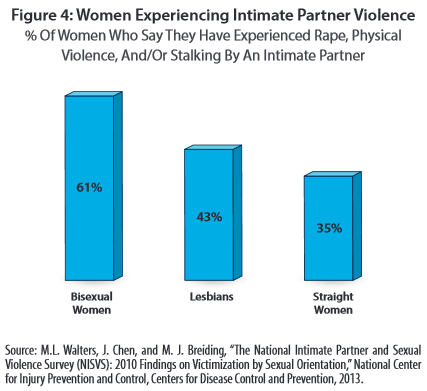
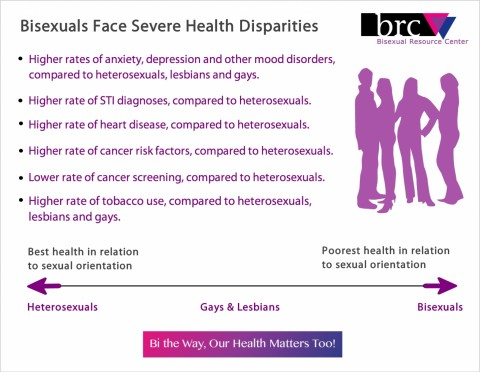
lgbt tend to have poorer mental health and sexual health and general health
also more intimate partner violence comparatively.
also more intimate partner violence comparatively.
both genders are likely to lie about the number of partners they have slept with.
but men exaggerate and women decrease the number
but women lie more than men regarding decreasing partner number
but men exaggerate and women decrease the number
but women lie more than men regarding decreasing partner number
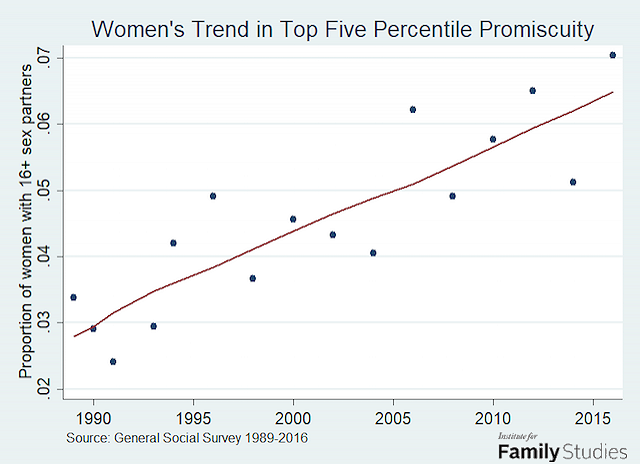
% of women who have 16+ partners is steadily increasing.
and
divorce rate and number of sexual partners
and
divorce rate and number of sexual partners
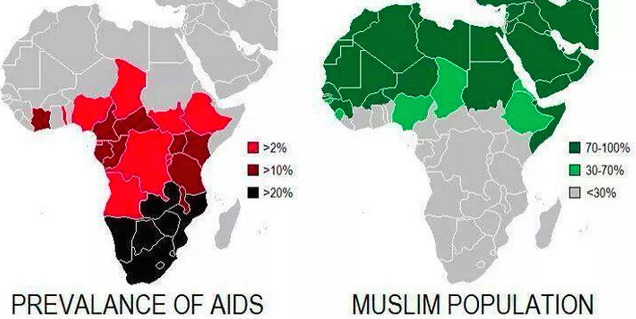
aids and muslim population.
trying and failing to find general rates of promiscuity and STDs in MENA regions.
trying and failing to find general rates of promiscuity and STDs in MENA regions.
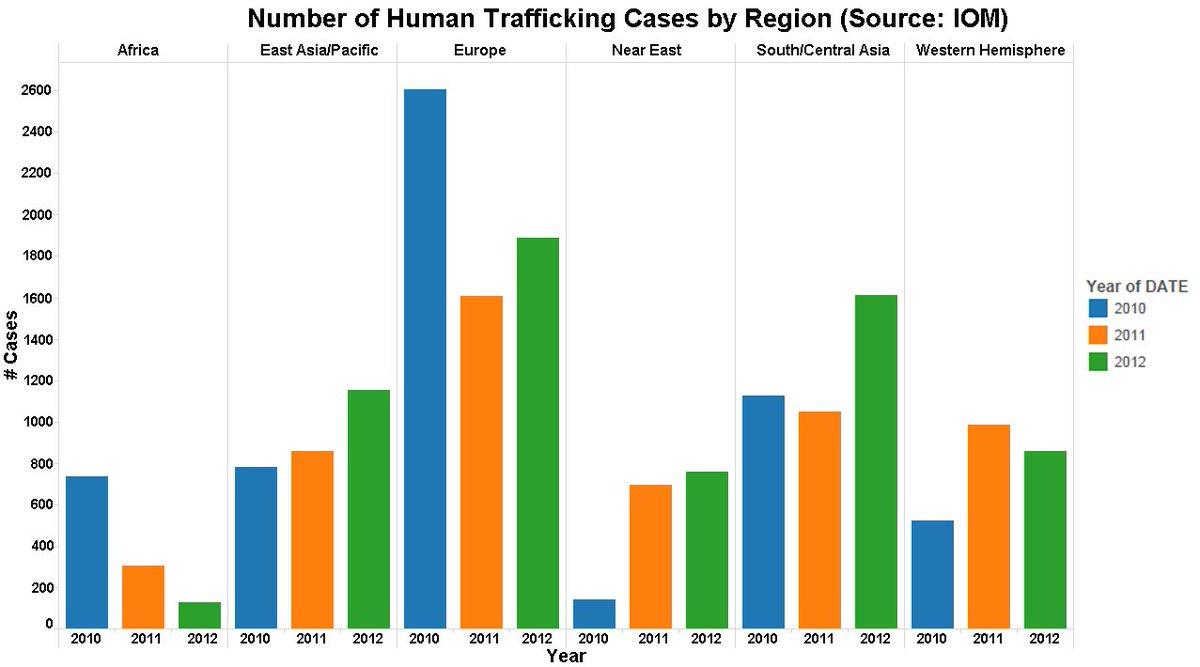
number of human trafficking *cases* is highest in europe.
this could also be due to low reported cases in other regions.
also data isnt great, only 3 years, which is nothgin in a time series.
this could also be due to low reported cases in other regions.
also data isnt great, only 3 years, which is nothgin in a time series.
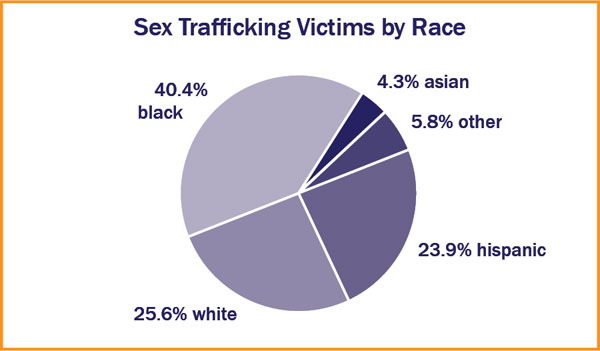
sex trafficking by race
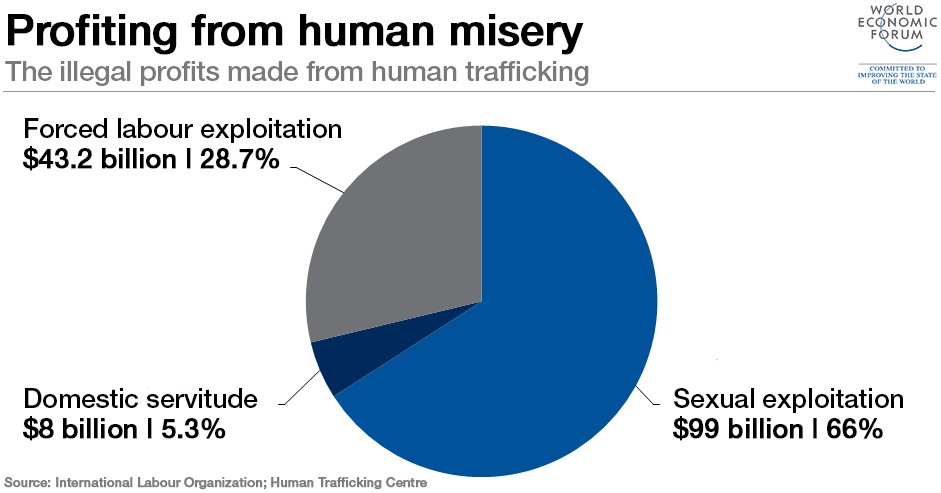
illegal sexual exploitation the largest market of 99 billion (mut be estimated)
women mostly trafficked for sex, men for labour
black female victims for sex trafficking
hispanic male victims for labour
illegal sexual exploitation the largest market of 99 billion (mut be estimated)
women mostly trafficked for sex, men for labour
black female victims for sex trafficking
hispanic male victims for labour
pre marital sex and religion.
"other" 1st. followed by buddhist and jewish
muslims least pre marital sex followed by hindus
"other" 1st. followed by buddhist and jewish
muslims least pre marital sex followed by hindus
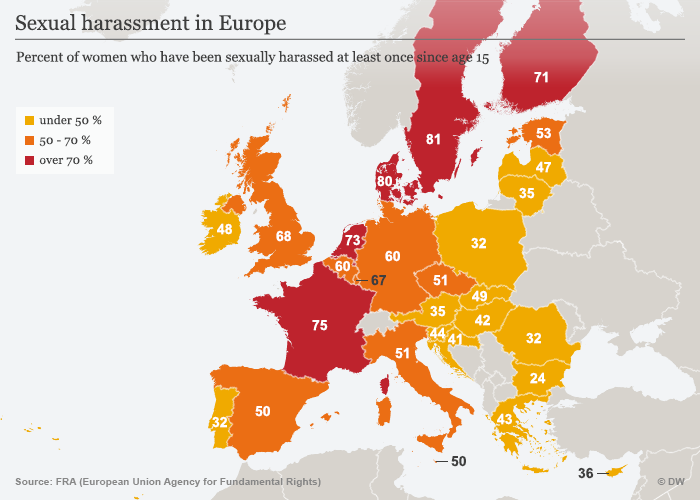
maybe, but germany bucks the trend in a very large way as do the other large refugee pop countries, turkey, hungary
for a more comparative analysis, id have to plug numbers in myself
ive visited sweden, the definition of "sexual assault" is broader
https://twitter.com/ShanequaBond/status/1329457324541554690?s=20">https://twitter.com/ShanequaB...
for a more comparative analysis, id have to plug numbers in myself
ive visited sweden, the definition of "sexual assault" is broader
https://twitter.com/ShanequaBond/status/1329457324541554690?s=20">https://twitter.com/ShanequaB...
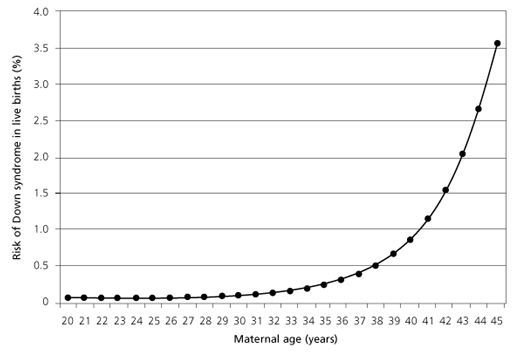
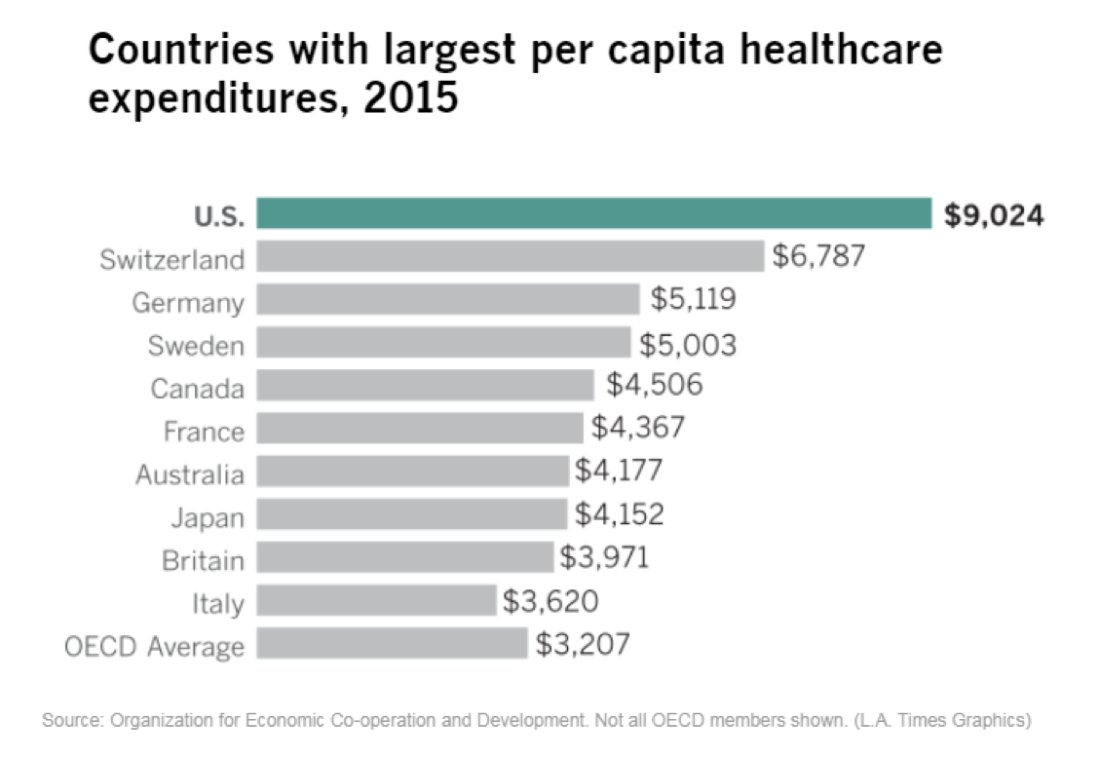
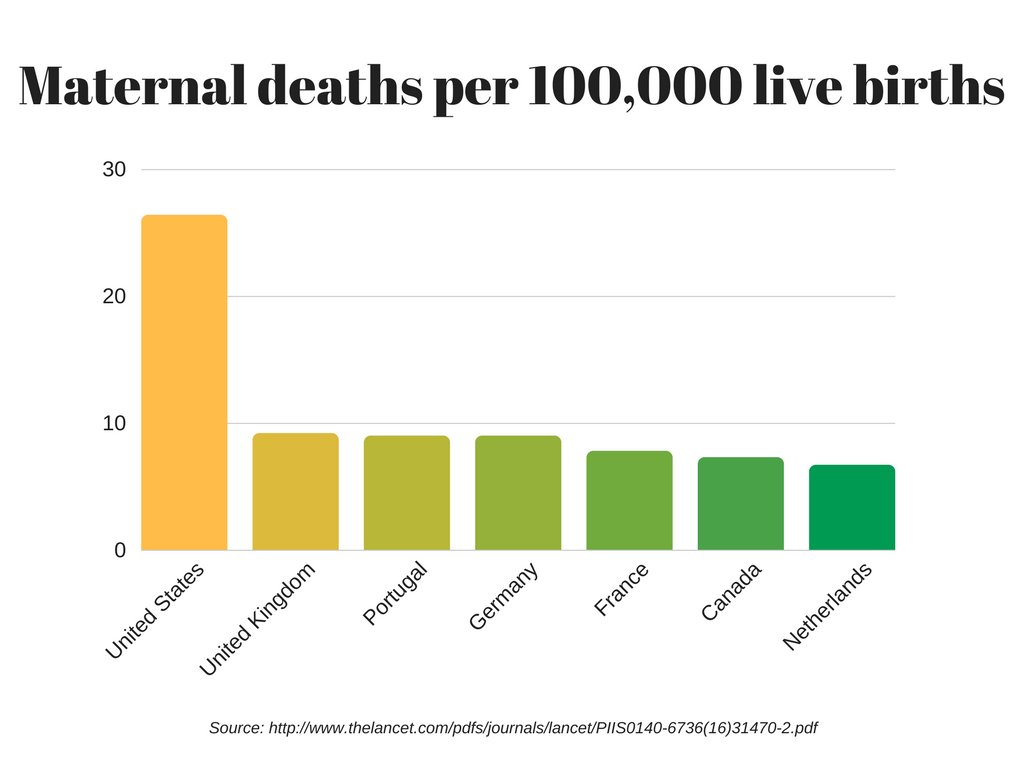
compared to other nations, america has a more expensive health care system and one that is less safe and effective, it has a higher maternal mortality rate.
why ?
why ?
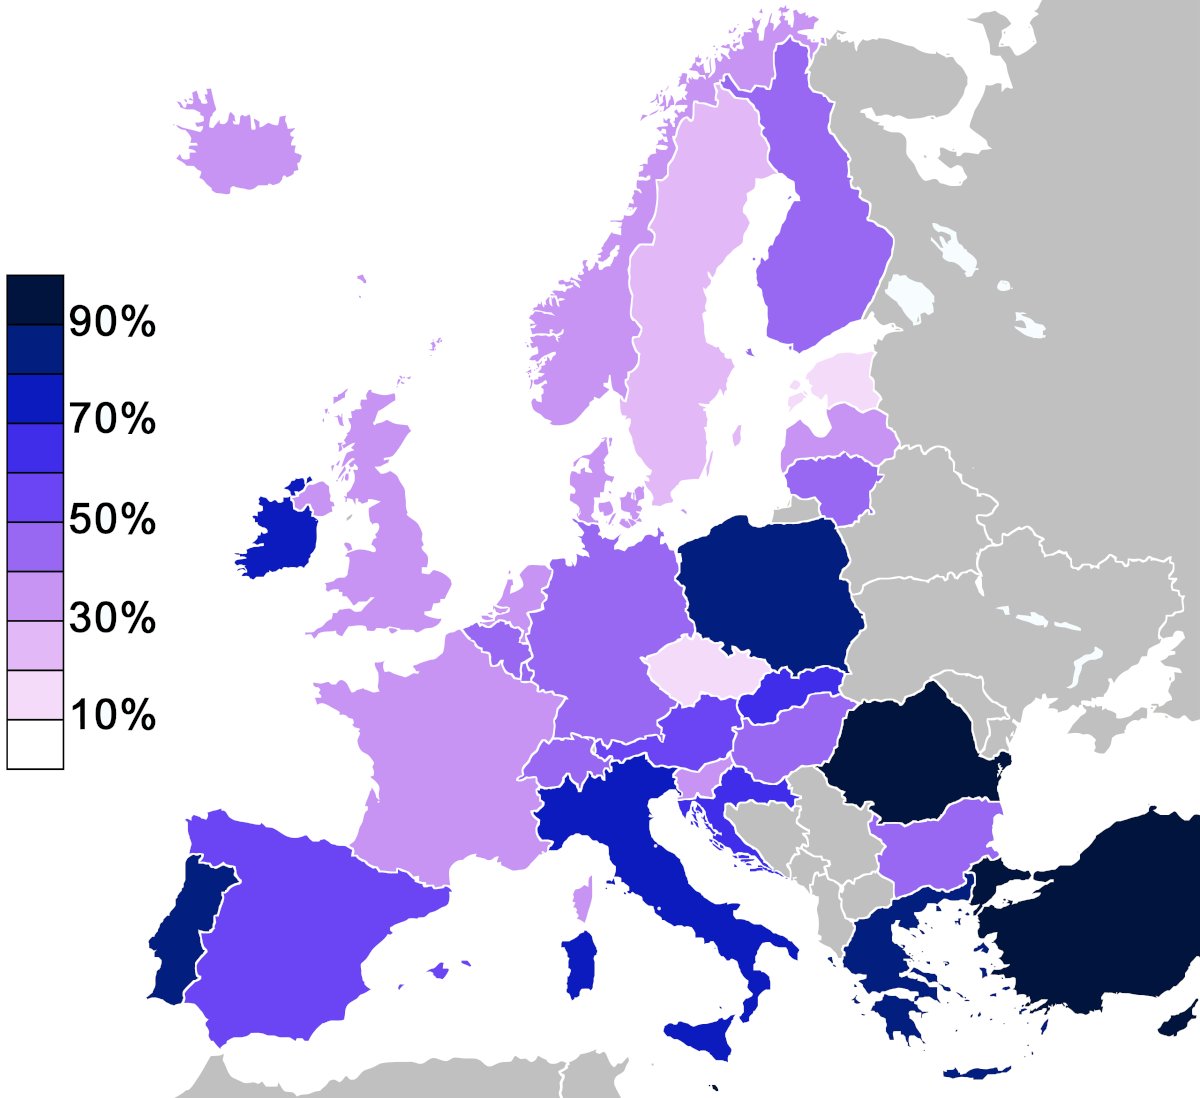
"Due to very low birth rates of the natives and the very high birth rates of Roma people, by 2050 Romania, Bulgaria, Hungary, Slovakia and Serbia could be Roma-majority nations."
http://asrie.org/2018/08/ethnic-revolution-in-the-balkans/
https://asrie.org/2018/08/e... href="https://twtext.com//hashtag/graphthread"> #graphthread
http://asrie.org/2018/08/ethnic-revolution-in-the-balkans/
https://twitter.com/GRITCULT/status/1375029420013010947?s=20
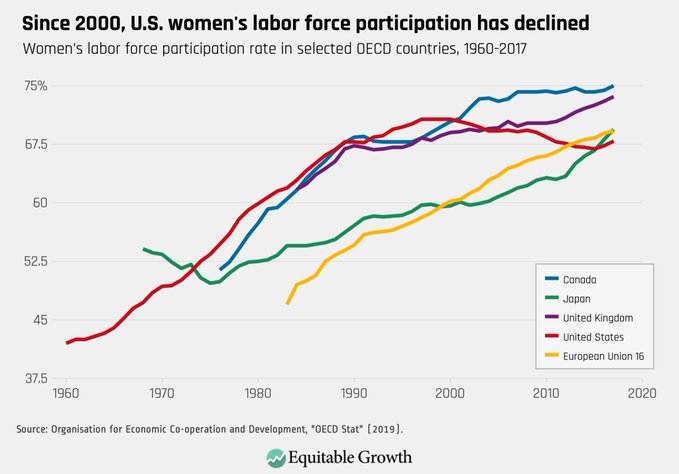
women">https://twitter.com/GRITCULT/... and immigration kicking in.
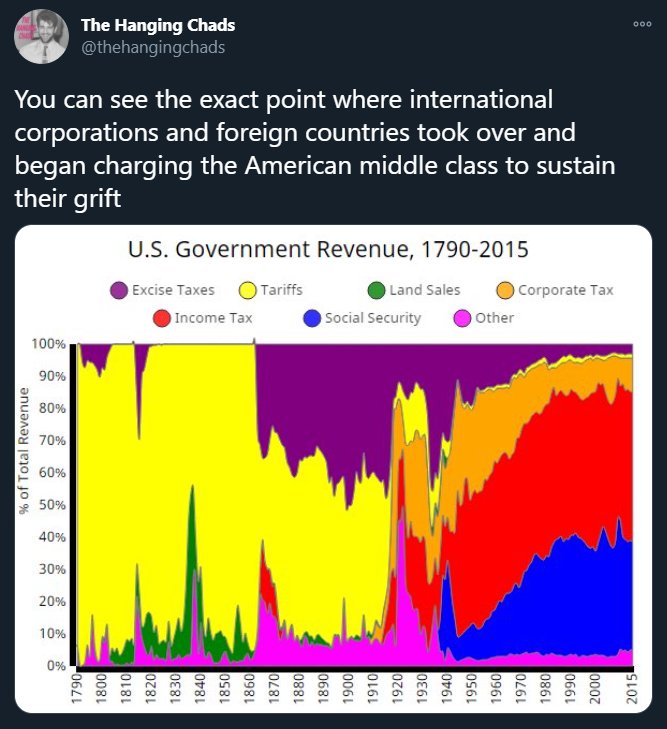
probably also explains why productivity gains arent reflected in real income.
h/t @LaocoonofTroy
women">https://twitter.com/GRITCULT/... and immigration kicking in.
probably also explains why productivity gains arent reflected in real income.
h/t @LaocoonofTroy
#graphthread
Younger generations tend to be more sexually liberal and open and more LGBTQ
Gen z are technically the gayest generation
H/t @DeeperThrill
Younger generations tend to be more sexually liberal and open and more LGBTQ
Gen z are technically the gayest generation
H/t @DeeperThrill
not a graph but a map showing ancient trade routes of ancient rome trading with africa, south asia and east asia
#graphthread
#graphthread

 Read on Twitter












































 #graphthread" title=""Due to very low birth rates of the natives and the very high birth rates of Roma people, by 2050 Romania, Bulgaria, Hungary, Slovakia and Serbia could be Roma-majority nations." https://asrie.org/2018/08/e... href="https://twtext.com//hashtag/graphthread"> #graphthread" class="img-responsive" style="max-width:100%;"/>

