Wanted to follow up @CharlesWeill tweet to explain a bit more about AVD (Average View Duration) multiplied by CTR (Impressions Click-Through Rate) (CTR*AVD), what it means and why it& #39;s one the most important metrics to Youtube& #39;s algorithm.
Thread https://abs.twimg.com/emoji/v2/... draggable="false" alt="👇" title="Rug van hand met omlaag wijzende wijsvinger" aria-label="Emoji: Rug van hand met omlaag wijzende wijsvinger">
Thread
2/13 To start, CTR*AVD is essentially Expected Watch Time Per Impression. Google outlines this in a 2016 paper linked at the end stating:
"Our final ranking objective...is generally a simple function of expected watch time per impression."
Ty to @dabidoYT for showing me this!
"Our final ranking objective...is generally a simple function of expected watch time per impression."
Ty to @dabidoYT for showing me this!
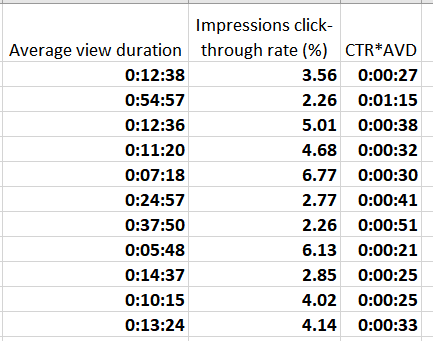
3/13 The result of AVD*CTR is usually btwn 0 and 60 second at the end of a videos life. (some variability) It& #39;ll look a bit like this
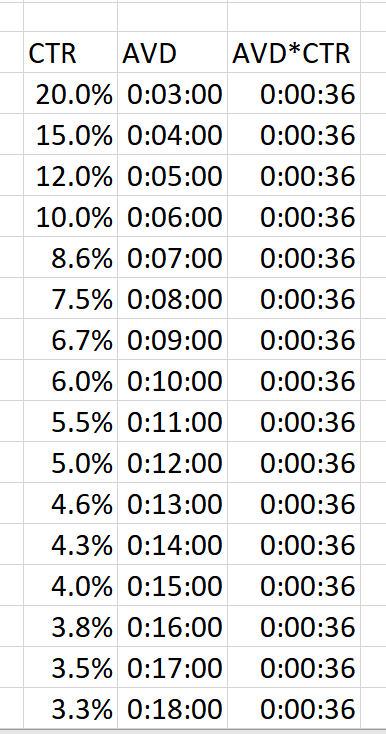
An important point is CTR and AVD tend to be inversely related. Table illustrates CTR changes as AVD increases by 1 minute, balancing AVD*CTR.
An important point is CTR and AVD tend to be inversely related. Table illustrates CTR changes as AVD increases by 1 minute, balancing AVD*CTR.
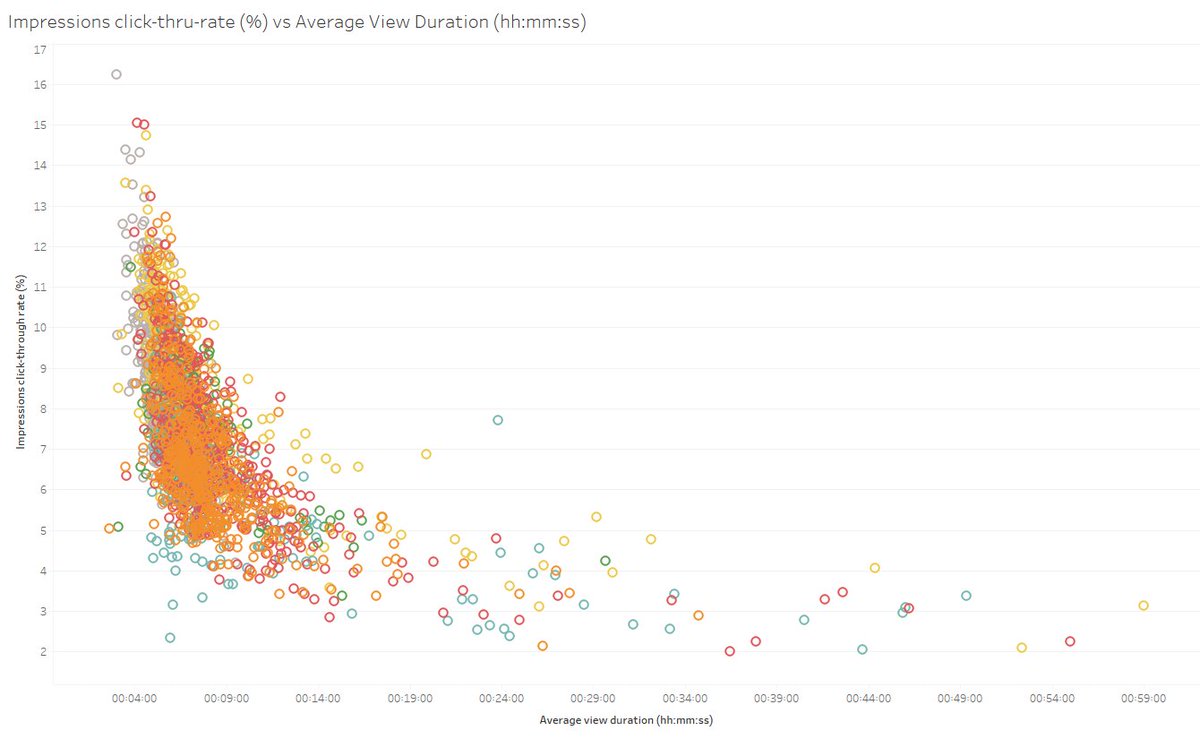
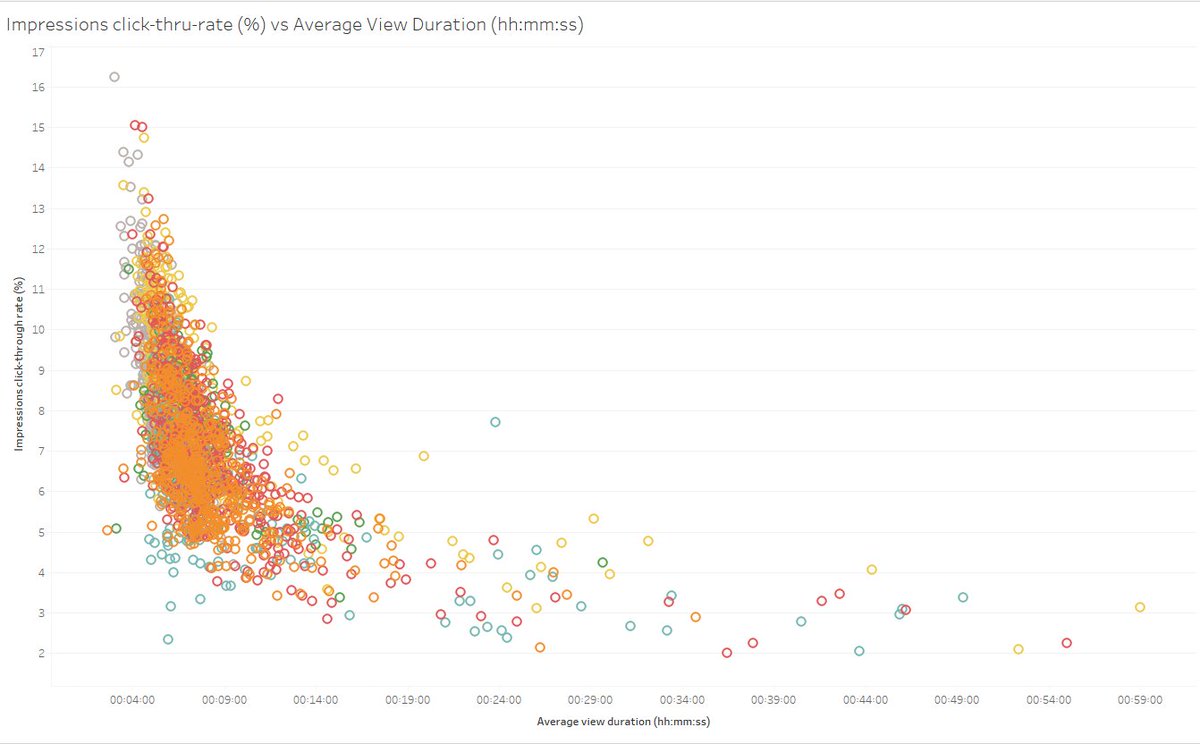
4/13 Further illustrating the above point, this is a graph of 2400 videos (gaming niche) for CTR and AVD. You can see as AVD gets longer CTR drops.
This is because Expected Watch Time balances out, allowing for a lower CTR because 1 view is more valuable (more watch time).
This is because Expected Watch Time balances out, allowing for a lower CTR because 1 view is more valuable (more watch time).
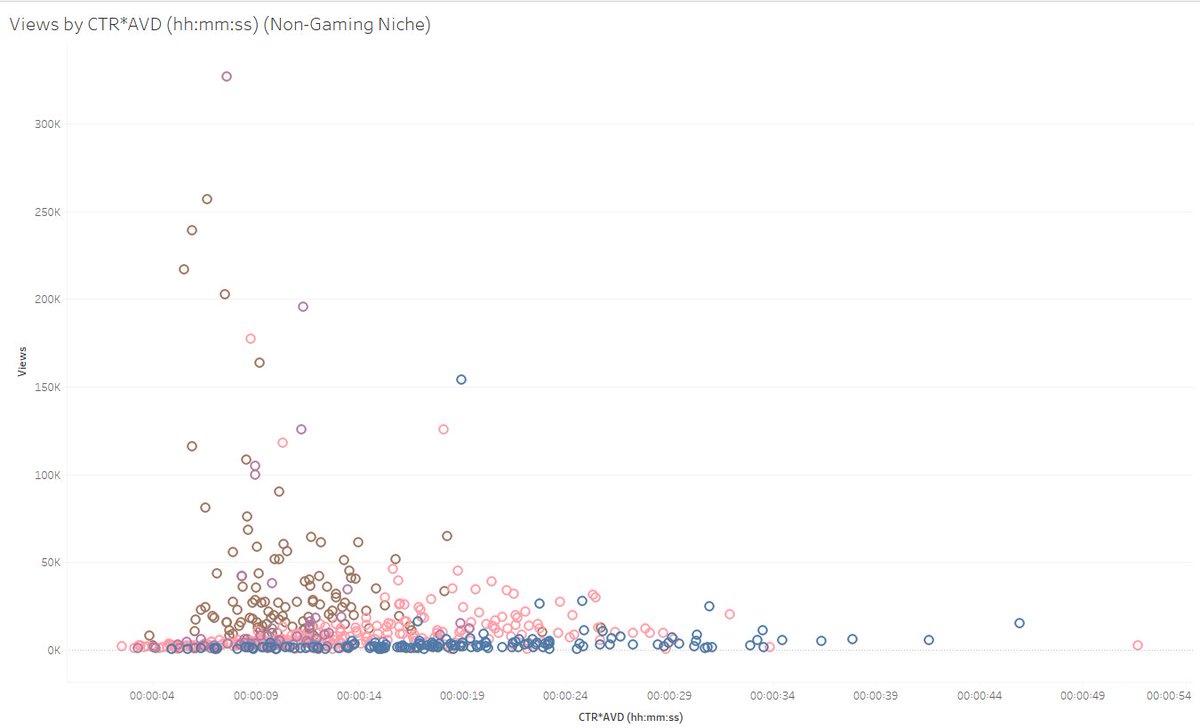
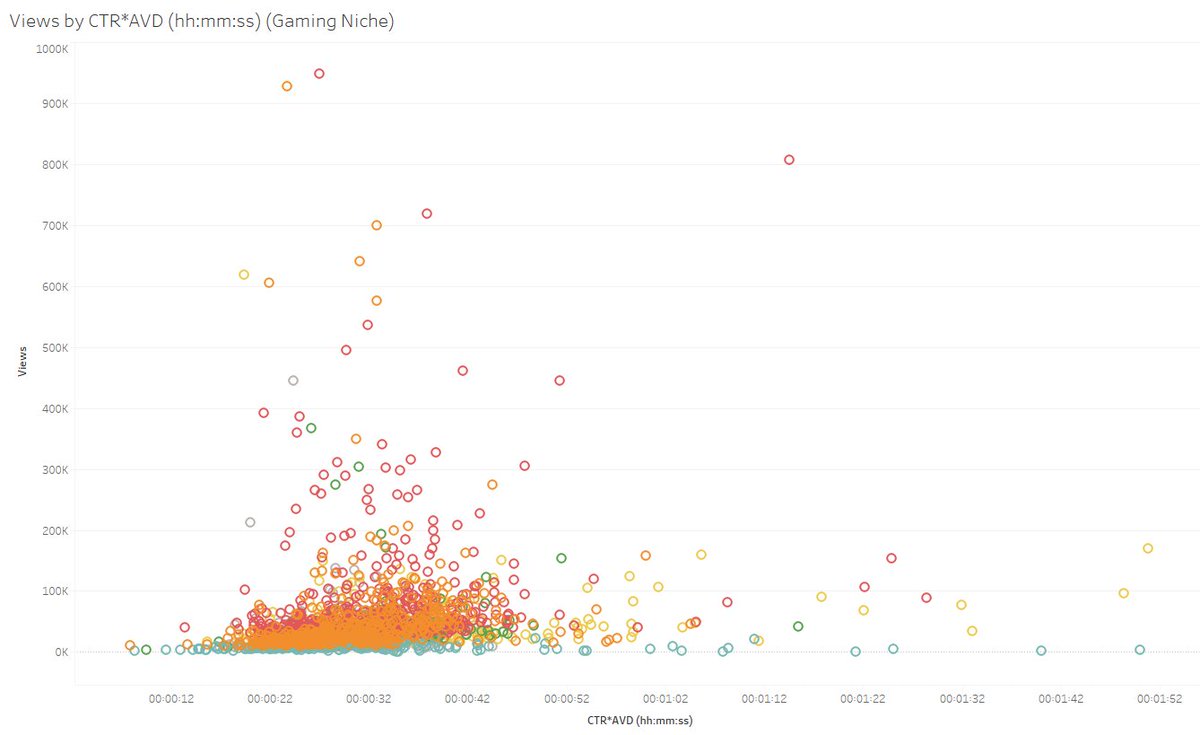
5/13 Now for the good part! Taking those 2400 videos, here& #39;s a graph of their views by CTR*AVD.
You can see clustering starting around 20 seconds to ~45 seconds. For the gaming videos I have, this tends to be the sweet spot for this niche.
For other niches it differs.
You can see clustering starting around 20 seconds to ~45 seconds. For the gaming videos I have, this tends to be the sweet spot for this niche.
For other niches it differs.
6/13 So what does this all mean?
1) CTR can and will usually be lower for videos with higher AVD, because you& #39;ll be getting more impressions and a view means more
2) YT seems to have a sweet spot below 60 seconds Expected Watch Time, meaning if you& #39;re above you& #39;re doing great!
1) CTR can and will usually be lower for videos with higher AVD, because you& #39;ll be getting more impressions and a view means more
2) YT seems to have a sweet spot below 60 seconds Expected Watch Time, meaning if you& #39;re above you& #39;re doing great!
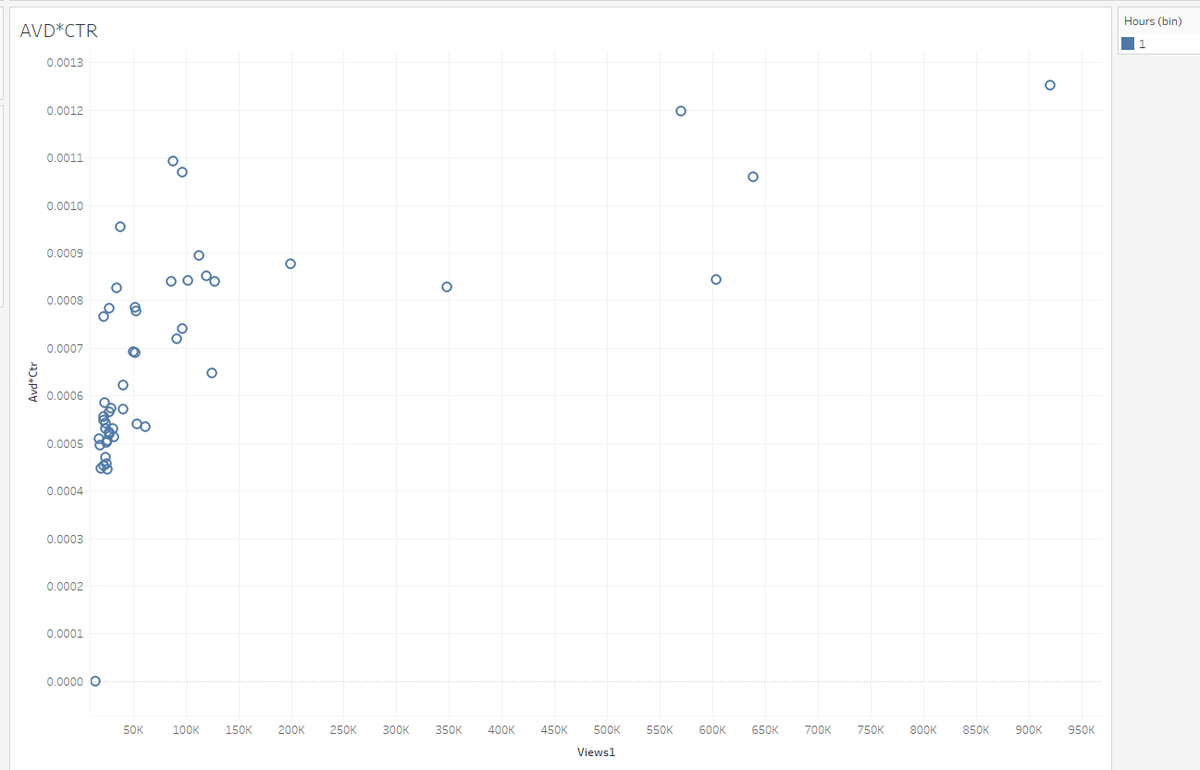
7/13 3) CTR*AVD can be a very strong indicator of a videos success. A small teaser of an analysis to come. This is a graph of 50 videos& #39; with First Hour CTR*AVD and their current views (end of life). You see a breaking point where if you pass it views seem to take off.
8/13 4) As everyone says, context and niches are important.
The purpose of this thread is to show people the relationship between CTR*AVD, help explain why sometimes CTR might be low but is actually a good thing, and hopefully offer additional context to a video& #39;s performance
The purpose of this thread is to show people the relationship between CTR*AVD, help explain why sometimes CTR might be low but is actually a good thing, and hopefully offer additional context to a video& #39;s performance
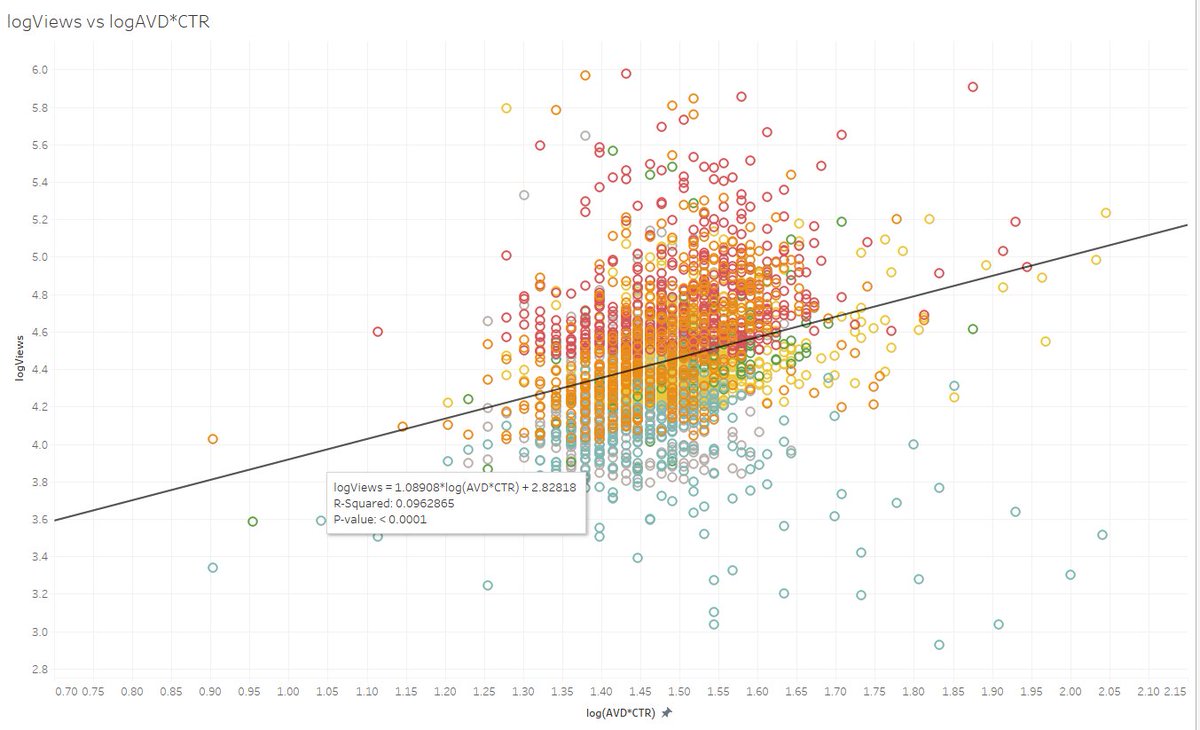
9/13 Lastly the paper and some log transformations of the data illustrating the relationship better. Thanks to @CharlesWeill for the shoutout and help on this analysis!
The 2016 paper is & #39;Deep Neural Networks for YouTube Recommendations& #39;, can& #39;t seem to link it.
The 2016 paper is & #39;Deep Neural Networks for YouTube Recommendations& #39;, can& #39;t seem to link it.
10/13 Per Charles rec, logging the views and Expected Watch Time we get something much more normal and linear.
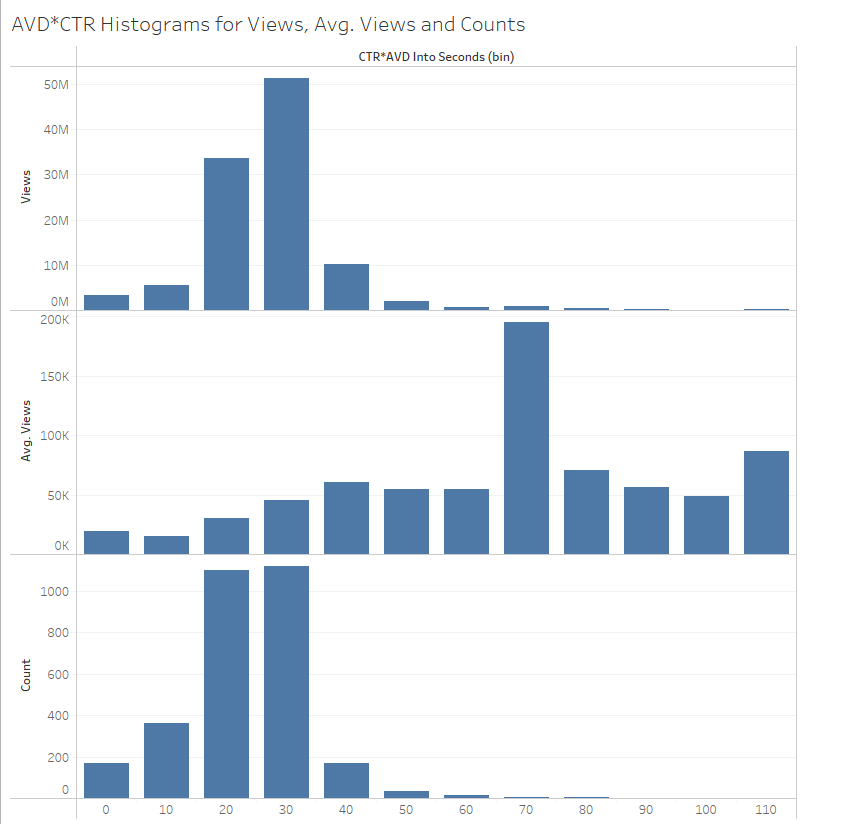
11/13 Some descriptive stats about the data bucketing the Expected Watch Time into 10 second buckets to see frequency of where videos show up.
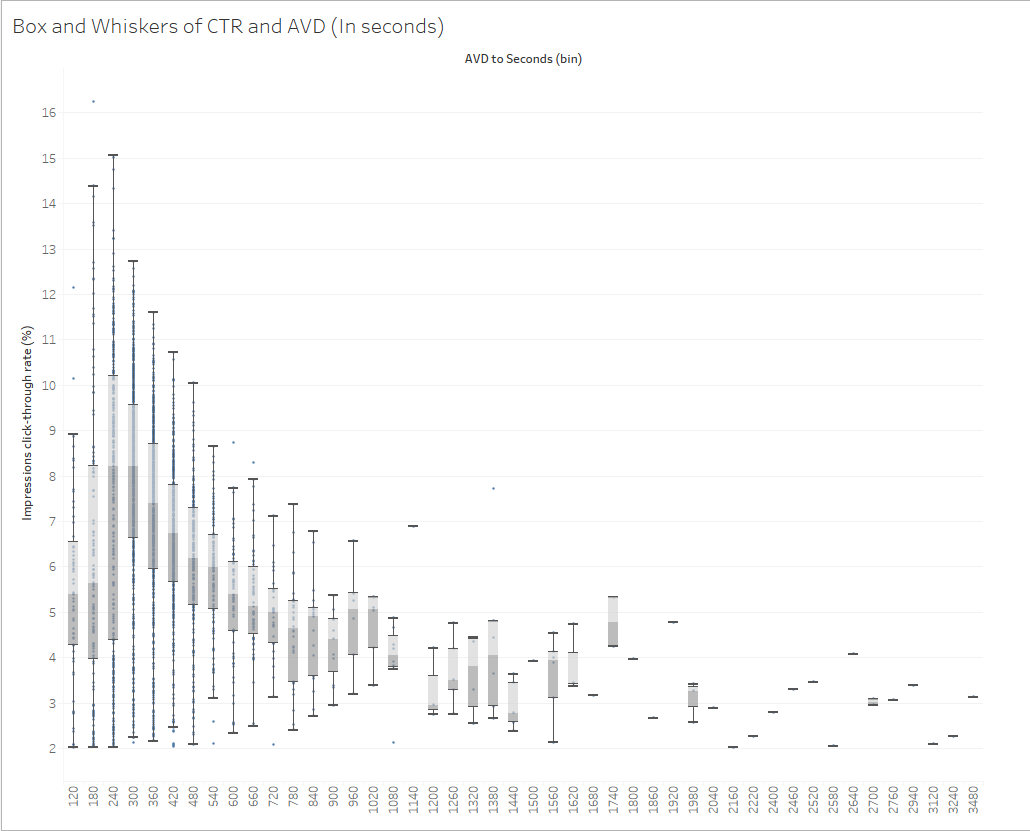
12/13 Lastly, everyone loves a good box and whiskers plot. Helps to see variability in CTR based on AVD a bit more - ideal would be seeing videos stat at some point in time (X days after publish).
13/13 I hope this was helpful to some in gaining additional insight into the YT algorithm and why some of the metrics behave certain ways!
There& #39;s hundreds of other variables, so this is just a small but important piece of the puzzle.
Follow for more analyses like this one!
There& #39;s hundreds of other variables, so this is just a small but important piece of the puzzle.
Follow for more analyses like this one!
Oh now I can link the paper!  https://abs.twimg.com/emoji/v2/... draggable="false" alt="😡" title="Pruilend gezicht" aria-label="Emoji: Pruilend gezicht">
Well anyhues - here& #39;s the 2016 paper about Expected Watch Time. Section 4 goes into it more. https://research.google/pubs/pub45530/ ">https://research.google/pubs/pub4...
Well anyhues - here& #39;s the 2016 paper about Expected Watch Time. Section 4 goes into it more. https://research.google/pubs/pub45530/ ">https://research.google/pubs/pub4...

 Read on Twitter
 " title="Wanted to follow up @CharlesWeill tweet to explain a bit more about AVD (Average View Duration) multiplied by CTR (Impressions Click-Through Rate) (CTR*AVD), what it means and why it& #39;s one the most important metrics to Youtube& #39;s algorithm.Thread https://abs.twimg.com/emoji/v2/... draggable="false" alt="👇" title="Rug van hand met omlaag wijzende wijsvinger" aria-label="Emoji: Rug van hand met omlaag wijzende wijsvinger">" class="img-responsive" style="max-width:100%;"/>
