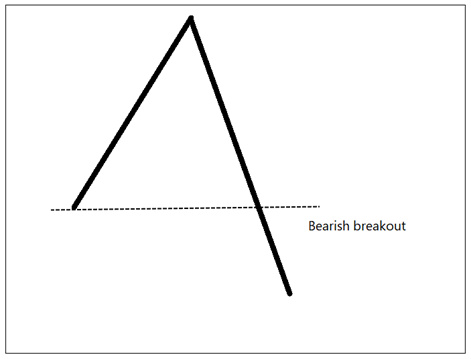
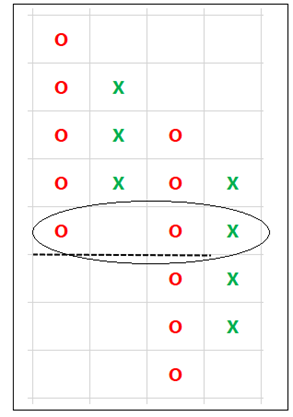
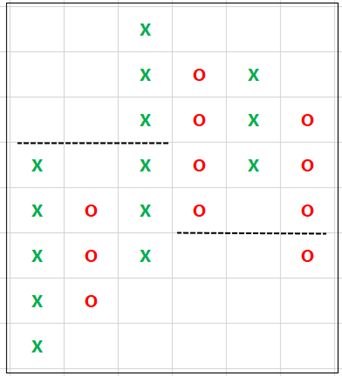
Pattern is bearish. People who were looking at previous low as support are in trouble. Bears are dominating.
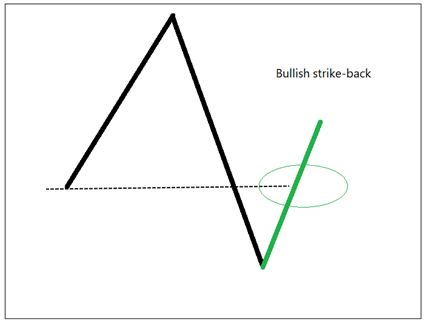
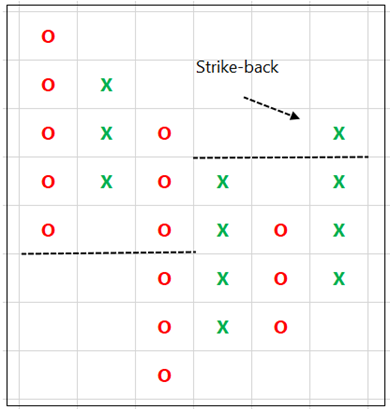
Imagine, bulls strike back and take price above previous low. See the image.
Imagine, bulls strike back and take price above previous low. See the image.
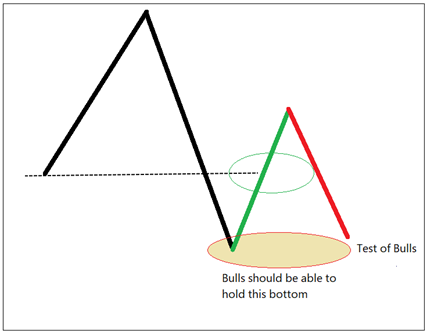
Price above bearish breakout level. Bears are in a difficult situation now, they seem trapped. The breakout was temporary, if that demand level at the swing low is strong, there is a possibility of strong bullish move from here.
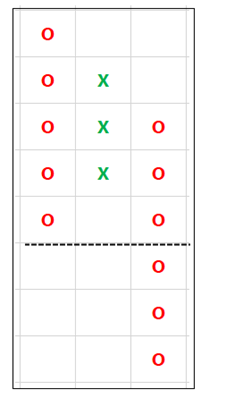
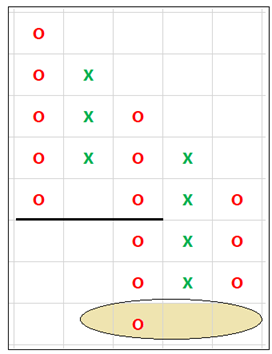
In P&F, ‘X’ is back!
In P&F, ‘X’ is back!
This is bullish, but we need more confirmation. There is a tussle between bulls and bears at this point. If demand is not strong around current levels, price will fall and break previous low.
Previous low is a test of bulls.
Previous low is a test of bulls.
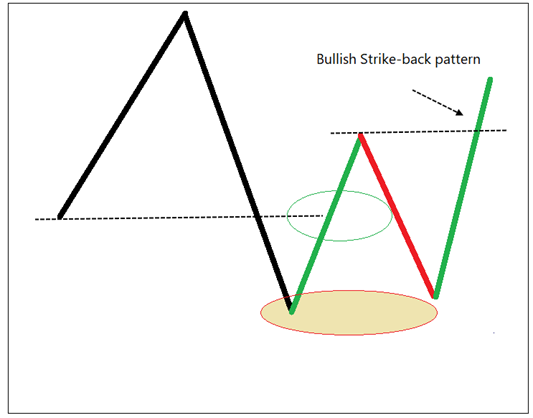
If price maintains the bottom and goes above the previous high, it is a bullish strike-back pattern.
See below image.
See below image.
Using P&F, pattern became objective. We can scan for it, back-test and create systems for it by using it along with other patterns and indicators.
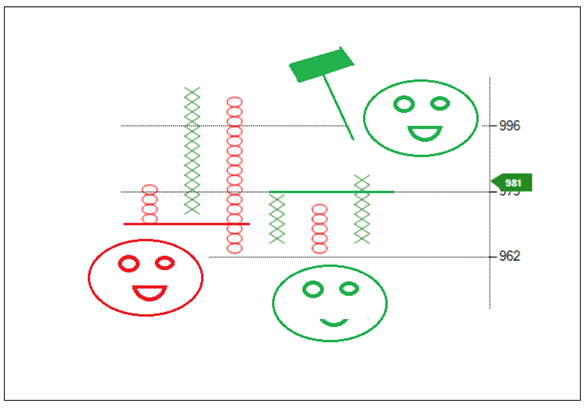
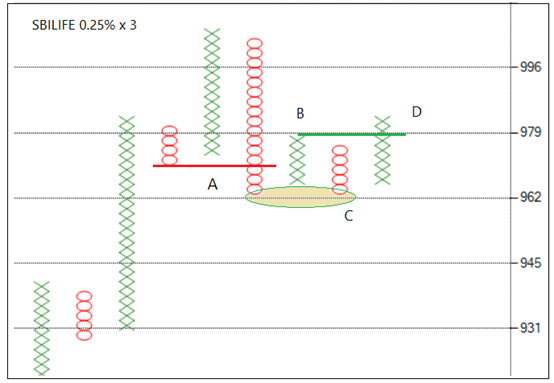
If I run a scanner in EOD segment today on 0.25% box-value, SBILIFE is one of the candidates.
If I run a scanner in EOD segment today on 0.25% box-value, SBILIFE is one of the candidates.
A = bearish breakout. B = bulls managed to bounce. C = bottom of A was protected. D = bullish strike-back.
Pattern fails if price falls below bottom of C.
Pattern fails if price falls below bottom of C.
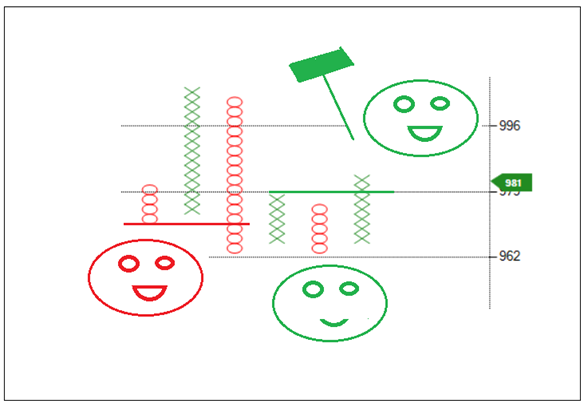
Sorry for the bad drawing  https://abs.twimg.com/emoji/v2/... draggable="false" alt="😊" title="Lächelndes Gesicht mit lächelnden Augen" aria-label="Emoji: Lächelndes Gesicht mit lächelnden Augen">. It is like bears laughed, bulls smiled and attacked. They can prove dangerous!
Story was to explain the concept.
Story was to explain the concept.
Attempt is to explain the concept and how it was designed on P&F. Idea is to take advantage of important properties of different methods. I seek objectivity so that focus can be shifted to execution while trading. <End>

 Read on Twitter
 . It is like bears laughed, bulls smiled and attacked. They can prove dangerous!Story was to explain the concept." title="Sorry for the bad drawing https://abs.twimg.com/emoji/v2/... draggable="false" alt="😊" title="Lächelndes Gesicht mit lächelnden Augen" aria-label="Emoji: Lächelndes Gesicht mit lächelnden Augen">. It is like bears laughed, bulls smiled and attacked. They can prove dangerous!Story was to explain the concept." class="img-responsive" style="max-width:100%;"/>


