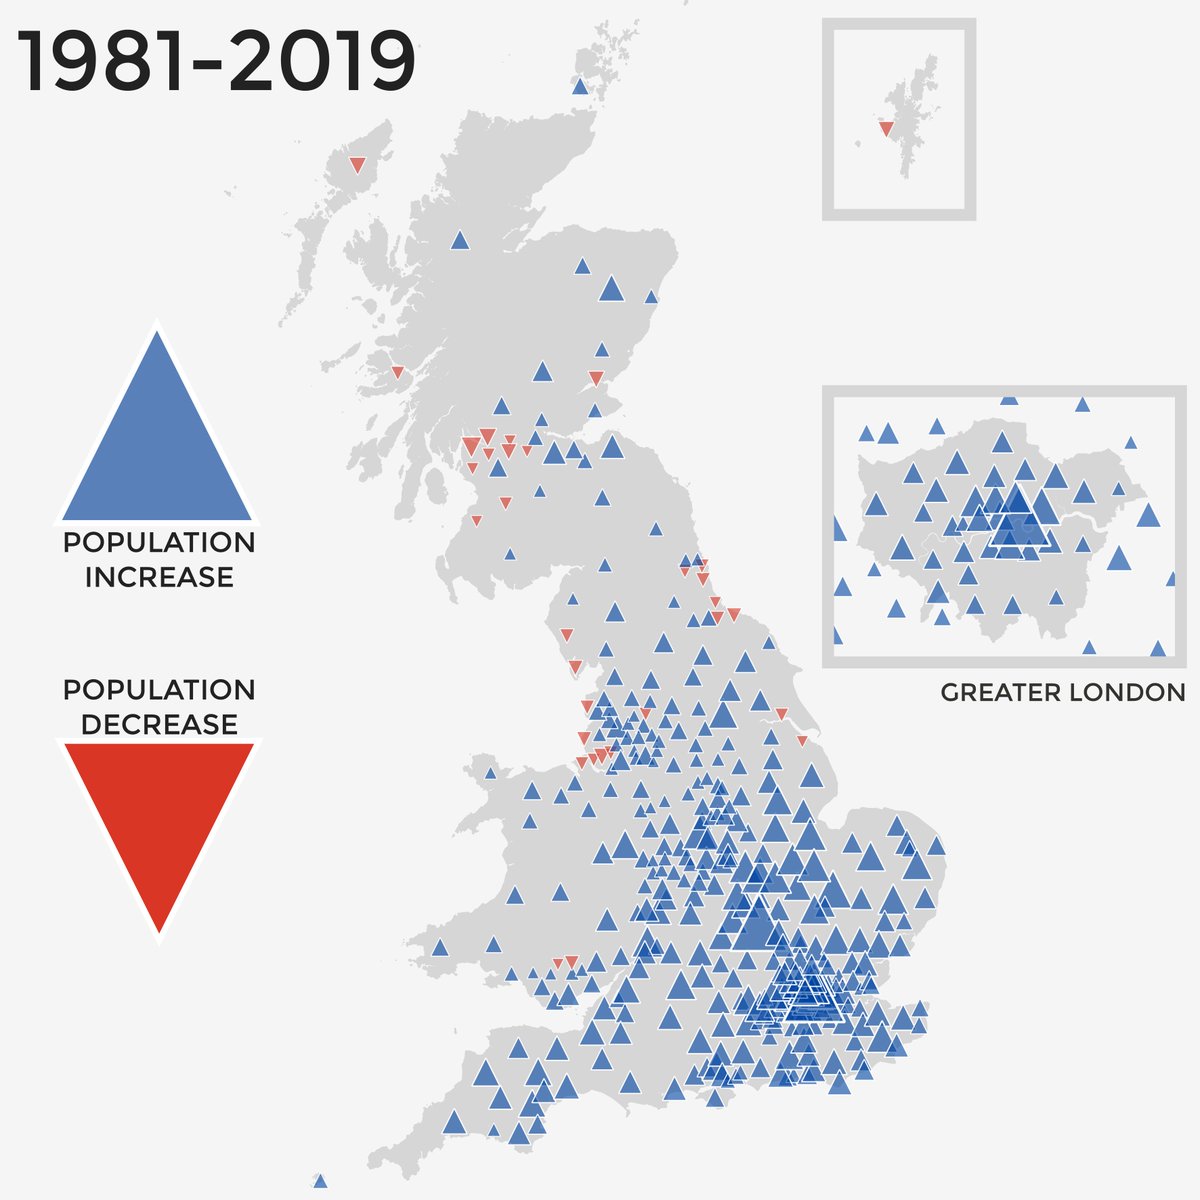
A few & #39;levelling-up& #39; related maps today, after looking at recent ONS data release on local authority populations for each year 1981 to 2019 (based on 2020 boundaries)
- simple overall population change map showing increases (336 out of 368 areas) and decreases (32 areas)
- simple overall population change map showing increases (336 out of 368 areas) and decreases (32 areas)
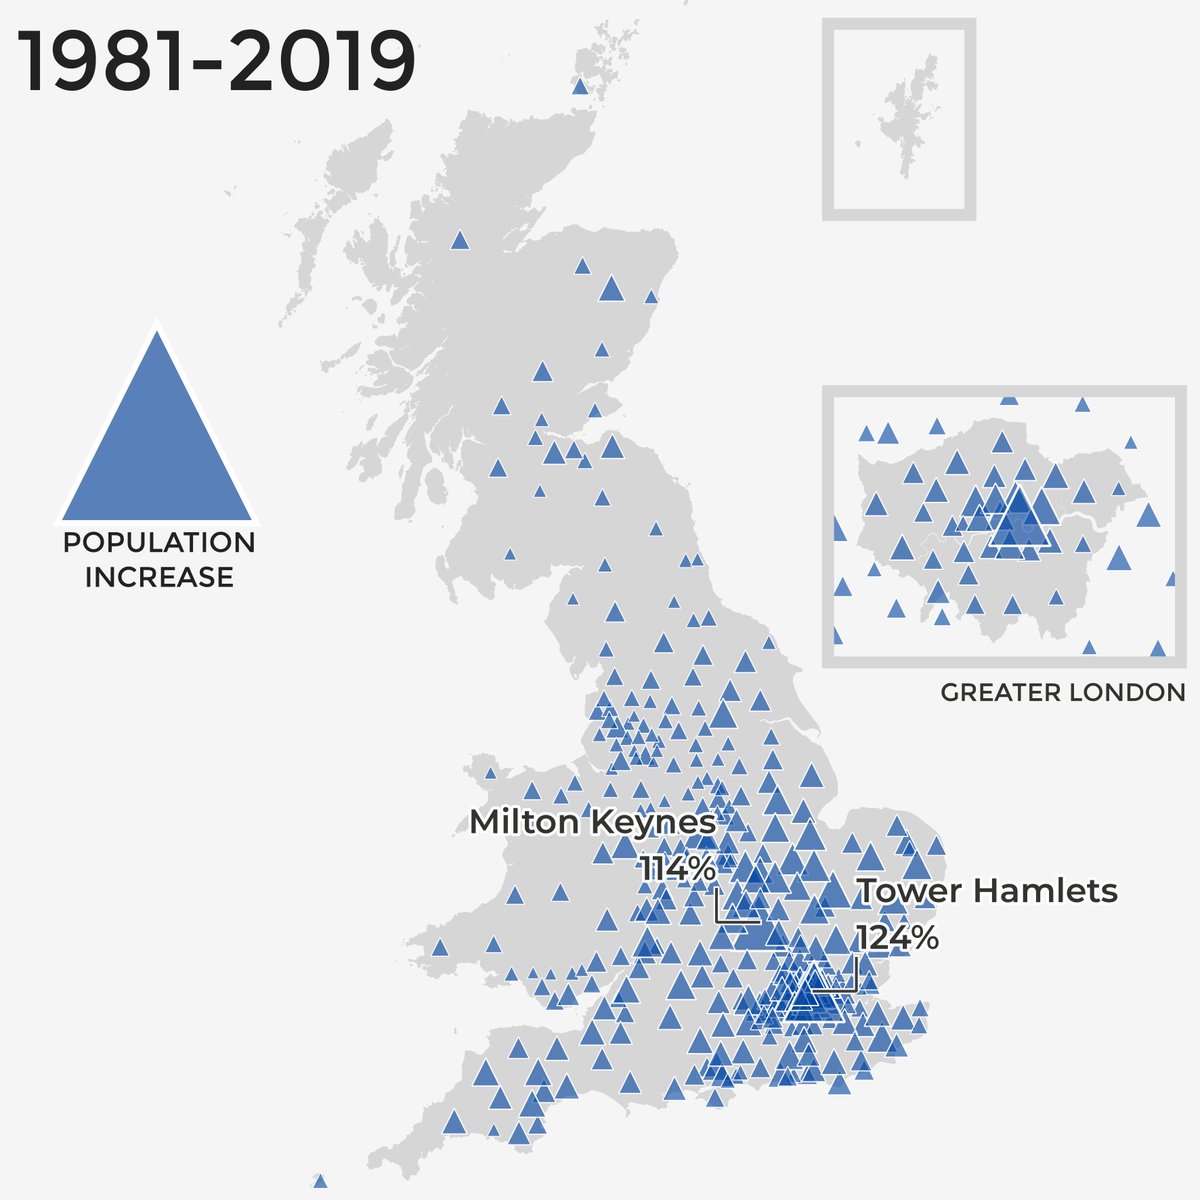
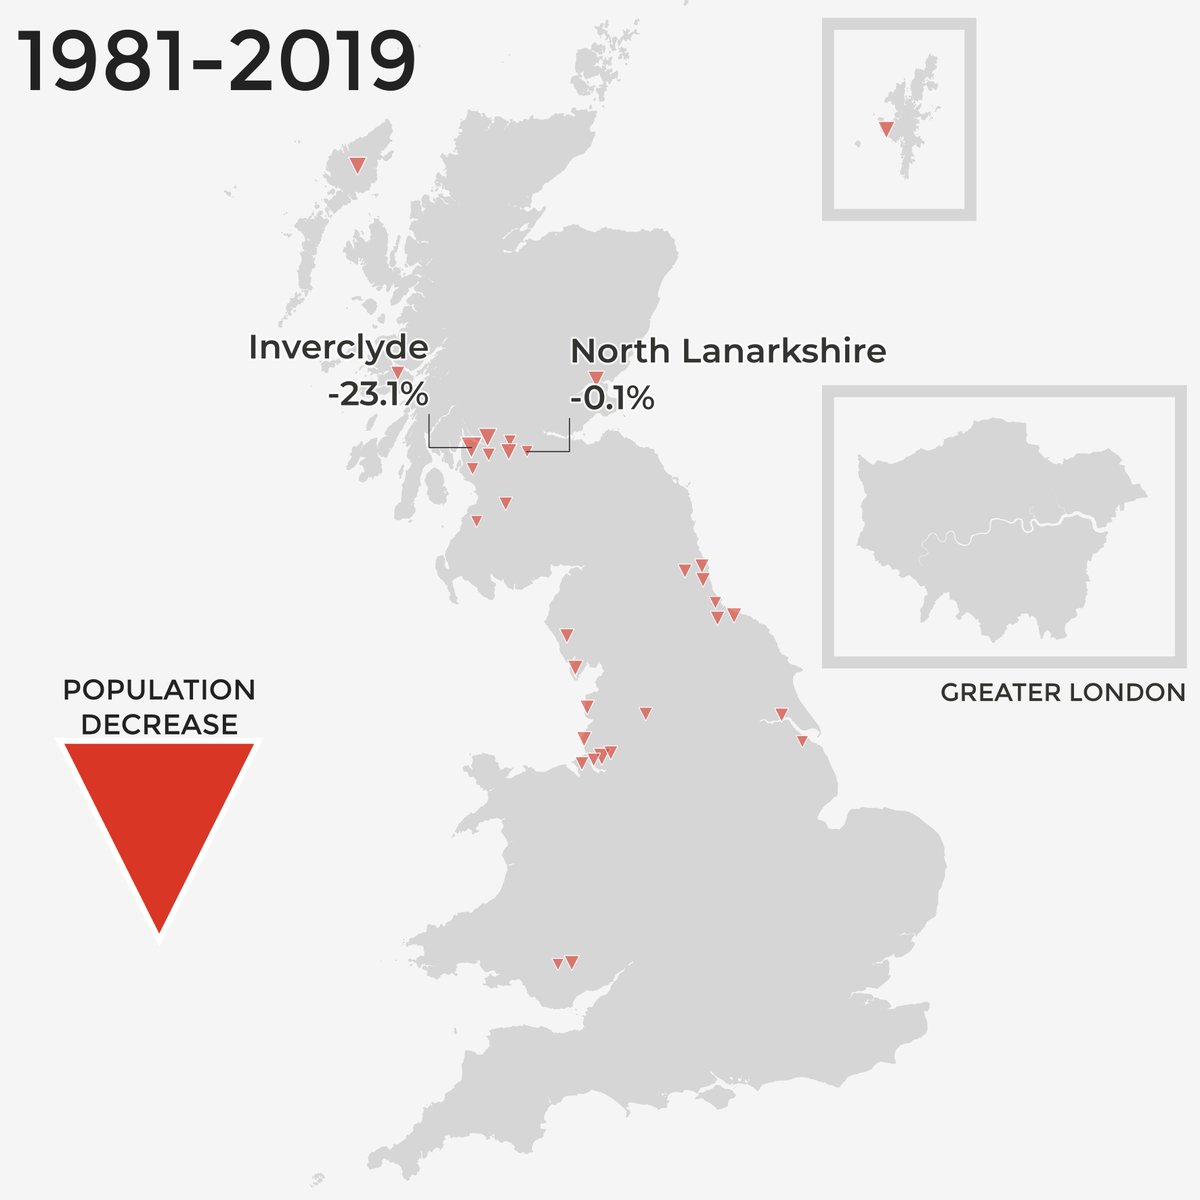
here are the top and bottom two in terms of % change from 1981 to 2019 - Milton Keynes and Tower Hamlets are the only two with 100% growth over this time
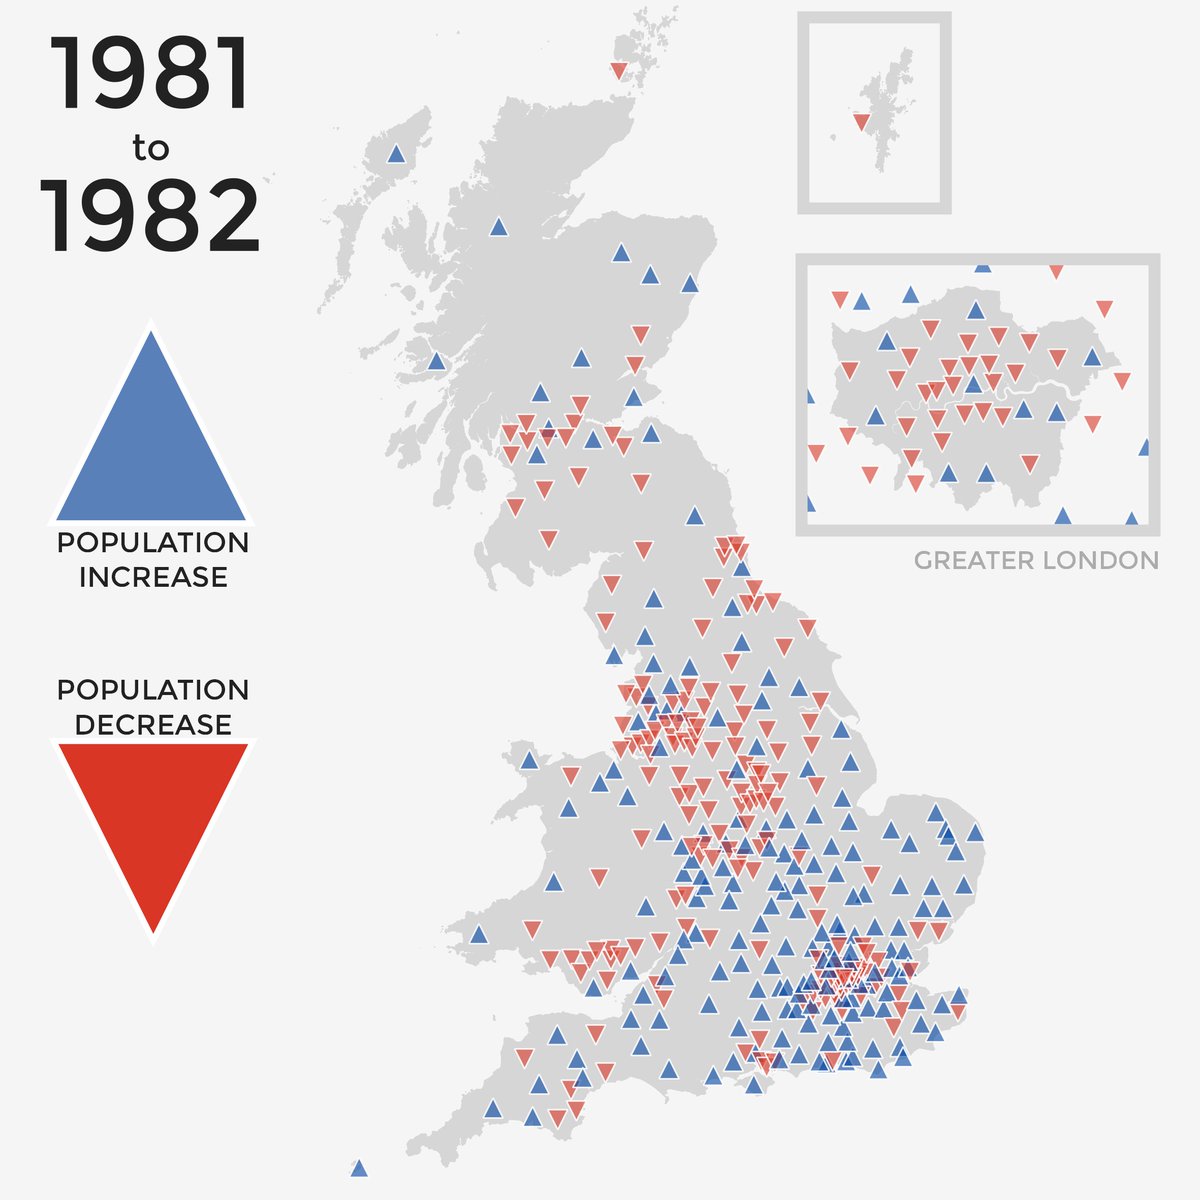
the single year change from 1981 to 1982 map has lots of upside down red triangles, as you may expect - and lots in London too
by 2013 to 2014 the map has a lot more blue triangles, and look closely at London and surrounds here
a bit of change by the 2018 to 2019 map (that& #39;s the latest data, who knows what comes next)
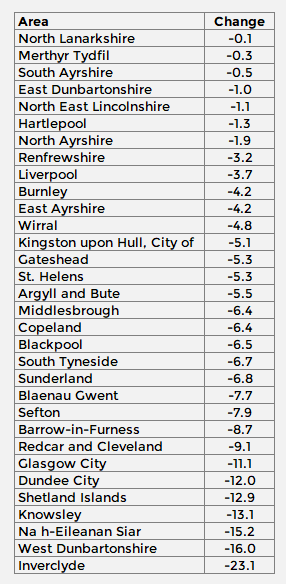
of the 32 local authorities (2020 boundaries) that saw any population loss, I get the following totals for each country (NI data sadly not available)
England - 17 areas (out of 314)
Scotland - 13 areas (out of 32)
Wales - 2 areas (out of 22)
England - 17 areas (out of 314)
Scotland - 13 areas (out of 32)
Wales - 2 areas (out of 22)
the 32 areas, listed below - you can see the data yourself here:
https://www.ons.gov.uk/peoplepopulationandcommunity/populationandmigration/populationestimates/adhocs/13221populationestimatesbylocalauthoritiesofgreatbritainmid1981tomid2019
(I">https://www.ons.gov.uk/peoplepop... spotted this dataset thanks to @owenboswarva - once again)
https://www.ons.gov.uk/peoplepopulationandcommunity/populationandmigration/populationestimates/adhocs/13221populationestimatesbylocalauthoritiesofgreatbritainmid1981tomid2019
(I">https://www.ons.gov.uk/peoplepop... spotted this dataset thanks to @owenboswarva - once again)
if you look at the areas with (e.g.) 33% population growth or higher, you can begin to see some geographical patterns - though this was very much an initial explore with the data using simple coloured triangles this morning
(the Aberdeenshire figure is 38% population growth)
(the Aberdeenshire figure is 38% population growth)
small multiples seem to have gone a bit out of fashion and they tend to get fuzzified on twitter but I ran off a batch of annual maps and patched them together, so I will post it here too
nerd note: I often use ImageMagick for small multiples, for this one I used the following:
montage *.png -tile 4x10 -geometry +5+5 result.png
(this grabs png files, makes them 4 wide, 10 high, adds 5 pixels of white space between frames and spits out a file called result.png)
montage *.png -tile 4x10 -geometry +5+5 result.png
(this grabs png files, makes them 4 wide, 10 high, adds 5 pixels of white space between frames and spits out a file called result.png)
the top 10 local authorities by population in 1981, then 2019 (based on 2020 boundaries)
Birmingham 1,029,200
Leeds 717,700
Glasgow 712,400
Sheffield 547,500
Liverpool 517,000
County Durham 511,900
Bradford 464,300
Manchester 459,200
Edinburgh 446,000
Buckinghamshire442,900
Birmingham 1,029,200
Leeds 717,700
Glasgow 712,400
Sheffield 547,500
Liverpool 517,000
County Durham 511,900
Bradford 464,300
Manchester 459,200
Edinburgh 446,000
Buckinghamshire442,900
2019 populations below, to end this thread
Birmingham 1,141,800
Leeds 793,100
Glasgow 633,100
Sheffield 584,900
Cornwall 569,600
Manchester 552,900
Buckinghamshire 544,000
Bradford 539,800
County Durham 530,100
Edinburgh 524,900
Birmingham 1,141,800
Leeds 793,100
Glasgow 633,100
Sheffield 584,900
Cornwall 569,600
Manchester 552,900
Buckinghamshire 544,000
Bradford 539,800
County Durham 530,100
Edinburgh 524,900

 Read on Twitter