Inspired by @_Dave__White_& #39;s post (with @MartinTassy, @_charlienoyes, and @danrobinson) on Uniswap& #39;s Financial Alchemy ( https://research.paradigm.xyz/uniswaps-alchemy),">https://research.paradigm.xyz/uniswaps-... I ran a simple simulation to get an intuition for volatility drag.
Here are the parameters:
(i) Take 50,000 independent portfolios, each with $1000 of starting capital.
(ii) Each year, assume a 1/2 probability that a portfolio& #39;s value goes up by 75%, and a 1/2 probability that its value goes down by 50%.
(iii) Run this simulation over 25 years.
(i) Take 50,000 independent portfolios, each with $1000 of starting capital.
(ii) Each year, assume a 1/2 probability that a portfolio& #39;s value goes up by 75%, and a 1/2 probability that its value goes down by 50%.
(iii) Run this simulation over 25 years.
Before going on, how do you expect the average portfolio to perform under these parameters?
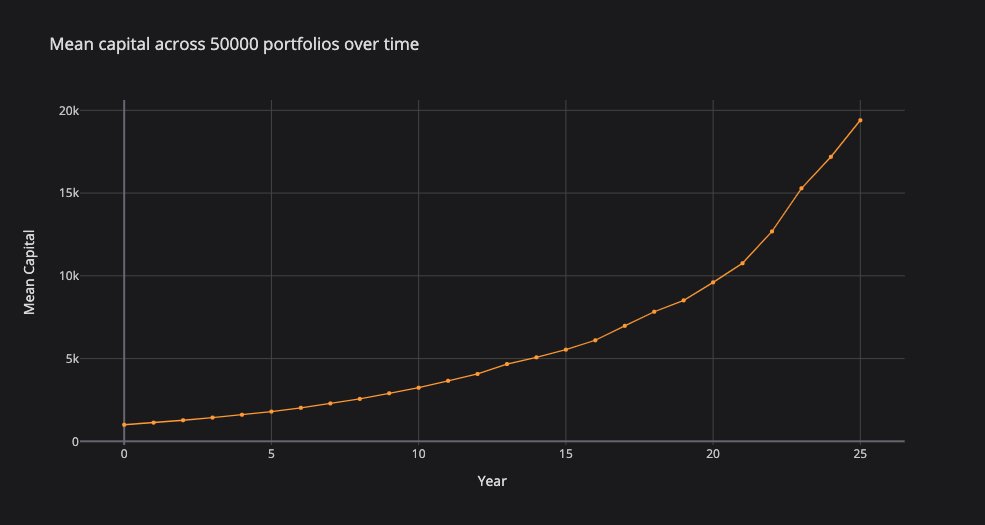
An expected value approach tells us that we should expect the average of +75% and -50% each year (i.e., an average return of 12.5% per year). The mean value of portfolios roughly corroborates that view (mean value of $19,400.71, vs expected value of $19,002.60).
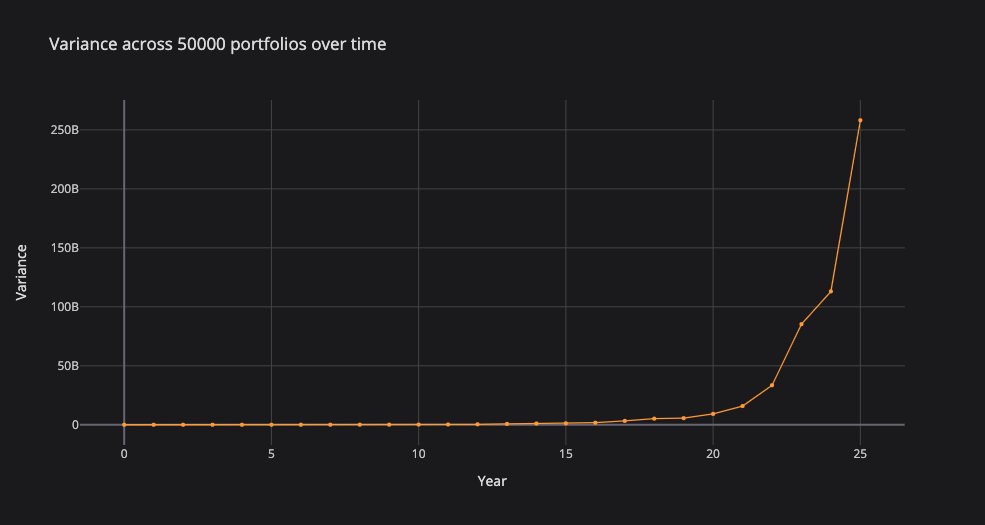
Intuitively, the key is that every portfolio has a zero lower bound. The worst possible portfolio (-50% per year) goes down by a decreasing amount each year. The best possible portfolio (+75% per year) grows by an increasing amount each year.
The result is that the exponentially growing outliers pull the mean portfolio up more than the worst-performing portfolios drag the mean down.
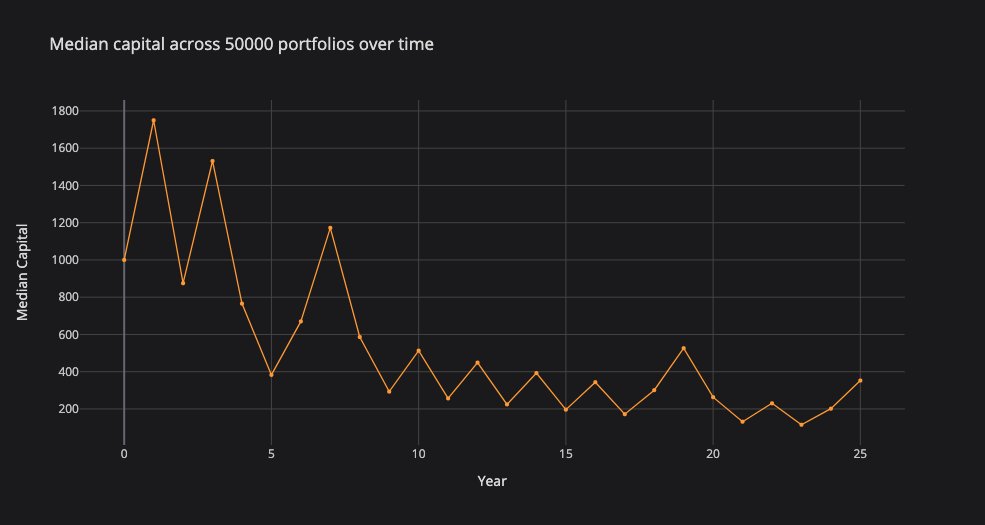
This creates the illusion of positive expected value, even as the median portfolio tends towards zero, with a 12.5% decline in value per year.
Many thanks to @_Dave__White_, @MartinTassy, @_charlienoyes, and @danrobinson for their work, and for inspiring this experiment.

 Read on Twitter


