Short Hitting Analytics Thread:
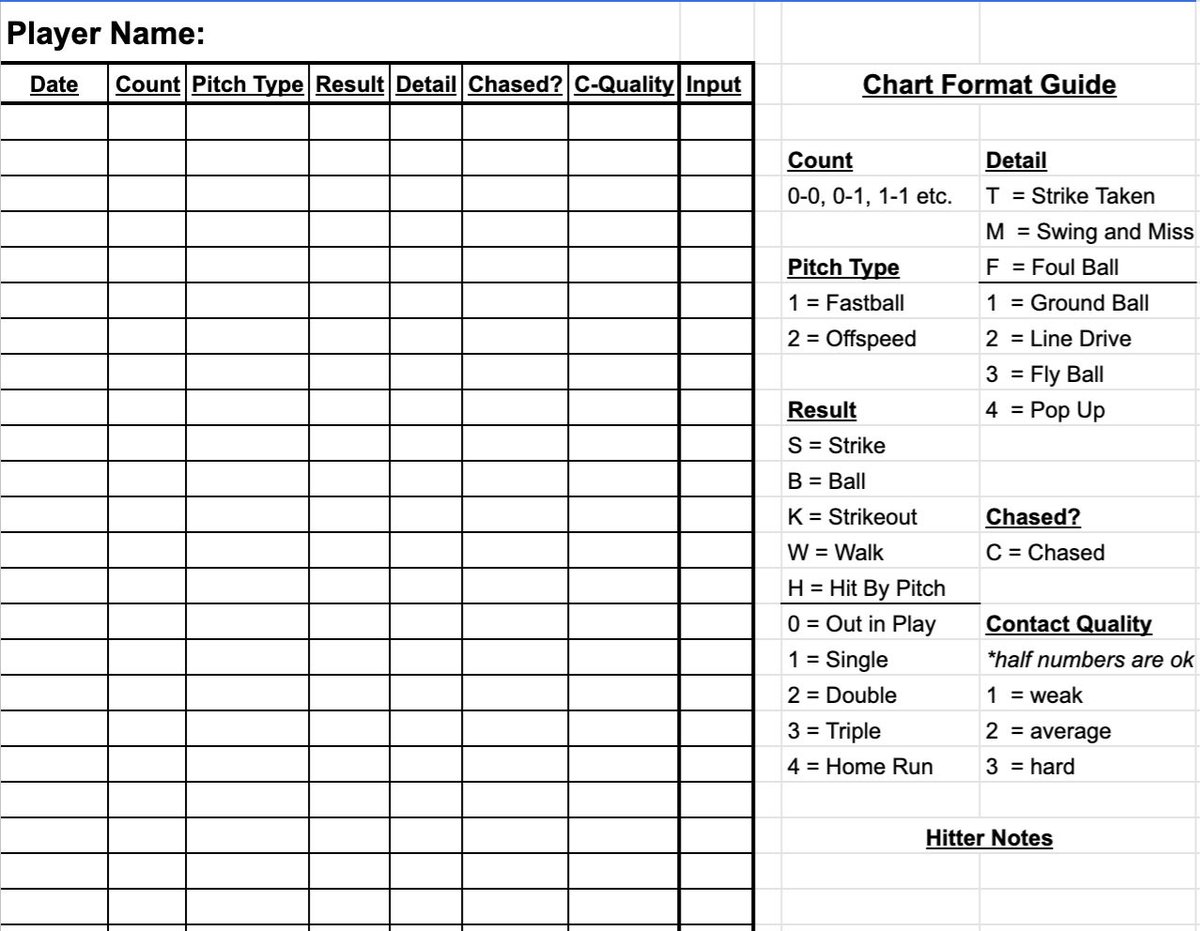
@Rogue_Baseball uses a simple hitting chart to capture a plethora of useful information relevant to both practice and games. Here is the in-game chart.
@Rogue_Baseball uses a simple hitting chart to capture a plethora of useful information relevant to both practice and games. Here is the in-game chart.
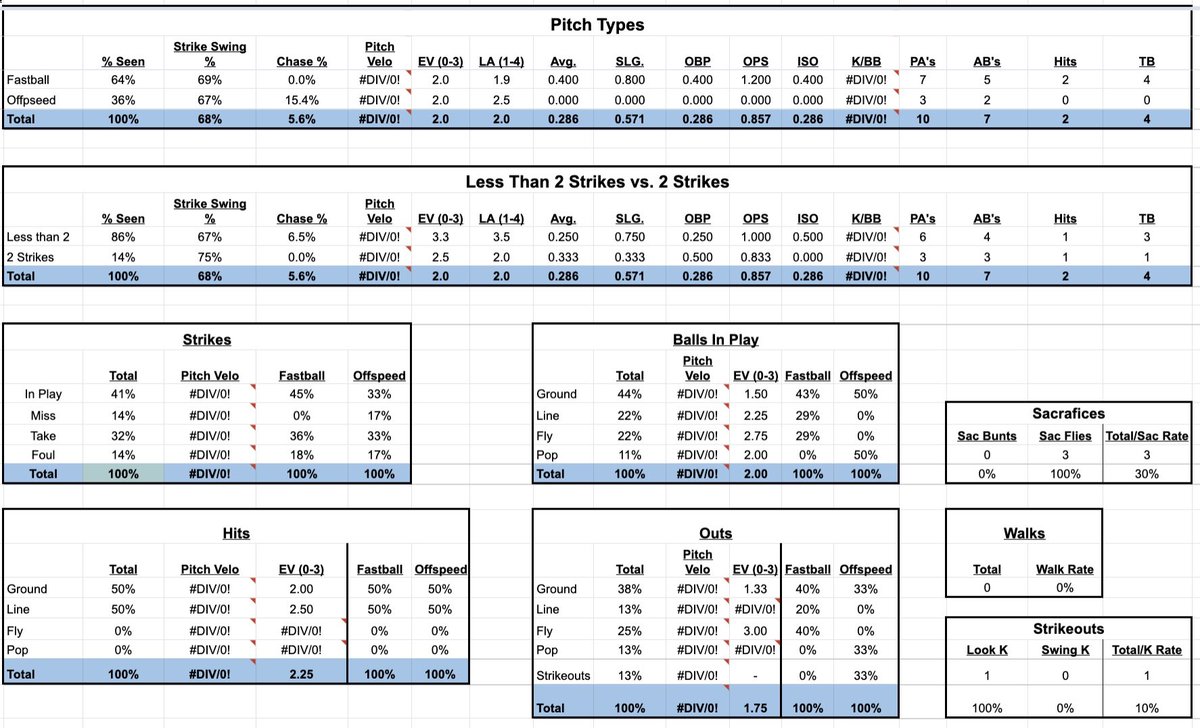
When all plugged correctly, the sheet has been made to output many different scenarios that hitters face and how they perform in each. These and the following tables are available for each individual and the team as a whole.
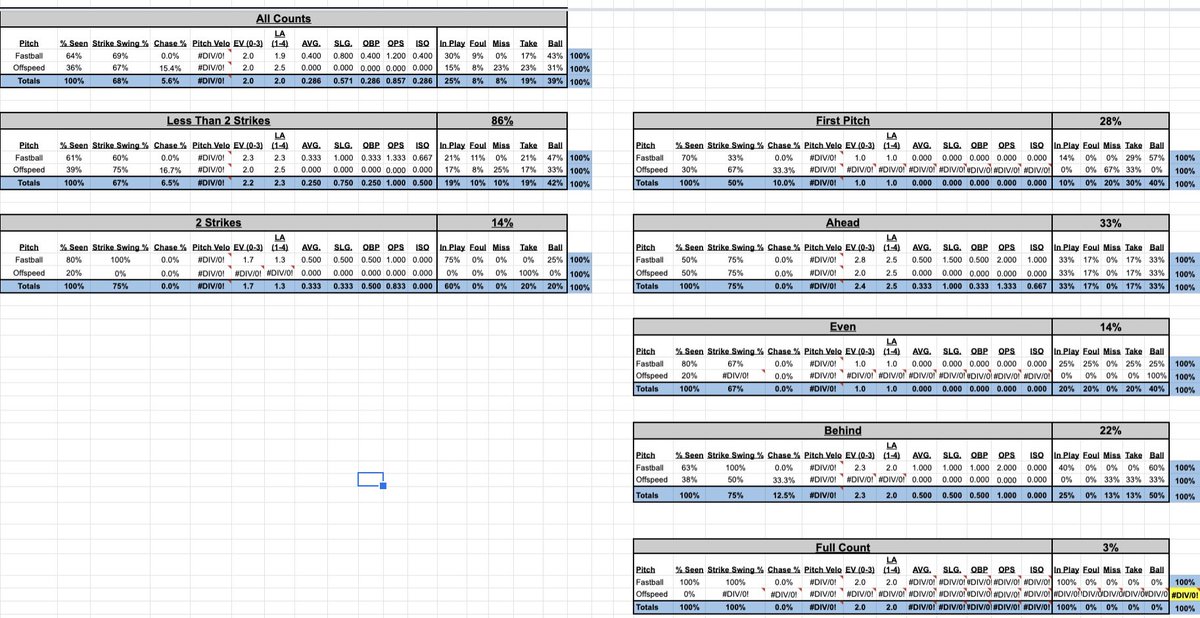
More charts describing more specific situations. Being able to get this detailed helps with working with approaches. This player should continue being on time and looking for FB’s in-game but improve his ability to hit off-speed in practice.
This chart is the golden goose. Each stat we keep is correlated to the others to show what is producing desirable outcomes. No surprise, EV correlates positively with production. K/BB correlates negatively.
Hit the ball hard, put it in play with 2k. Doesn’t sound like new info to me. But doesn’t it make you a more productive and reliable source of information for young players when you have the evidence to explain why?
Important note: this sheet is created and maintained by @Ryan_Serena4, BA in secondary education, concentration in history. Little/No prior experience or education in Excel or statistics/analytics. Just a baseball guy who works his ass off.
The game isn’t being “ruined by nerds.” The data revolution is being fueled by coaches who want to be deliberate and accurate in how they train and coach their players.

 Read on Twitter


