How I begin in Technical Analysis (THREAD)
I took a trader I liked & copied everything on the chart to mine (COLORS & INDICATORS)
This way you can ‘’see’’ what he see. Every time he post charts & updates you look at it & try to understand/notice how the chart moved
I took a trader I liked & copied everything on the chart to mine (COLORS & INDICATORS)
This way you can ‘’see’’ what he see. Every time he post charts & updates you look at it & try to understand/notice how the chart moved
In relation to what he said & anticipated from his analysis. You’ll naturally start to understand how chart work while using the trader you chose as a GUIDE to YOUR analysis
Then you go from there & you TWEAK it over time to what work & what doesn’t for YOU
Then you go from there & you TWEAK it over time to what work & what doesn’t for YOU
Start with DAILY Timeframe.
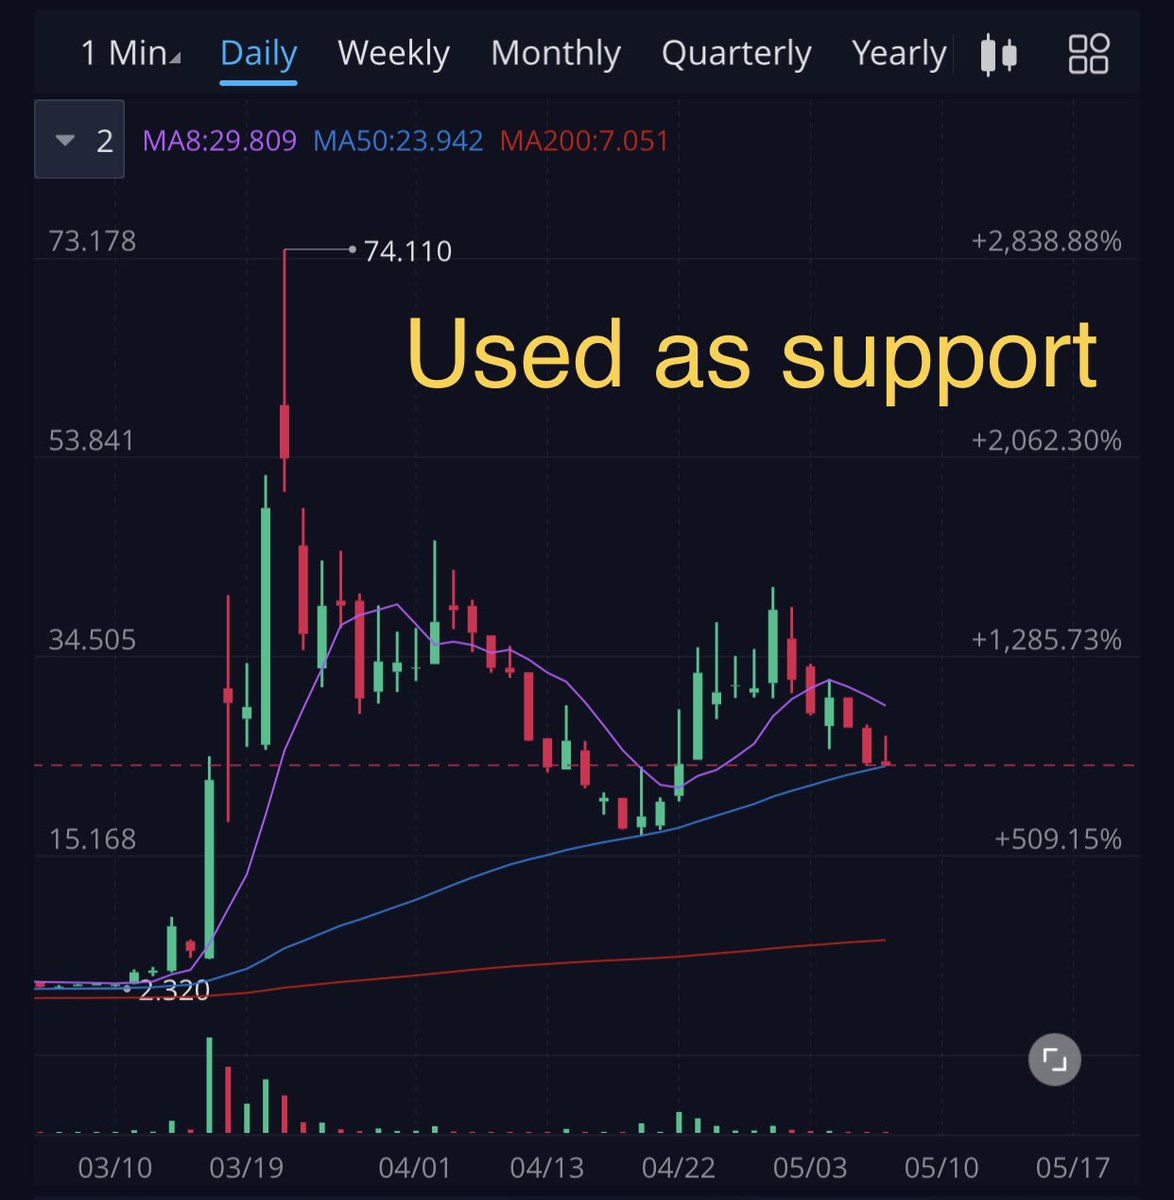
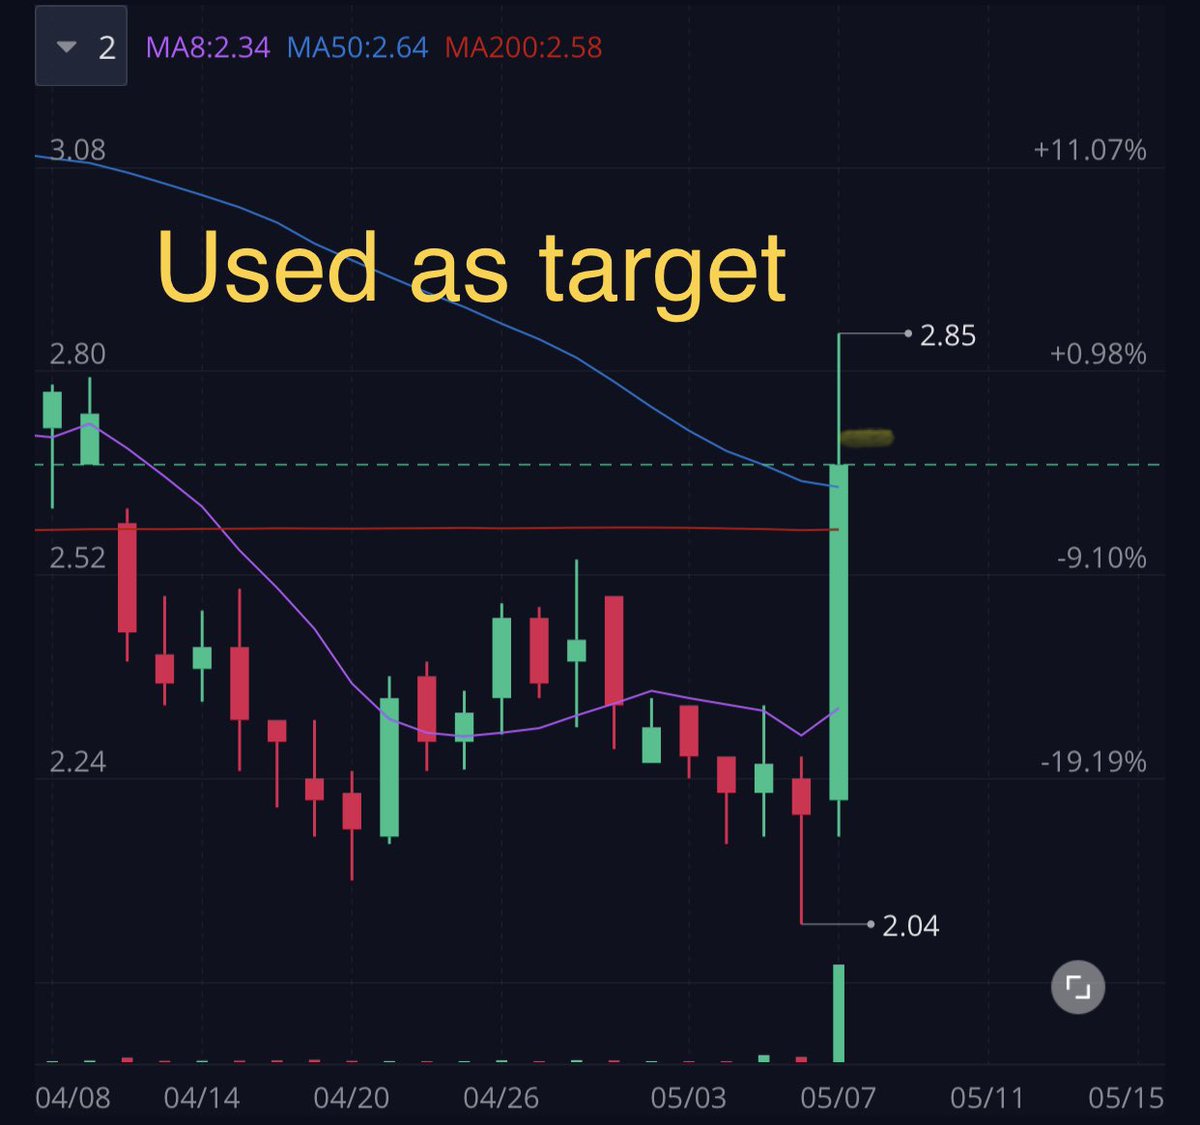
The one I chose used 200/50 SMA as target or support. I quickly noticed how accurate this was. So I kept it, use it & def my fav indicator. The accuracy of the 50/200 SMA when used as target is insane & on the other side, when used as support
The one I chose used 200/50 SMA as target or support. I quickly noticed how accurate this was. So I kept it, use it & def my fav indicator. The accuracy of the 50/200 SMA when used as target is insane & on the other side, when used as support
It allow you to quickly find your risk (Stop Loss) cause you’ll notice when it break down it continue to drop
You’ll also notice the 50/200 are good entry zone cause it give an amazing R/R. You hold as long as it hold. If break down, I learned to let some wiggle room
You’ll also notice the 50/200 are good entry zone cause it give an amazing R/R. You hold as long as it hold. If break down, I learned to let some wiggle room
Then if not get back over, you CUT. See? Only using the 50/200 SMA I learned ‘’PT?’’ (Resistance), Entry (Support) & when to cut QUICK
Then he was using the 8 EMA. I never found any good utility on it (FOR ME) so I removed it. (1st tweak!) He also used the 20 EMA wich I never found any good correlation of the chart movement so I also removed it (2nd tweak!)
I know many use them but I dont
I know many use them but I dont
Wich is why it have to FIT YOU.
Later on I saw someone using the 100 SMA so I added it to try it. After some time I notice that is was very accurate as resistance so I kept it (3rd tweak!)
You can see me mentionning ‘’The 3 Large SMA’’ quite often. There the WHY
Later on I saw someone using the 100 SMA so I added it to try it. After some time I notice that is was very accurate as resistance so I kept it (3rd tweak!)
You can see me mentionning ‘’The 3 Large SMA’’ quite often. There the WHY
Then you have the under laying indicator (RSI MACD Slowstoch etc)
First I learned what they do using google
Then I was watching what the RSI & the MACD look like when the trader I chose post chart
You’ll notice quick enough how they look
First I learned what they do using google
Then I was watching what the RSI & the MACD look like when the trader I chose post chart
You’ll notice quick enough how they look
They both curl up.
The RSI was always curling up about to cross 50
The MACD was curling up & about to cross with the signal
Then you THINK
Do the play work more than not when those 2 are curling up? YES! Then I was looking for that on my plays. I kept them both
The RSI was always curling up about to cross 50
The MACD was curling up & about to cross with the signal
Then you THINK
Do the play work more than not when those 2 are curling up? YES! Then I was looking for that on my plays. I kept them both
& I have succes with chart that have those metrics.
Then every time he posted a chart, the Slowstoch was ‘’in the basement https://abs.twimg.com/emoji/v2/... draggable="false" alt="😉" title="Zwinkerndes Gesicht" aria-label="Emoji: Zwinkerndes Gesicht">’’ and also curling up
When those 3 curls (very nice looking curl) I had succes so I kept it too.
He was using ADX wich I was too but
Then every time he posted a chart, the Slowstoch was ‘’in the basement
When those 3 curls (very nice looking curl) I had succes so I kept it too.
He was using ADX wich I was too but
A friend recommended me DMI to replace the ADX & I liked it after trying it so I made the switch (Another tweak!)
One thing that REALLY helped is when someone told me
‘’Charting is SUBJECTIVE’’
Think about it! Interpret them as you want & as you like as long as it work
‘’Charting is SUBJECTIVE’’
Think about it! Interpret them as you want & as you like as long as it work
Dont forget to use the same colors for EMA/SMA so you wont get confused
200 RED
50 BLUE
100 GREEN
The EMA are often more flashy colors
200 RED
50 BLUE
100 GREEN
The EMA are often more flashy colors

 Read on Twitter


