I HAVE CAUGHT @theage OUT IN A HUGE LIE ON LOCKDOWN STRICTNESS IN THIS ARTICLE!
A MUST READ! https://abs.twimg.com/emoji/v2/... draggable="false" alt="👀" title="Augen" aria-label="Emoji: Augen">
 https://abs.twimg.com/emoji/v2/... draggable="false" alt="👀" title="Augen" aria-label="Emoji: Augen">
Zach Hope and @Gay_Alcorn you must amend this article and apologise! @ABCmediawatch
A thread https://abs.twimg.com/emoji/v2/... draggable="false" alt="⬇️" title="Pfeil nach unten" aria-label="Emoji: Pfeil nach unten">
 https://abs.twimg.com/emoji/v2/... draggable="false" alt="⬇️" title="Pfeil nach unten" aria-label="Emoji: Pfeil nach unten">
 https://abs.twimg.com/emoji/v2/... draggable="false" alt="⬇️" title="Pfeil nach unten" aria-label="Emoji: Pfeil nach unten">
#auspol #springst #ThisisNotJournalism #comments">https://www.theage.com.au/national/victoria/toughest-lockdown-melbourne-s-dark-2020-in-global-context-20210508-p57q3j.html?utm_medium=Social&utm_source=Twitter #comments">https://www.theage.com.au/national/...
A MUST READ!
Zach Hope and @Gay_Alcorn you must amend this article and apologise! @ABCmediawatch
A thread
#auspol #springst #ThisisNotJournalism #comments">https://www.theage.com.au/national/victoria/toughest-lockdown-melbourne-s-dark-2020-in-global-context-20210508-p57q3j.html?utm_medium=Social&utm_source=Twitter #comments">https://www.theage.com.au/national/...
The article looks at the strictness of lockdown measures across all countries via the Oxford COVID19 Government response tracker. Lockdown is measured via 9 ordinal scales with flags on those scales also. This is then calculated into a score out of 100.
The article correctly states that Australia reached a max total of 78 (78.24 to be precise) in February this year.
With 30 countries scoring higher than 95, clearly, Australia (and Vic) did not have the toughest lockdown, making this article rather pointless but whatever...
With 30 countries scoring higher than 95, clearly, Australia (and Vic) did not have the toughest lockdown, making this article rather pointless but whatever...
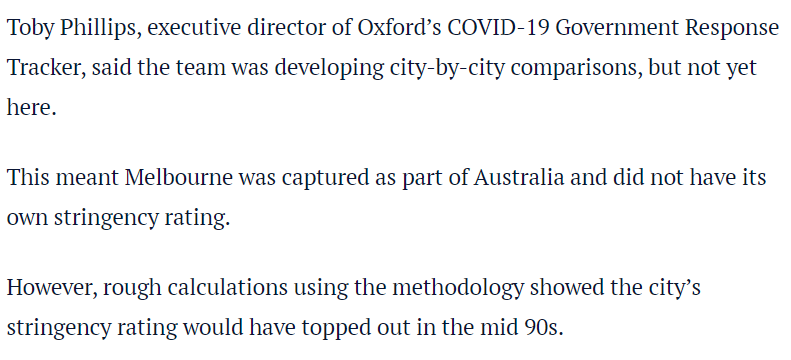
Here& #39;s where the lie or a lack of fact-checking comes in. The article goes on to state that the ratings cover Australia as a whole and not individual cities and claims that Melbourne if rated on its own would have a higher rating.
THIS IS FALSE @Gay_Alcorn!
THIS IS FALSE @Gay_Alcorn!
Here& #39;s the proof!
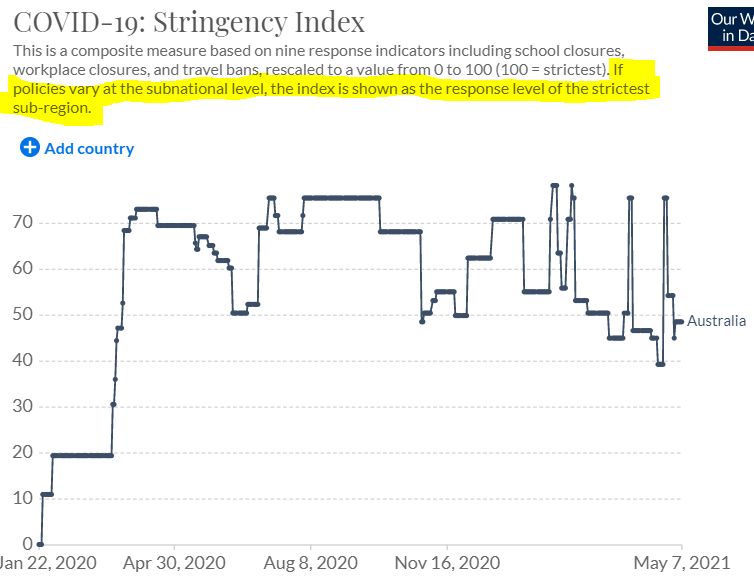
When calculating the stats for each country, as highlighted in yellow, when the policies vary from the National level to sub-national level (in this case State level), then & #39;THE INDEX IS SHOWN AS THE RESPONSE LEVEL OF THE STRICTEST SUB-REGION& #39;
When calculating the stats for each country, as highlighted in yellow, when the policies vary from the National level to sub-national level (in this case State level), then & #39;THE INDEX IS SHOWN AS THE RESPONSE LEVEL OF THE STRICTEST SUB-REGION& #39;
That means Australia& #39;s score out of 100 - 75.46 during August & #39;20 Stage 4 and 78.24 during Feb & #39;21 Stage 4 is Victoria& #39;s score as Vic had the strongest restrictions!
You can view the source for the above graph via the link below! @Gay_Alcorn take note! https://ourworldindata.org/grapher/covid-stringency-index?tab=chart&country=~AUS">https://ourworldindata.org/grapher/c...
You can view the source for the above graph via the link below! @Gay_Alcorn take note! https://ourworldindata.org/grapher/covid-stringency-index?tab=chart&country=~AUS">https://ourworldindata.org/grapher/c...
This means that this line in the article is not only a lie given that we know Victoria (or Melbourne& #39;s) top score was 78.24 but it also means that @theage has used some whack and false calculations to get the score of mid-90s.
Care to show your maths Zac Hope?
Care to show your maths Zac Hope?
How did @theage screw this up?
They misinterpreted @TobyMPhillips.
Whilst it is true that you can& #39;t view city by city comparisons that DOESN& #39;T mean that Melbourne was captured as part of Australia.
They misinterpreted @TobyMPhillips.
Whilst it is true that you can& #39;t view city by city comparisons that DOESN& #39;T mean that Melbourne was captured as part of Australia.
As we now know, the & #39;If policies vary at the subnational
level, the index is shown as the response level of the strictest sub-region.& #39;
level, the index is shown as the response level of the strictest sub-region.& #39;
So, clearly, the Age misinterpreted what Toby said but if they weren& #39;t so keen to attack Dan, perhaps they would have
1) Looked at the data
2) Looked at the graph disclaimer
3) Consulted a mathematician before blurting out their mid-90s nonense.
Lazy journalism. @Gay_Alcorn
1) Looked at the data
2) Looked at the graph disclaimer
3) Consulted a mathematician before blurting out their mid-90s nonense.
Lazy journalism. @Gay_Alcorn
Still not convinced? Want more proof?
Say no more!
I& #39;ve extracted in this Google doc in the Tweet below the data from Aus for August & #39;20 and Feb & #39;21 with scores of 75.46 and 78.24 respectively.
August is Green. Feb is White and the values that are different in Feb are yellow.
Say no more!
I& #39;ve extracted in this Google doc in the Tweet below the data from Aus for August & #39;20 and Feb & #39;21 with scores of 75.46 and 78.24 respectively.
August is Green. Feb is White and the values that are different in Feb are yellow.
In the Tweets below I& #39;ll show that this data is indeed Melbourne& #39;s restrictions.
Take a brief look at this data first though. https://drive.google.com/file/d/1gCYc7F_y21M7PJ6g3TZi3Swd0gMjX1pk/view?usp=sharing">https://drive.google.com/file/d/1g...
Take a brief look at this data first though. https://drive.google.com/file/d/1gCYc7F_y21M7PJ6g3TZi3Swd0gMjX1pk/view?usp=sharing">https://drive.google.com/file/d/1g...
I& #39;ve extracted only the relevant data and removed a few irrelevant columns. If you want to double-check that I haven& #39;t tampered with the data above, you can view the original CSV with all countries here. I recommend using excel& #39;s filter functions ;) https://github.com/OxCGRT/covid-policy-tracker/blob/master/data/OxCGRT_latest.csv">https://github.com/OxCGRT/co...
So let& #39;s look at the data in August and prove that it is indeed Melbourne& #39;s stage 4 restrictions.
You can view how the scores are given via this link https://ourworldindata.org/grapher/covid-stringency-index">https://ourworldindata.org/grapher/c... and then click on the sources tab.
You can view how the scores are given via this link https://ourworldindata.org/grapher/covid-stringency-index">https://ourworldindata.org/grapher/c... and then click on the sources tab.
An in-depth breakdown on how the scores work - plus the info on how the flags work can be viewed here #containment-and-closure-policies">https://github.com/OxCGRT/covid-policy-tracker/blob/master/documentation/codebook.md #containment-and-closure-policies">https://github.com/OxCGRT/co...
So, C1 - School closures. 3 - Require closing all levels
Yep. That& #39;s what we had in Melbourne. Remote learning for all.
C2 - Workplace closing. 3 - Require closing (or work from home) all but essential workplaces (eg grocery stores, doctors)
Yep. That& #39;s what we had in Melbourne
Yep. That& #39;s what we had in Melbourne. Remote learning for all.
C2 - Workplace closing. 3 - Require closing (or work from home) all but essential workplaces (eg grocery stores, doctors)
Yep. That& #39;s what we had in Melbourne
C3 - Cancel public events. 2 - Require cancelling.
Yep. That& #39;s what we had in Melbourne.
C4 - Restrictions on gatherings. 4 - Restrictions on gatherings of less than 10 people.
Yep. That& #39;s what we had in Melbourne.
Yep. That& #39;s what we had in Melbourne.
C4 - Restrictions on gatherings. 4 - Restrictions on gatherings of less than 10 people.
Yep. That& #39;s what we had in Melbourne.
C5 - Close public transport. 1 - Recommend closing (or significantly reduce volume/route/means of transport available)
Yep. That& #39;s what we had in Melbourne.
Yep. That& #39;s what we had in Melbourne.
C6 - Stay at home requirements. 2 - require not leaving house with exceptions for daily exercise, grocery shopping, and ‘essential’ trips.
That& #39;s what we had in Melbourne.
C7 - Restrictions on internal movement. 2 - Restrict movement.
Yep. That& #39;s what we had in Melbourne.
That& #39;s what we had in Melbourne.
C7 - Restrictions on internal movement. 2 - Restrict movement.
Yep. That& #39;s what we had in Melbourne.
C8 - International travel controls. 4 - Total border closure.
This is what the whole country had, excluding returning Australians.
This is what the whole country had, excluding returning Australians.
As you can clearly see, this data for Australia is based on Melbourne& #39;s restrictions, not Australia as a whole as Melbourne had the strongest restrictions.
Again @Gay_Alcorn "the index is shown as the response level of the strictest sub-region."
The mid 90& #39;s claim is a lie.
Again @Gay_Alcorn "the index is shown as the response level of the strictest sub-region."
The mid 90& #39;s claim is a lie.
I& #39;m not sure what the 9th measure for the Stringency Rating is, whether it is face masks or information campaigns. It& #39;s not clear to me - if you know then please inform us. Nevertheless, Victoria had the strictest face mask regulations also.
So you& #39;ll note that looking at my excel sheet, when the score went t0 78.24 during stage 4 in Feb 21 that the C7_Flag is a 1, not a 0.
That& #39;s the difference. This flag is for restrictions on internal movement, which were general not targetted during this period.
That& #39;s the difference. This flag is for restrictions on internal movement, which were general not targetted during this period.
Naturally, you& #39;ll note that the Feb 21 period is still Melbourne/Vic& #39;s restrictions, it has nothing to do with multiple states increasing restrictions as the data takes the strongest state restrictions for the whole country rather than an average as incorrectly claimed by @theage
So overall we have an article that incorrectly tries to imply that Melbourne had some of the toughest restrictions in the world. The mid-90s claim is a total lie. The evidence is here. It& #39;s time to correct the record @Gay_Alcorn and Zac Hope.
. @ABCmediawatch, you& #39;d do well to cover this poor journalism from @theage.
Enjoy your Sunday everyone.
Enjoy your Sunday everyone.

 Read on Twitter


