
 Read on Twitter
Hi everyone, decided to create a  https://abs.twimg.com/emoji/v2/... draggable="false" alt="🧵" title="Thread" aria-label="Emoji: Thread">to answer some questions I received for FPLOptimized.
https://fploptimized.com/
I">https://fploptimized.com/">... will go over briefly what each page/tool does, how to use them.
https://fploptimized.com/
I">https://fploptimized.com/">... will go over briefly what each page/tool does, how to use them.
 to answer some questions I received for FPLOptimized. https://fploptimized.com/">... will go over briefly what each page/tool does, how to use them." title="Hi everyone, decided to create a https://abs.twimg.com/emoji/v2/... draggable="false" alt="🧵" title="Thread" aria-label="Emoji: Thread">to answer some questions I received for FPLOptimized. https://fploptimized.com/">... will go over briefly what each page/tool does, how to use them." class="img-responsive" style="max-width:100%;"/>
General Info
- I work in the field of Operations Research, and specialized in optimization.
- I treat FPL as an optimization problem and try to show different analytical aspects of it.
- Expected point data is courtesy of @fplreview, an awesome resource for input data.
- I work in the field of Operations Research, and specialized in optimization.
- I treat FPL as an optimization problem and try to show different analytical aspects of it.
- Expected point data is courtesy of @fplreview, an awesome resource for input data.
- My main objective when I started was to highlight optimization modeling capabilities of the Python package & #39;sasoptpy& #39;. I& #39;m the main developer of this package and FPL is a great medium to highlight its capabilities.
- Entire webpage is open-source: https://github.com/sertalpbilal/fpl_optimized">https://github.com/sertalpbi...
- Entire webpage is open-source: https://github.com/sertalpbilal/fpl_optimized">https://github.com/sertalpbi...
Tools
1) Optimal Squads: It& #39;s pretty self-explanatory, but essentially every 6 hours, I download FPLReview data and optimize under various rules.
This page is for giving a quick idea on best selections for upcoming weeks.
https://fploptimized.com/week.html ">https://fploptimized.com/week.html...
 Optimal Squads: It& #39;s pretty self-explanatory, but essentially every 6 hours, I download FPLReview data and optimize under various rules.This page is for giving a quick idea on best selections for upcoming weeks. https://fploptimized.com/week.html...")
1) Optimal Squads: It& #39;s pretty self-explanatory, but essentially every 6 hours, I download FPLReview data and optimize under various rules.
This page is for giving a quick idea on best selections for upcoming weeks.
https://fploptimized.com/week.html ">https://fploptimized.com/week.html...
2) Live GW: This page is for tracking how well your team is doing compared to other managers. I pull live data from FPL and show you a live status about your gain and losses.
https://fploptimized.com/live_gw.html ">https://fploptimized.com/live_gw.h...
 Live GW: This page is for tracking how well your team is doing compared to other managers. I pull live data from FPL and show you a live status about your gain and losses. https://fploptimized.com/live_gw.h...")
https://fploptimized.com/live_gw.html ">https://fploptimized.com/live_gw.h...
When you enter this page, it asks you to enter your FPL team ID. Then, it pulls your team picks and shows you how many players you have in this GW& #39;s fixtures on the timeline.
You can click on these bars to open the report page.


You can click on these bars to open the report page.
Report page shows key information about where points come from. Your own players are highlighted as blue. & #39;xP& #39; represents pre-GW prediction for player, & #39;rP& #39; represents the actual (realized) points. You can also see a sortable player details table at the bottom.
 points. You can also see a sortable player details table at the bottom.")
& #39;xP Net& #39; shows the expected impact of player for you. For example if you have Vardy and he is expected to score 5.22 and owned by 29% of managers, his benefit is reduced to 5.22*(100%-29%) = 3.71 for you.
Realized net benefit in this case 3.55 where predicted was 3.71.
 = 3.71 for you.Realized net benefit in this case 3.55 where predicted was 3.71.")
Realized net benefit in this case 3.55 where predicted was 3.71.
You can click & #39;Game Table& #39; tab to see summary of everything. Here, & #39;Expected Net& #39; shows the total change you should expect for your team compared to average. & #39;Realized Net& #39; is the outcome.

When I refer & #39;average& #39;, I talk about teams in the random sample. You can change which tier you would like to compare yourself (top left). You can also check earlier GWs by clicking on GW number.
. You can also check earlier GWs by clicking on GW number.")
. You can also check earlier GWs by clicking on GW number.")
On the right side, there is a menu for several operations. The first button opens a modal where you can edit your team. This is particularly useful for planning next GW when you choose the upcoming GW from top left.


Live GW tool is not meant to be a planning tool, it is to provide information about your expected point and rank changes and to give you a better understanding how well you are doing to average. For this purposes there are 4 graphs in this page.
The first one show your expected points (so far), realized points (so far) and projected points (at the end of GW). In this image, this team is projected to reach 99 points with how things are going.
, realized points (so far) and projected points (at the end of GW). In this image, this team is projected to reach 99 points with how things are going.")
In this example, the team was expected to reach 17 points at this point but reached 16, so it is underperforming slightly. Other managers were expected to have 11.8 points, but reached 14.9 points, so they are overperforming very significantly.
You can see your performance minus average performance in the next graph. You can see where your live rank will probably improve and the magnitude on the graph.

Since difference is based on how much you gain (your team) minus how much you lose (other players you don& #39;t own), there is a separate chart showing them separately.
 minus how much you lose (other players you don& #39;t own), there is a separate chart showing them separately.")
3) GW Summary
https://fploptimized.com/team_summary.html
GW">https://fploptimized.com/team_summ... Summary is similar to Live GW in nature, but focused more on gains and losses from each player separately.
 GW Summary https://fploptimized.com/team_summ... Summary is similar to Live GW in nature, but focused more on gains and losses from each player separately.")
https://fploptimized.com/team_summary.html
GW">https://fploptimized.com/team_summ... Summary is similar to Live GW in nature, but focused more on gains and losses from each player separately.
Expected gain/loss chart shows how much points you are expected gain (from blue colored players) and how much you are expected to lose (from red and gray colored players). Red colored players are the greatest threats to your team.
 and how much you are expected to lose (from red and gray colored players). Red colored players are the greatest threats to your team.")
 and how much you are expected to lose (from red and gray colored players). Red colored players are the greatest threats to your team.")
You can also edit xP/rP values from the menu top right. This is useful for what-if analysis before games are played. You can also click on a player to see detailed information about where Effective Ownership % comes from.

4) FPL Analytics League
https://fploptimized.com/fpl_analytics_league.html
This">https://fploptimized.com/fpl_analy... is a collection of data & analytics-focused FPL managers. If you are interested in joining, send me a DM with your team ID. We use @fplreview season review tool and generate this table for bragging rights :)
 FPL Analytics League https://fploptimized.com/fpl_analy... is a collection of data & analytics-focused FPL managers. If you are interested in joining, send me a DM with your team ID. We use @fplreview season review tool and generate this table for bragging rights :)")
https://fploptimized.com/fpl_analytics_league.html
This">https://fploptimized.com/fpl_analy... is a collection of data & analytics-focused FPL managers. If you are interested in joining, send me a DM with your team ID. We use @fplreview season review tool and generate this table for bragging rights :)
5) Fixture
https://fploptimized.com/fpl_fixture.html
This">https://fploptimized.com/fpl_fixtu... tool shows the entire PL season. Difficulty of fixtures are color coded (editable)
Values are mainly coming from FiveThirtyEight, arguably the best available data to generate such a table.
Link to the data source
https://projects.fivethirtyeight.com/soccer-predictions/premier-league/">https://projects.fivethirtyeight.com/soccer-pr...
 Fixture https://fploptimized.com/fpl_fixtu... tool shows the entire PL season. Difficulty of fixtures are color coded (editable) Values are mainly coming from FiveThirtyEight, arguably the best available data to generate such a table.Link to the data source https://projects.fivethirtyeight.com/soccer-pr...")
https://fploptimized.com/fpl_fixture.html
This">https://fploptimized.com/fpl_fixtu... tool shows the entire PL season. Difficulty of fixtures are color coded (editable)
Values are mainly coming from FiveThirtyEight, arguably the best available data to generate such a table.
Link to the data source
https://projects.fivethirtyeight.com/soccer-predictions/premier-league/">https://projects.fivethirtyeight.com/soccer-pr...
6) Ownership Rates
https://fploptimized.com/ownership_rates.html
I">https://fploptimized.com/ownership... think this page is often overlooked, but based on tier data (previous GW) and transfer trends, this page shows predicted ownership for each tier. You can also enter captaincy poll results to have a good EO prediction for next GW.
 Ownership Rates https://fploptimized.com/ownership... think this page is often overlooked, but based on tier data (previous GW) and transfer trends, this page shows predicted ownership for each tier. You can also enter captaincy poll results to have a good EO prediction for next GW.")
https://fploptimized.com/ownership_rates.html
I">https://fploptimized.com/ownership... think this page is often overlooked, but based on tier data (previous GW) and transfer trends, this page shows predicted ownership for each tier. You can also enter captaincy poll results to have a good EO prediction for next GW.
Regarding Optimization
Some people asked if there is a way to optimize their decisions for next GWs using FPLOptimized. It is not possible, and I believe optimizing on browser is an oversimplification of how complex FPL as a problem.
Some people asked if there is a way to optimize their decisions for next GWs using FPLOptimized. It is not possible, and I believe optimizing on browser is an oversimplification of how complex FPL as a problem.
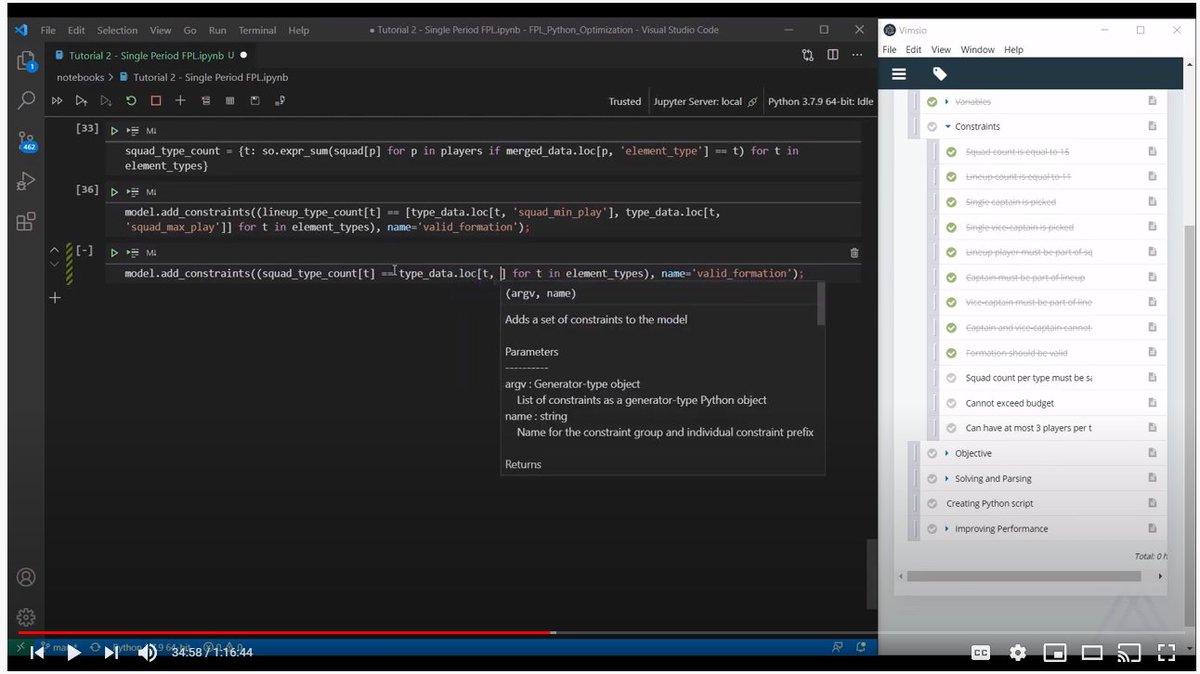
Writing an optimization model isn& #39;t very difficult for FPL & I have tutorials on how to do it on your own machine using Excel or Python. These models could give you much a very flexible tool for your decision making.
Excel
https://youtube.com/playlist?list=PLrIyJJU8_viOLw3BovPDx5QLKkCb8XOTp
Python
https://youtube.com/playlist... href=" https://youtube.com/playlist?list=PLrIyJJU8_viOags1yudB_wyafRuTNs1Ed">https://youtube.com/playlist...
Excel
https://youtube.com/playlist?list=PLrIyJJU8_viOLw3BovPDx5QLKkCb8XOTp
Python
 https://youtube.com/playlist..." title="Writing an optimization model isn& #39;t very difficult for FPL & I have tutorials on how to do it on your own machine using Excel or Python. These models could give you much a very flexible tool for your decision making.Excel https://youtube.com/playlist... href=" https://youtube.com/playlist?list=PLrIyJJU8_viOags1yudB_wyafRuTNs1Ed">https://youtube.com/playlist..." class="img-responsive" style="max-width:100%;"/>
This is it for now, but let me know if you have any questions or suggestions. I love talking about optimization and FPL.
Also, feel free to fork the repository and develop your own tools on top of it.
https://abs.twimg.com/emoji/v2/... draggable="false" alt="⚽️" title="Fußball" aria-label="Emoji: Fußball">
Also, feel free to fork the repository and develop your own tools on top of it.


