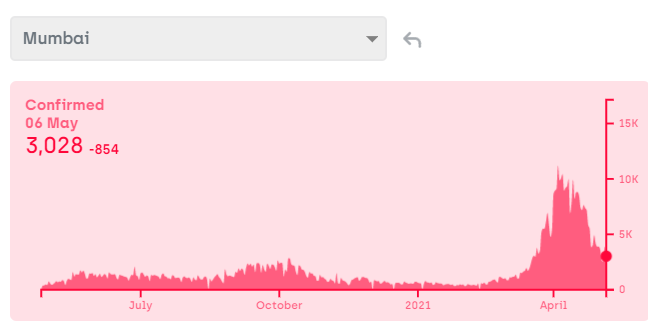
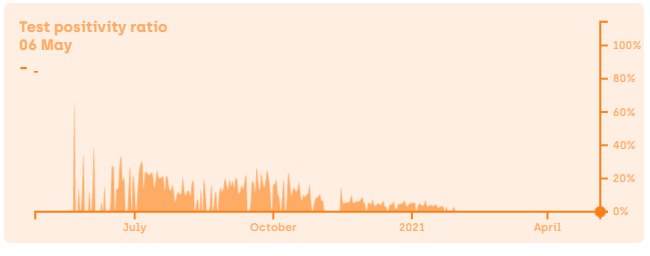
These are two images. The entire flow of cases of COVID from the very beginning to today. The next image is your TPR %. Unfortunately, the website has not mapped that for the current wave. But I have checked it is hovering around the same mark for the peak i.e. 20 to 30% range.
Now here are some points I want to raise. Mumbai a strict lockdown from 22nd March 2020 to July 2020. A slightly relaxed state till October 2020 and then it opened up to again start strict restrictions from April 2021.
Now if we look at the charts we can clearly see during the strictest lockdown phase (April to July 2020) the cases kept on rising and the TPR% remained as high as April 2021 (Do not believe me go and check the BMC reports yourself).
So if lockdowns work so well and are so efficient can anyone explain to me what happened from April to July 2020? The arguments I hear are lockdowns reduce your spread and TPR%. It did not happen in the 1st wave in Mumbai. You may not like it but that is the truth.
Remember the testing nos were very low at that phase due to lack of infrastructure. But the TPR% in that period is the same as our current peak of April 2021. (Again do not trust me, go and check the BMC data yourself)

 Read on Twitter


