Today in the #AtlanticBubble
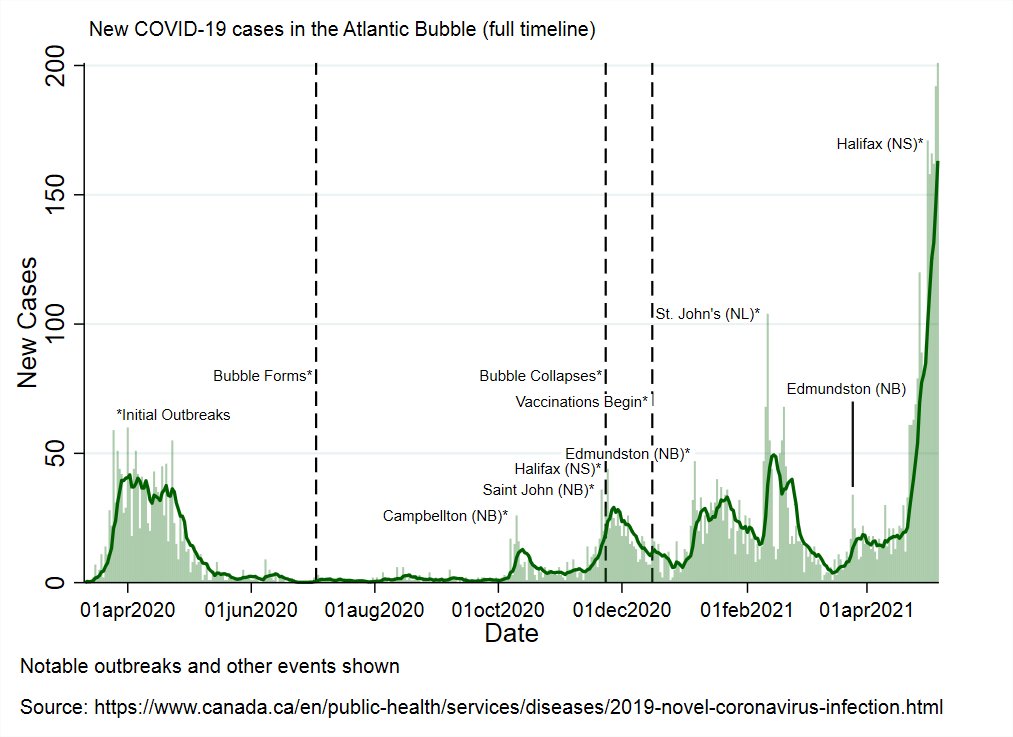
201 new cases were reported: 2 in PEI, 6 in Newfoundland and Labrador, 11 in New Brunswick, and 182 in Nova Scotia.
17/19 outside NS were traced.
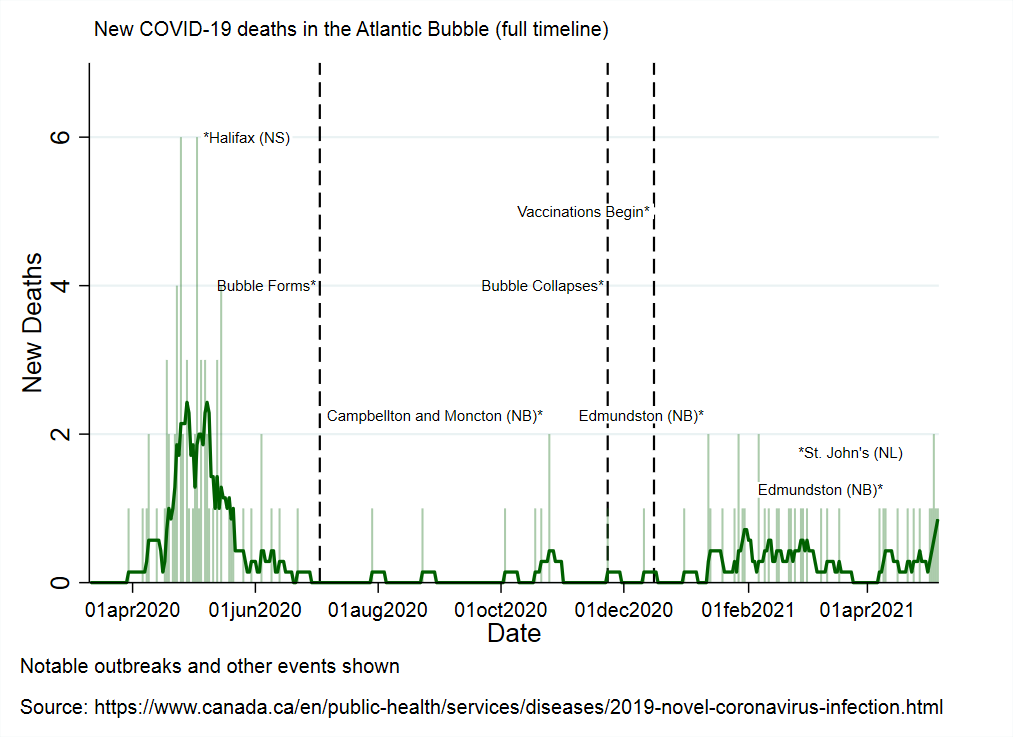
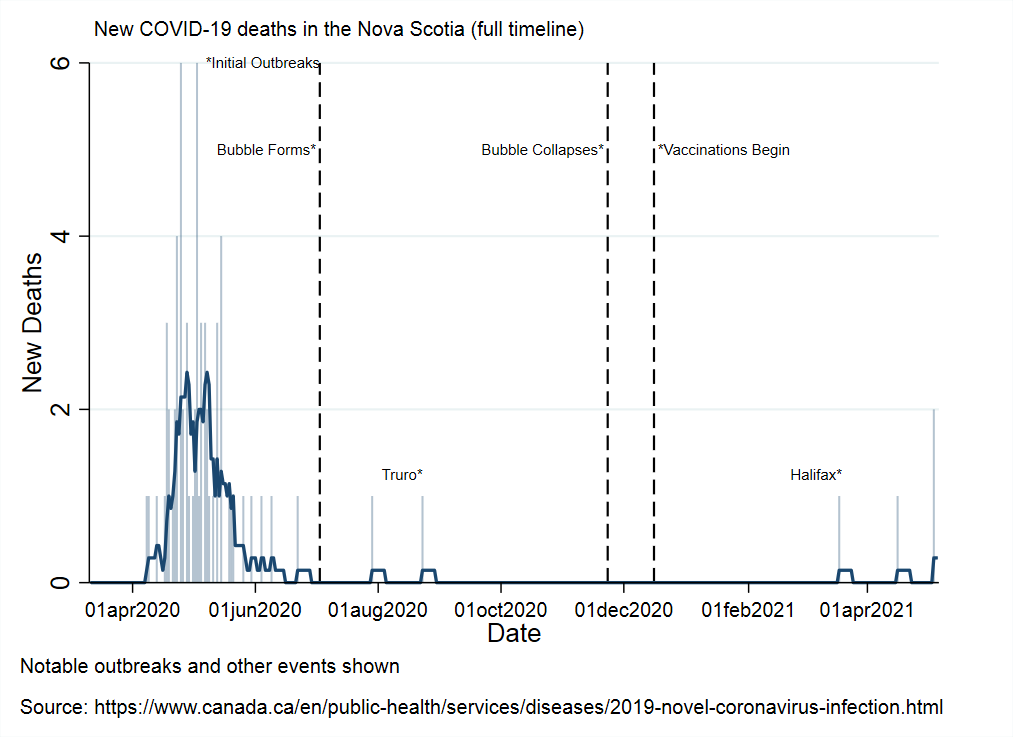
1 new death brings the regional death-toll to 115.
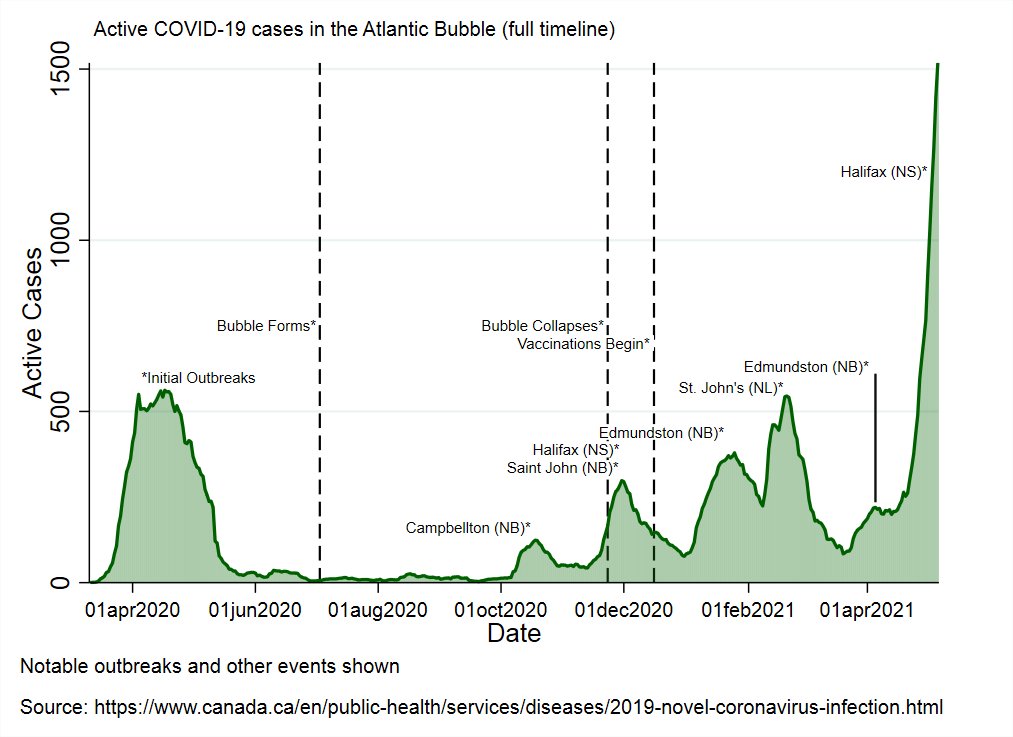
There are now 1518 known, active cases.
201 new cases were reported: 2 in PEI, 6 in Newfoundland and Labrador, 11 in New Brunswick, and 182 in Nova Scotia.
17/19 outside NS were traced.
1 new death brings the regional death-toll to 115.
There are now 1518 known, active cases.
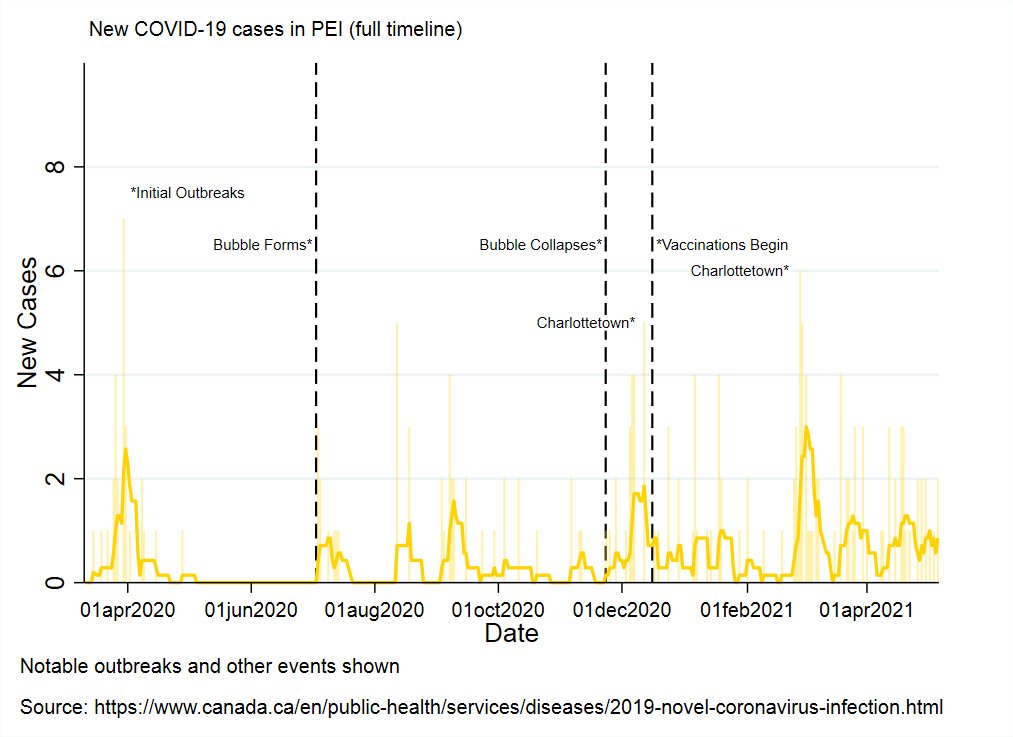
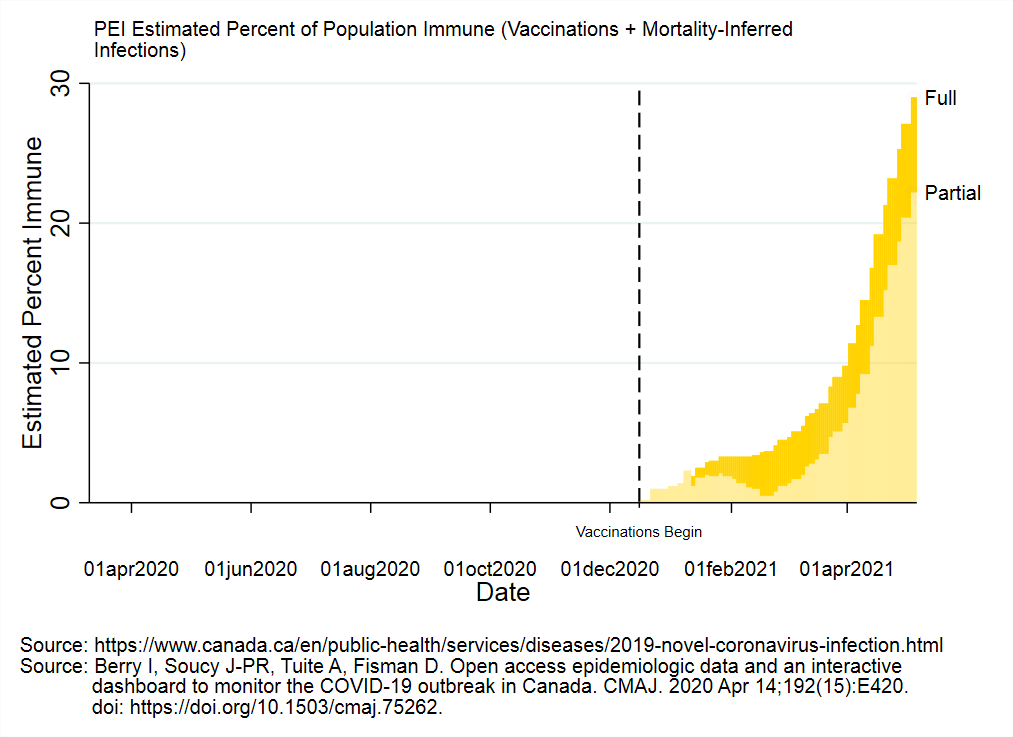
PEI reported 2 new cases today, both were travel-related.
There are now 9 known, active cases in PEI.
There are now 9 known, active cases in PEI.
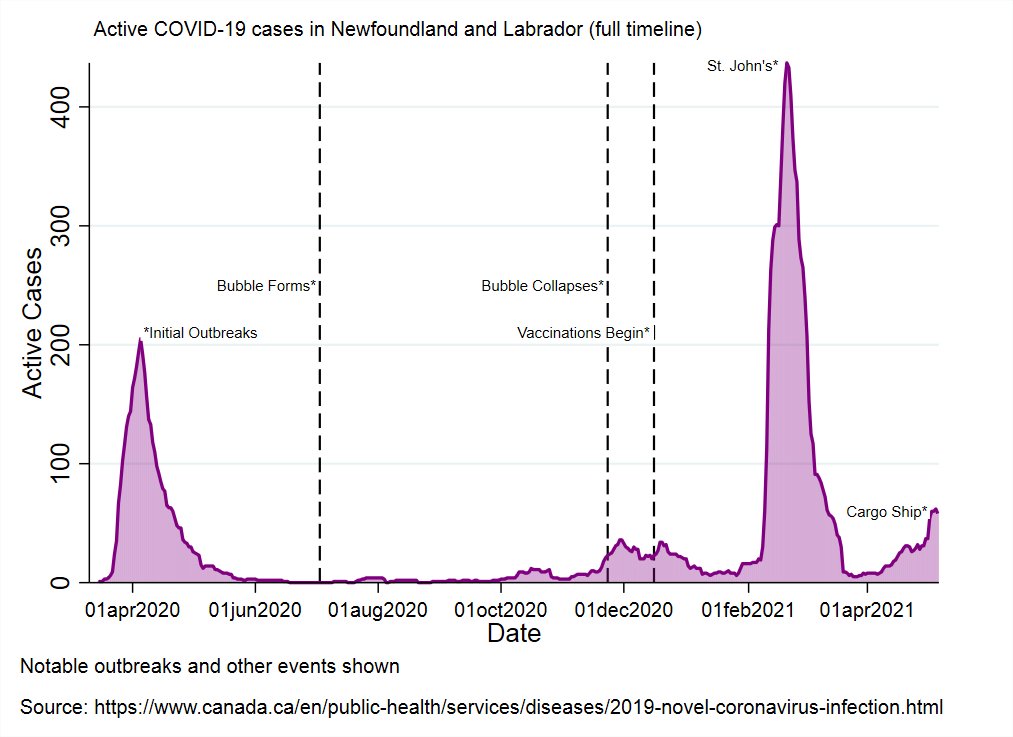
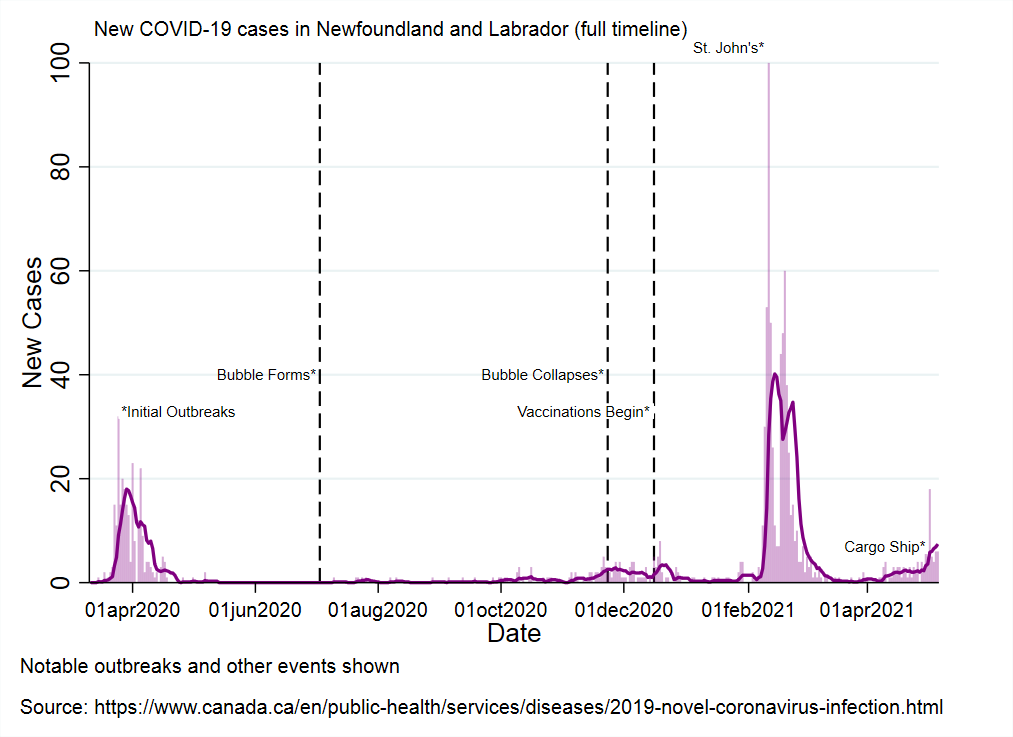
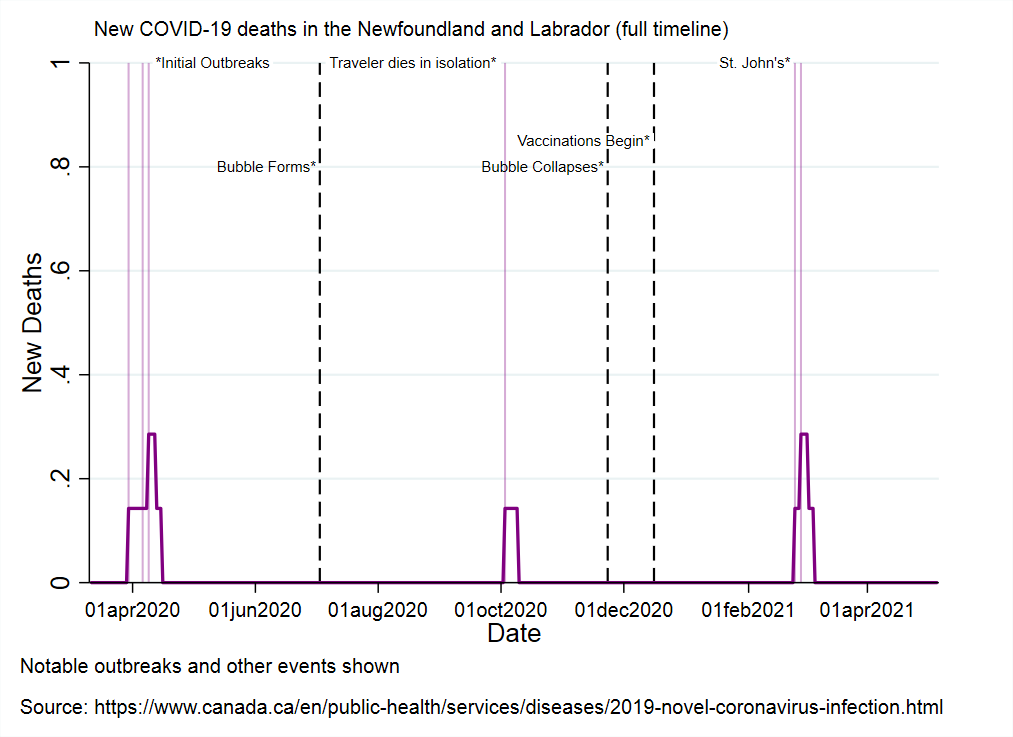
NL reported 6* new cases today:
1 new case each in the Western, Central, and Labrador-Grenfell health regions (all travel-related)
2 in the Eastern health region (1 travel and 1 close contact of an existing case).
*1 on the cargo boat in Conception Bay.
58 active cases
1 new case each in the Western, Central, and Labrador-Grenfell health regions (all travel-related)
2 in the Eastern health region (1 travel and 1 close contact of an existing case).
*1 on the cargo boat in Conception Bay.
58 active cases
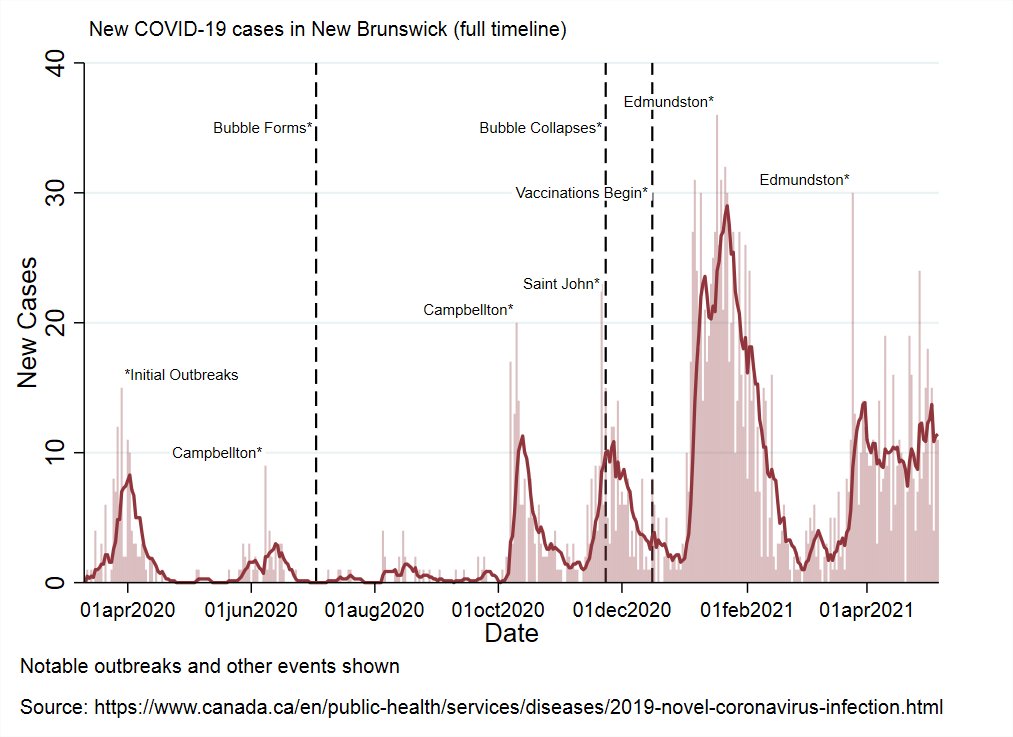
NB reported 11 new cases today:
2 in Saint John (1 travel-related, 1 under investigation)
1 each in Fredericton and Campbellton (both travel-related)
7 in Bathurst (travel-related)
10/11 are isolating out of province.
2 in Saint John (1 travel-related, 1 under investigation)
1 each in Fredericton and Campbellton (both travel-related)
7 in Bathurst (travel-related)
10/11 are isolating out of province.
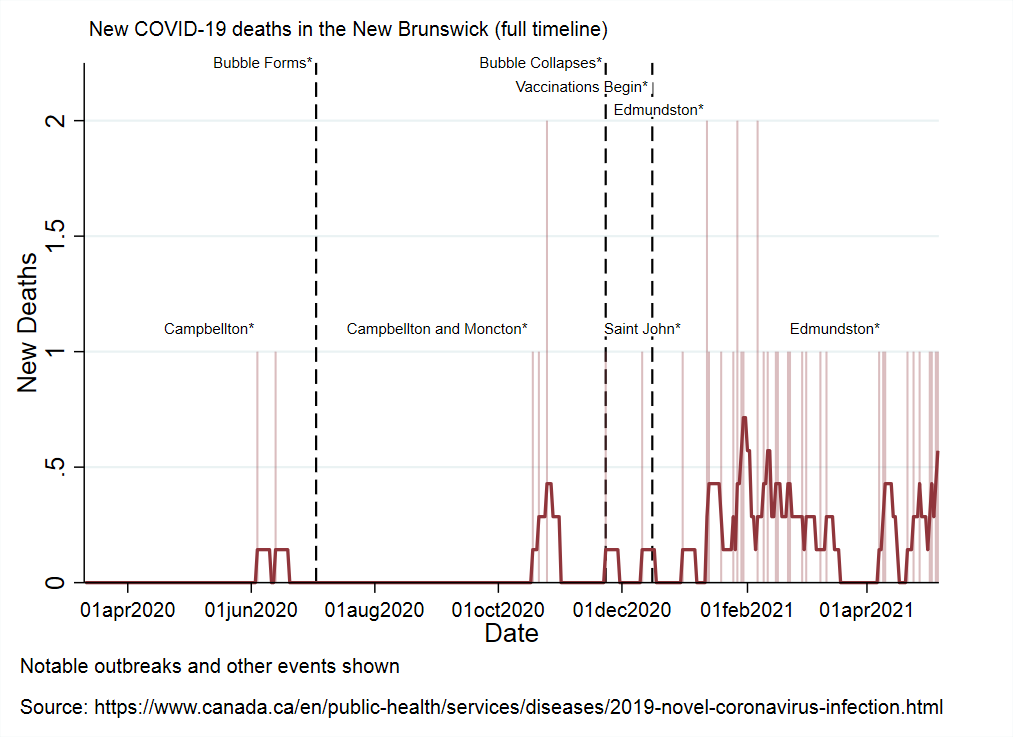
1 new death in Edmundston brings the provincial total to to 40.
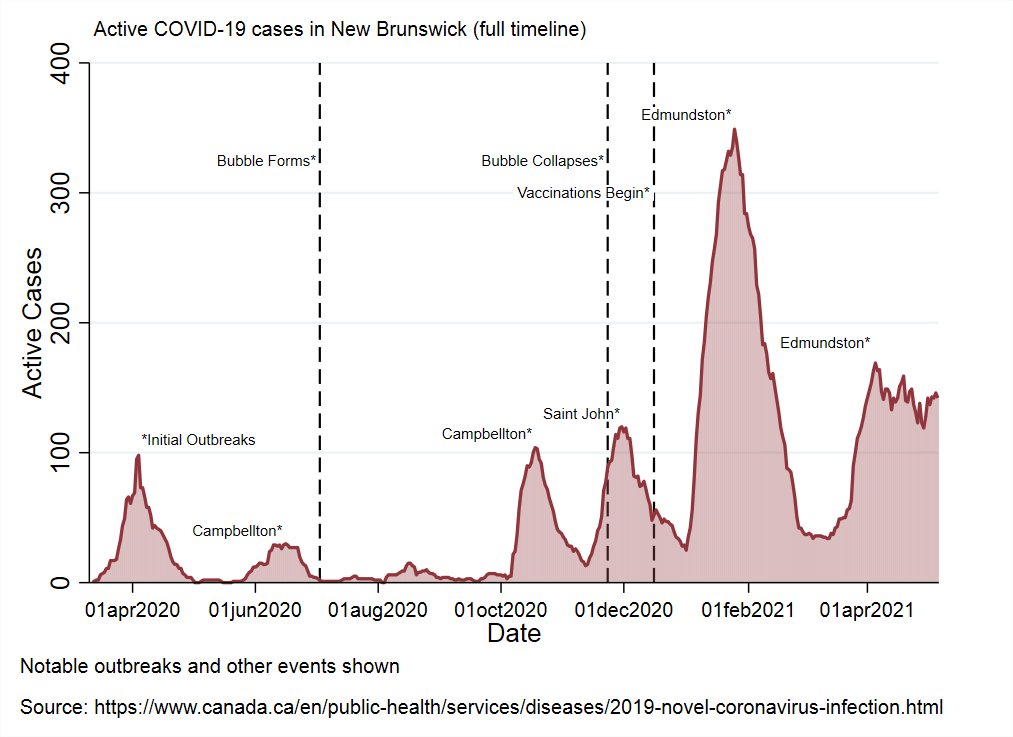
There are now 142 known, active cases in NB.
There are now 142 known, active cases in NB.
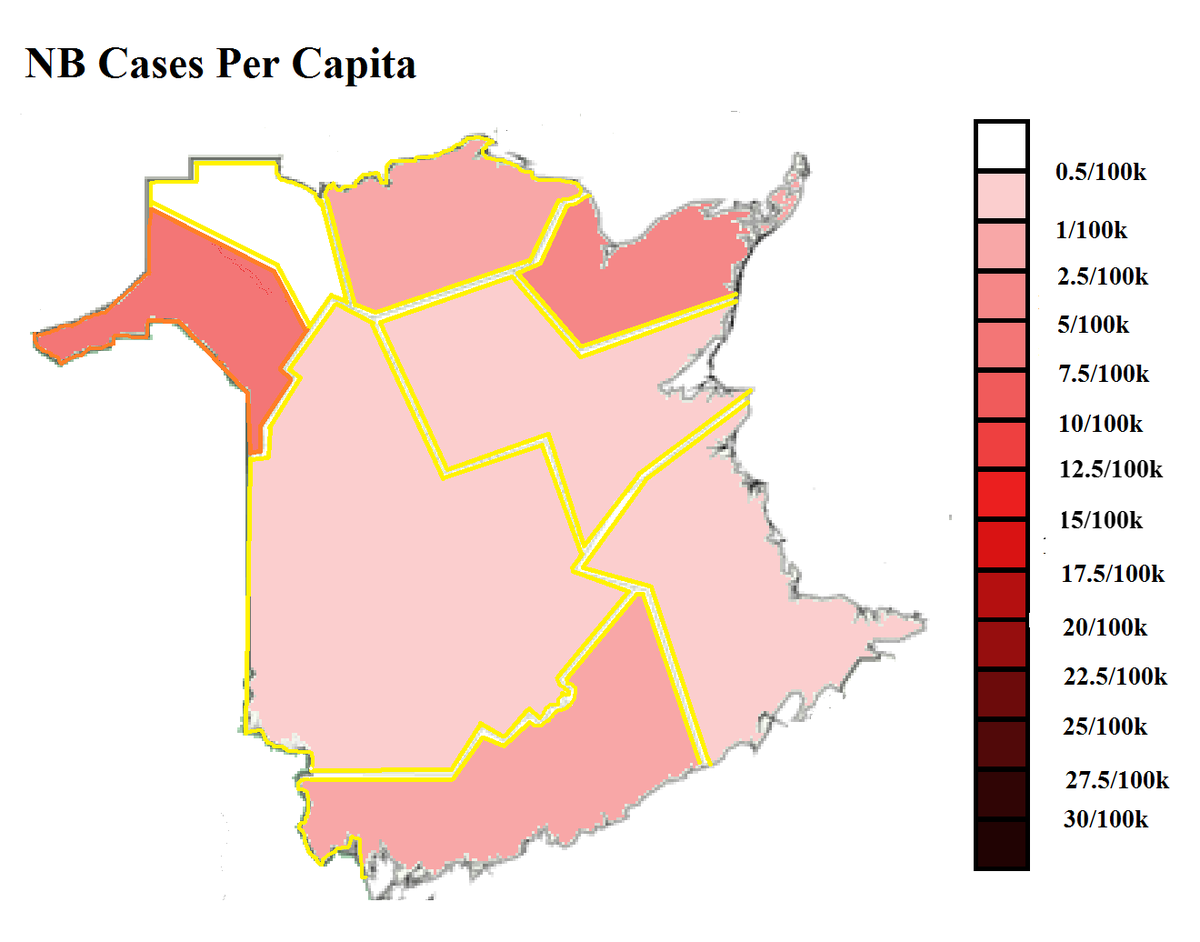
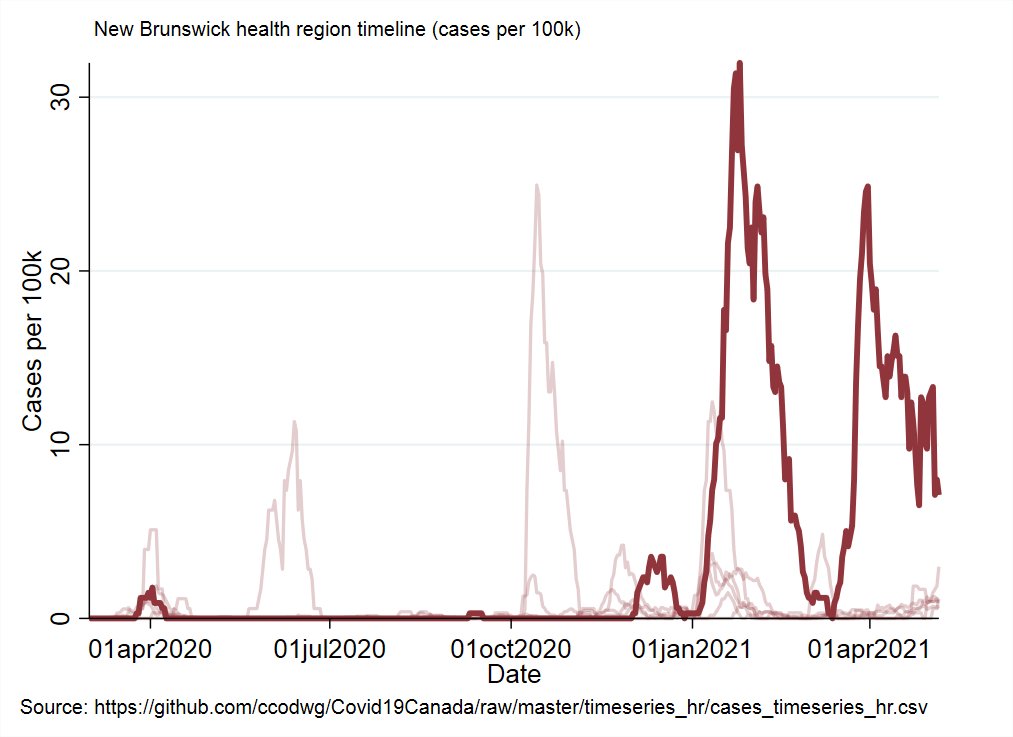
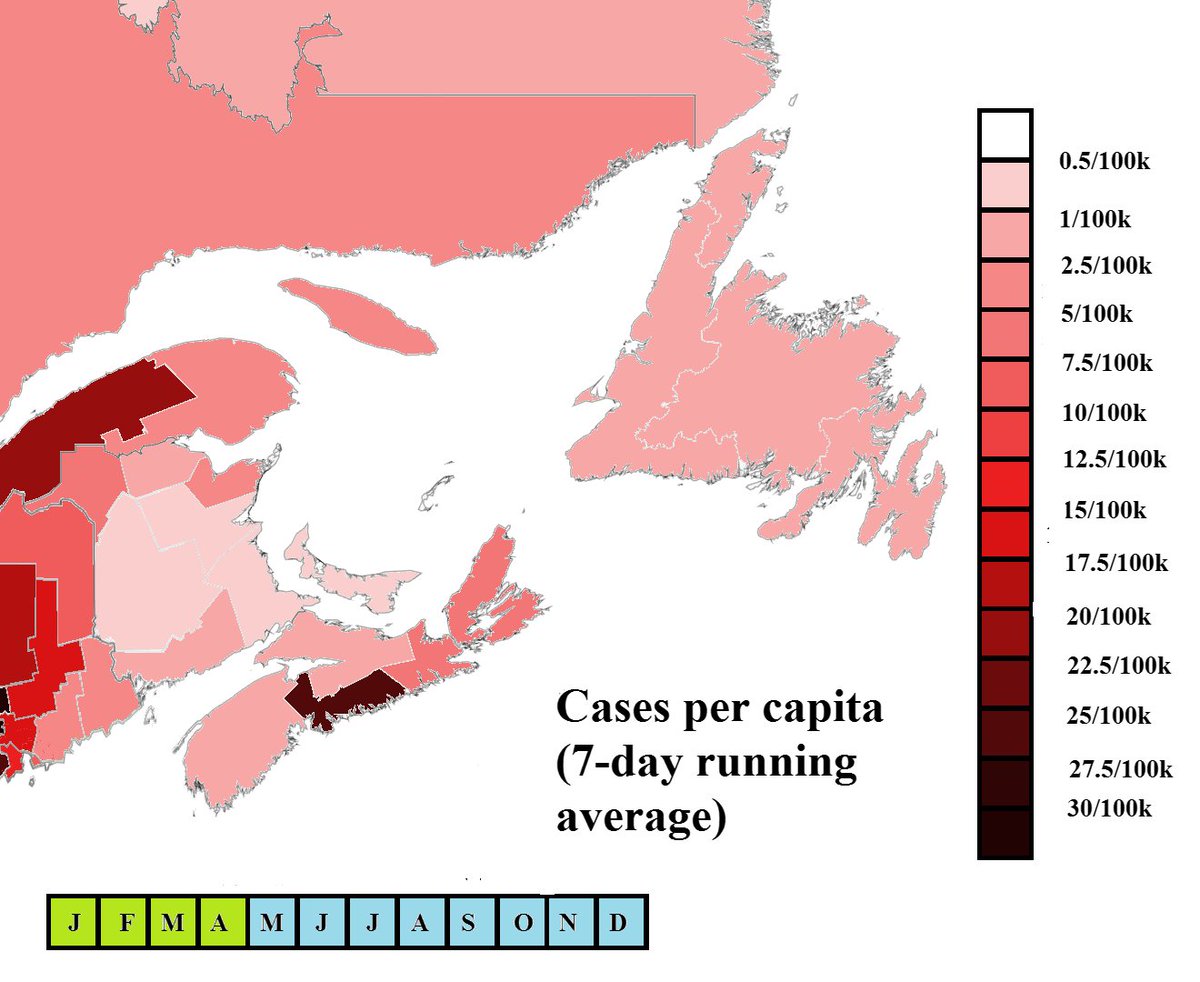
Updated restrictions/case levels map and cases per capita timeline with Edmundston emphasized.
Travel case levels aside, NB is doing really well. Contact tracing has been good. No obvious issues, currently.
Travel case levels aside, NB is doing really well. Contact tracing has been good. No obvious issues, currently.
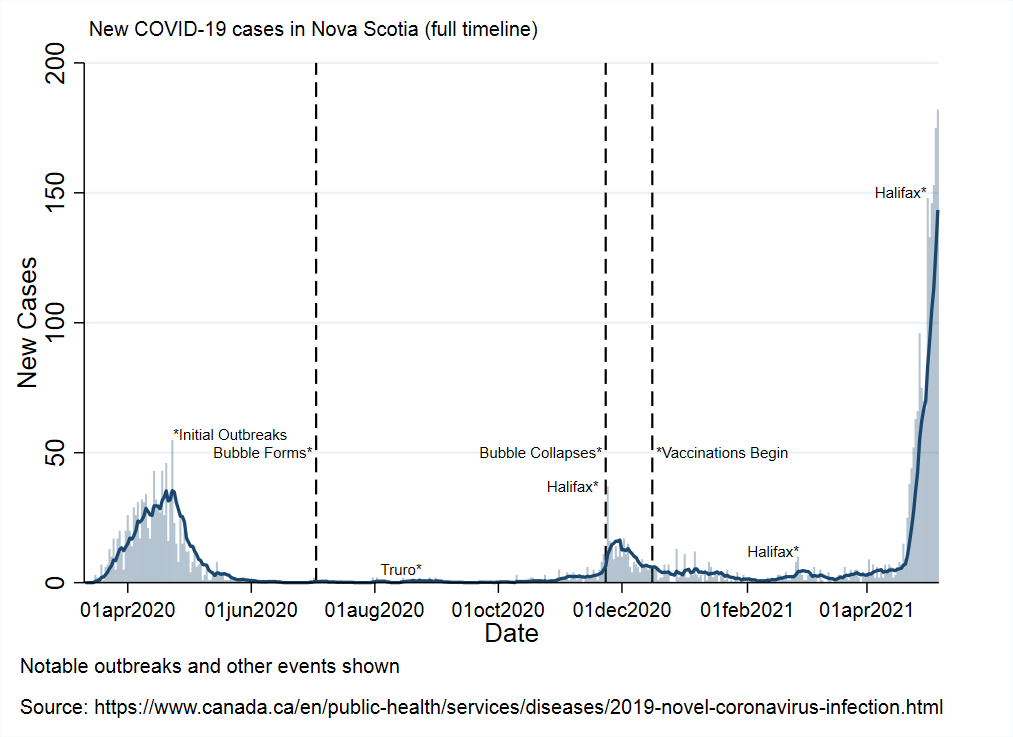
NS reported 182 new cases, another new record:
4 in the Western zone
7 in the Northern
16 in the Eastern
155 in Halifax (Central zone)
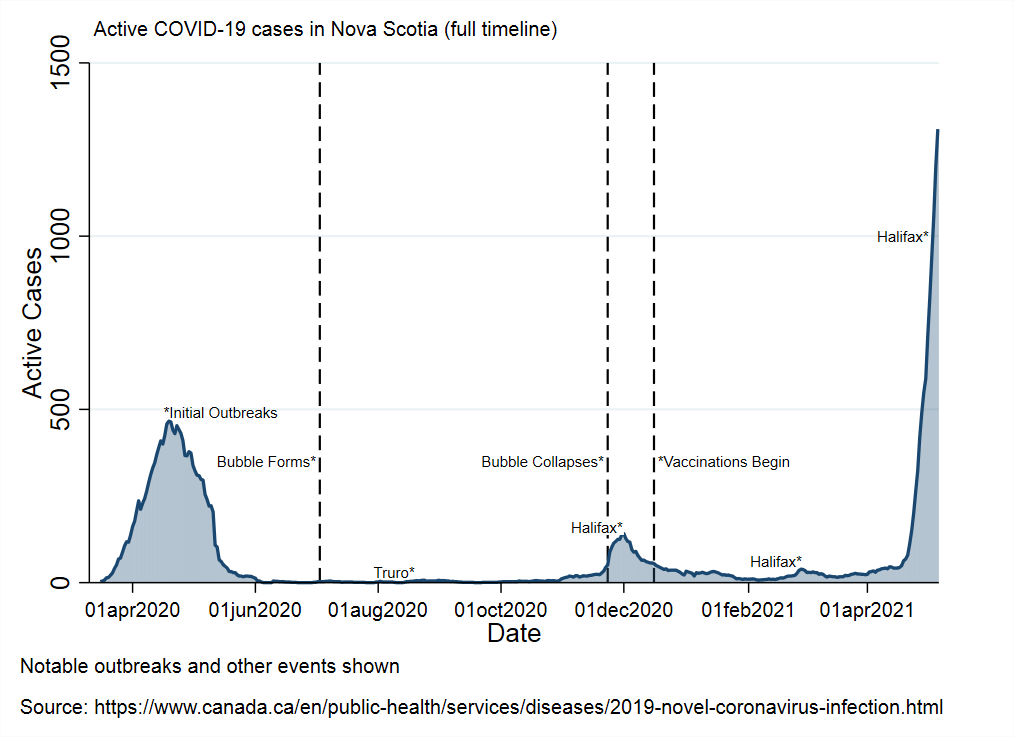
There are now 1309 known, active cases in NS (just under 40% of all cases ever detected in the province during the pandemic).
4 in the Western zone
7 in the Northern
16 in the Eastern
155 in Halifax (Central zone)
There are now 1309 known, active cases in NS (just under 40% of all cases ever detected in the province during the pandemic).
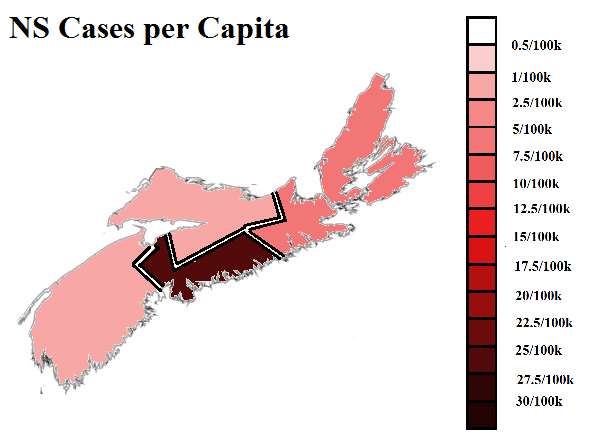
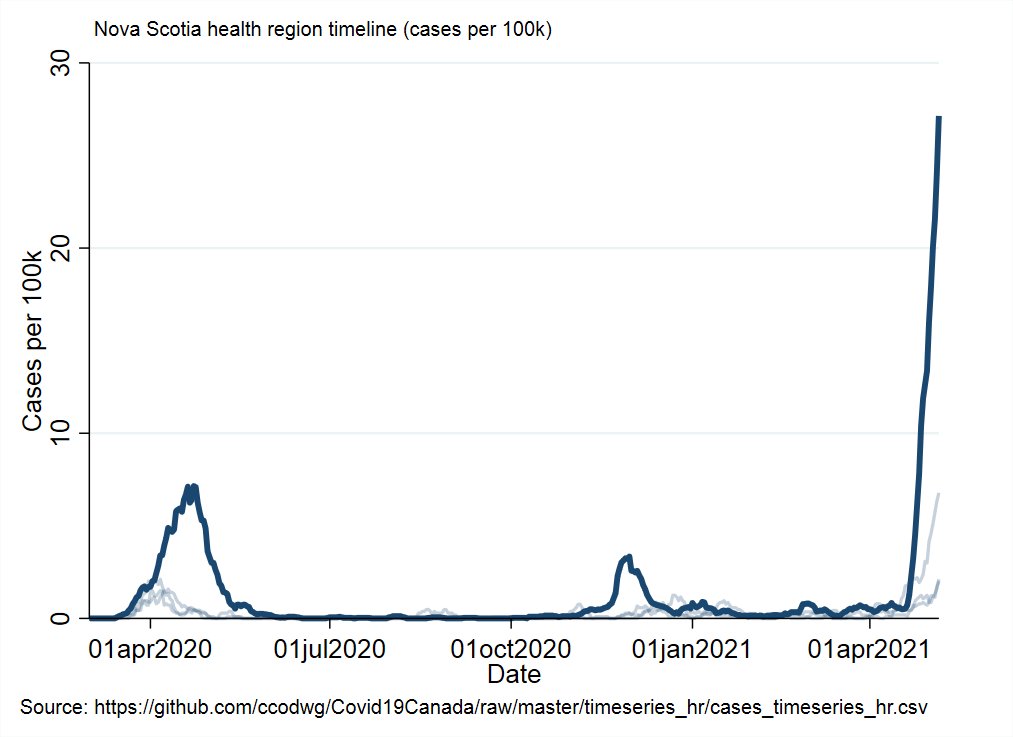
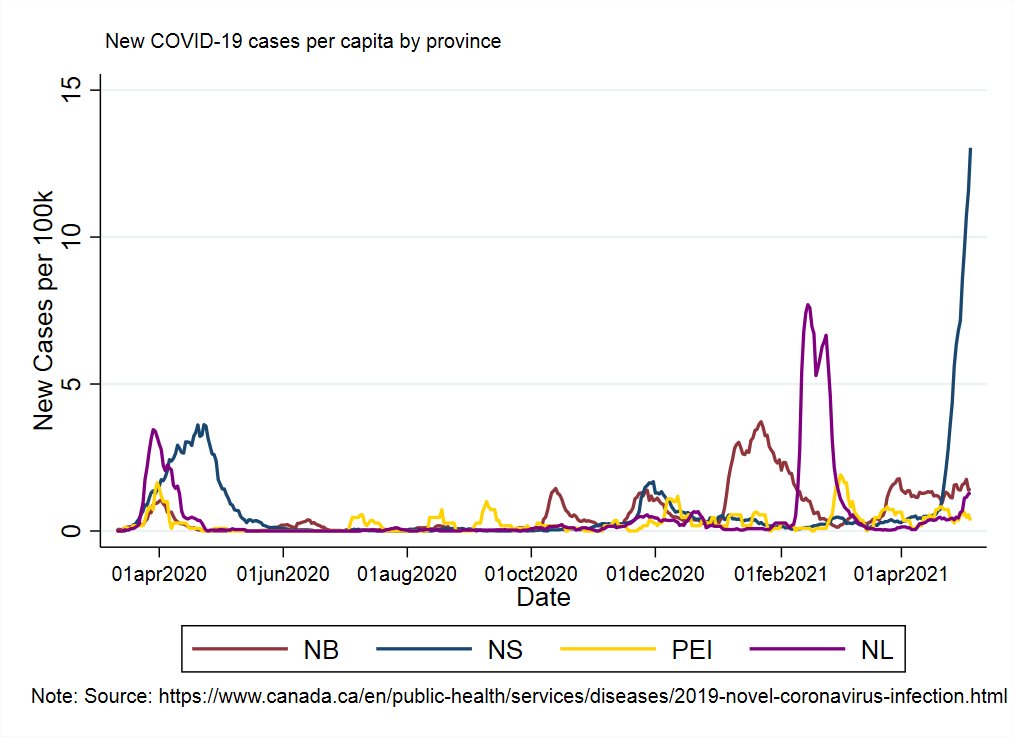
Updated restrictions/case levels map, case origins timeline, and cases per capita timeline with Halifax emphasized.
Province is still indicating that community transmission is limited to the Halifax area (I& #39;m suspicious about Eastern zone, but comparatively small currently)
Province is still indicating that community transmission is limited to the Halifax area (I& #39;m suspicious about Eastern zone, but comparatively small currently)
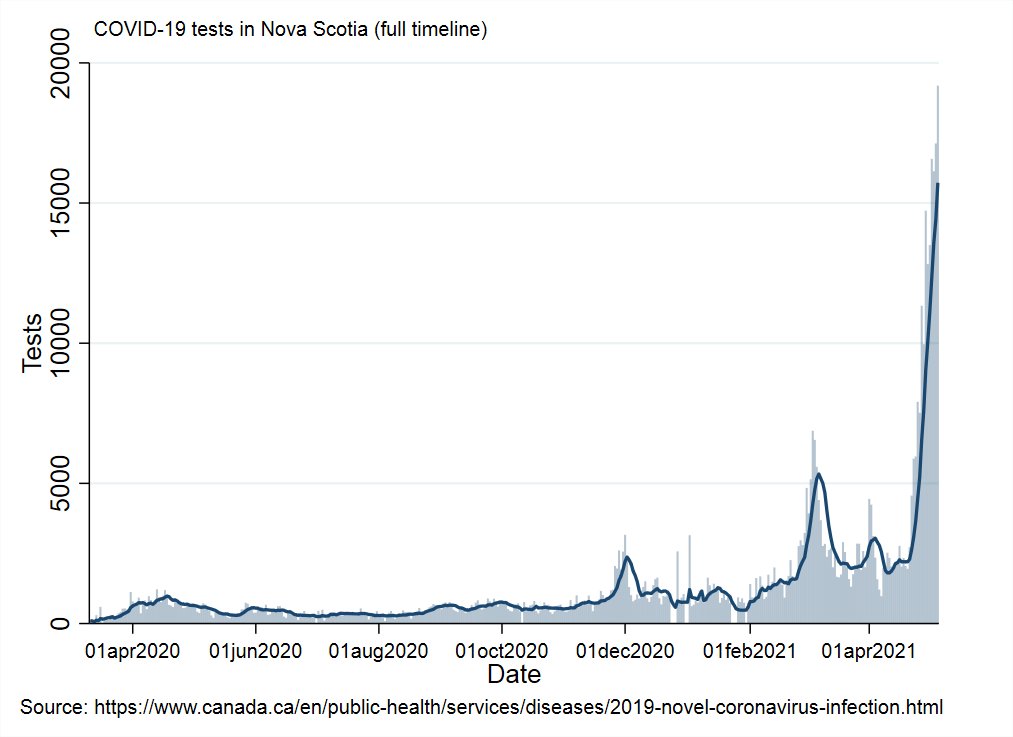
Updated NS testing numbers.
Positivity rate has crept up to 0.8%
Since no-exposure asymptomatic tests have shifted entirely out of the PCR appointment system to the pop-up rapid sites, we might see test numbers decline and positivity rates increase (only 7733 tests today).
Positivity rate has crept up to 0.8%
Since no-exposure asymptomatic tests have shifted entirely out of the PCR appointment system to the pop-up rapid sites, we might see test numbers decline and positivity rates increase (only 7733 tests today).
NS has cleared the testing backlog but apparently there is a data entry backlog. I& #39;m not clear how this would bias case reporting.
Due to this, it& #39;s hard describe the situation in NS as either improving or worsening. The best I have is "that& #39;s a lot of cases day after day"
Due to this, it& #39;s hard describe the situation in NS as either improving or worsening. The best I have is "that& #39;s a lot of cases day after day"
A lot of this likely still falls under the category of finding cases that already existed (vs new infections in the last several days).
Mass exposure sites are way down, because most of those sites are closed.
Mass exposure sites are way down, because most of those sites are closed.
At the next press conference, it would be helpful to have some questions about how contact tracing is going (Halifax vs the other zones). Has it changed more recently, and how (shift from mass exposure to households or workplaces).
It would be helpful to know more about the nature of the data entry backlog and how it& #39;s affecting case reporting (and when we can expect it to clear)
It would be helpful to know about the nature of increasing case numbers in the Eastern zone. Are they traced?
It would be helpful to know about the nature of increasing case numbers in the Eastern zone. Are they traced?
Less helpful:
Asking about fluctuations in vaccinations that were telegraphed weeks in advance.
Asking about unlikely events (no, the Bubble will not re-open next week).
Asking about specific variants at specific locations.
Please use the limited questions effectively.
Asking about fluctuations in vaccinations that were telegraphed weeks in advance.
Asking about unlikely events (no, the Bubble will not re-open next week).
Asking about specific variants at specific locations.
Please use the limited questions effectively.
Here is the current situation in the region.
Essentially everything outside of NS is traced and travel-related. Like, all of it.
Everything outside of Halifax is & #39;not community spread& #39; per the province.
Essentially everything outside of NS is traced and travel-related. Like, all of it.
Everything outside of Halifax is & #39;not community spread& #39; per the province.
You can see the entire pandemic timeline for the Atlantic region and surrounding area in the animation.
Each tick is a week since the start of the pandemic in March of last year.
Each tick is a week since the start of the pandemic in March of last year.
Provincial and Territorial Vaccine Roll-Out
Top of the ribbon is doses distributed, bottom is doses administered.
The higher the ribbon goes, the more people are being vaccinated. The wider it gets, the more doses sit unused.
National ribbon outlined in black.
Top of the ribbon is doses distributed, bottom is doses administered.
The higher the ribbon goes, the more people are being vaccinated. The wider it gets, the more doses sit unused.
National ribbon outlined in black.
Vaccine Roll-Out Metrics
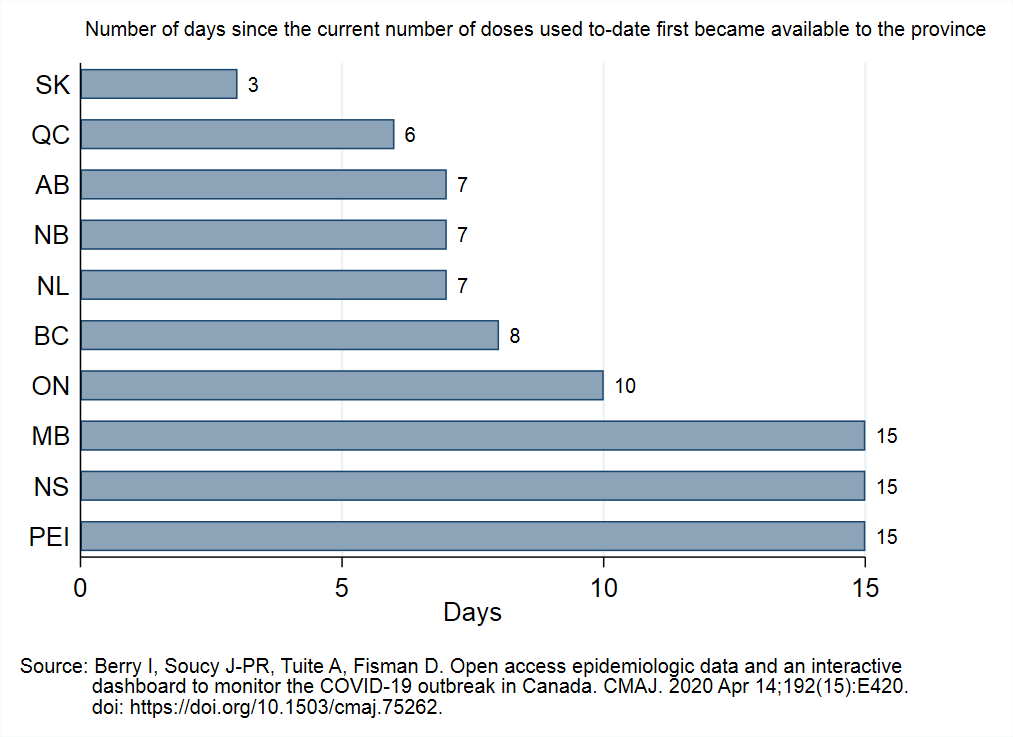
1st graph shows how many days since each province had enough doses to cover their current usage.
2nd graph shows percent of eligible population that is newly vaccinated each day
3rd graph shows days ahead/behind versus national average
1st graph shows how many days since each province had enough doses to cover their current usage.
2nd graph shows percent of eligible population that is newly vaccinated each day
3rd graph shows days ahead/behind versus national average
This animation shows each province& #39;s vaccination pace as a percent of the pace they need to each 80% first dose coverage by the end of June (based on how many they have already vaccinated and how much time is left).
Older data becomes less visible over time.
Older data becomes less visible over time.
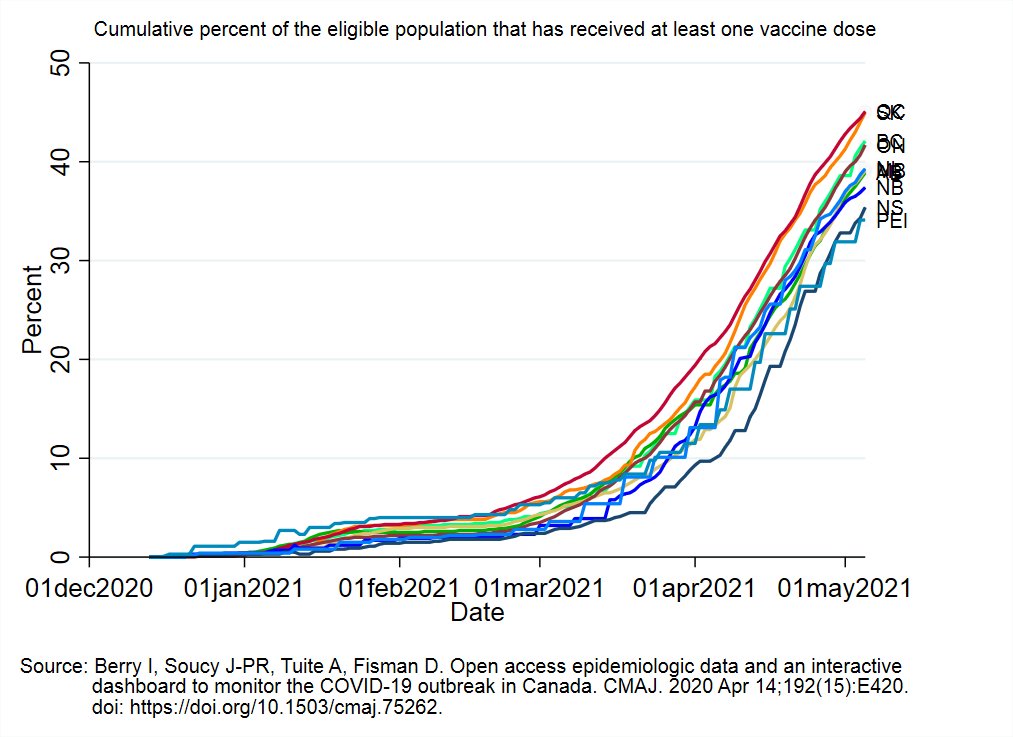
Here is the current percent of the eligible population of each province covered by at least one vaccine dose (Territories shown in the 2nd graph).
I haven& #39;t decided if I& #39;ll start including ages 12+ with the graphs. Will decide on the weekend.
I haven& #39;t decided if I& #39;ll start including ages 12+ with the graphs. Will decide on the weekend.
% eligible with at least one dose / % eligible that can get a first dose with what& #39;s in storage right now:
BC: 42.1%/8.6%
AB: 38.9%/2.2%
SK: 45.0%/3.4%
MB: 39.1%/5.9%
ON: 41.7%/8.3%
QC: 45.1%/7.4%
NB: 37.4%/4.7%
NS: 35.4%/6.4%
NL: 39.3%/4.6%
PEI: 34.1%/6.2%
BC: 42.1%/8.6%
AB: 38.9%/2.2%
SK: 45.0%/3.4%
MB: 39.1%/5.9%
ON: 41.7%/8.3%
QC: 45.1%/7.4%
NB: 37.4%/4.7%
NS: 35.4%/6.4%
NL: 39.3%/4.6%
PEI: 34.1%/6.2%
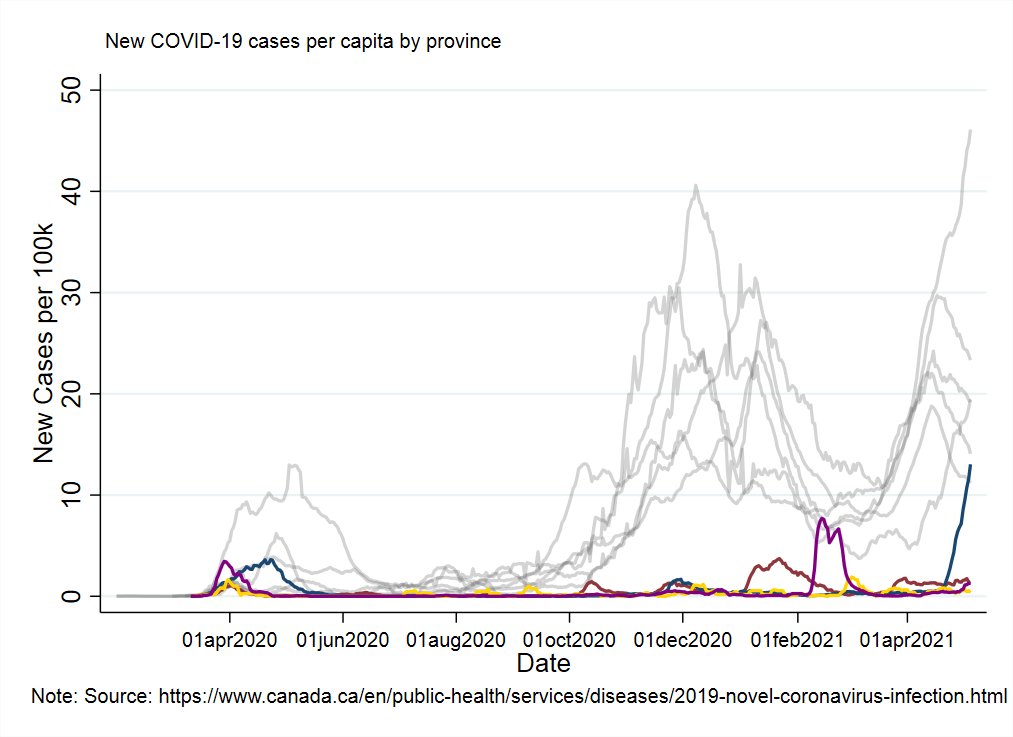
Nightly quick look at the rest of the country for context.
NS has now passed BC in addition to Quebec in new case rates (graph uses yesterday& #39;s numbers).
Next up is Saskatchewan.
NS has now passed BC in addition to Quebec in new case rates (graph uses yesterday& #39;s numbers).
Next up is Saskatchewan.
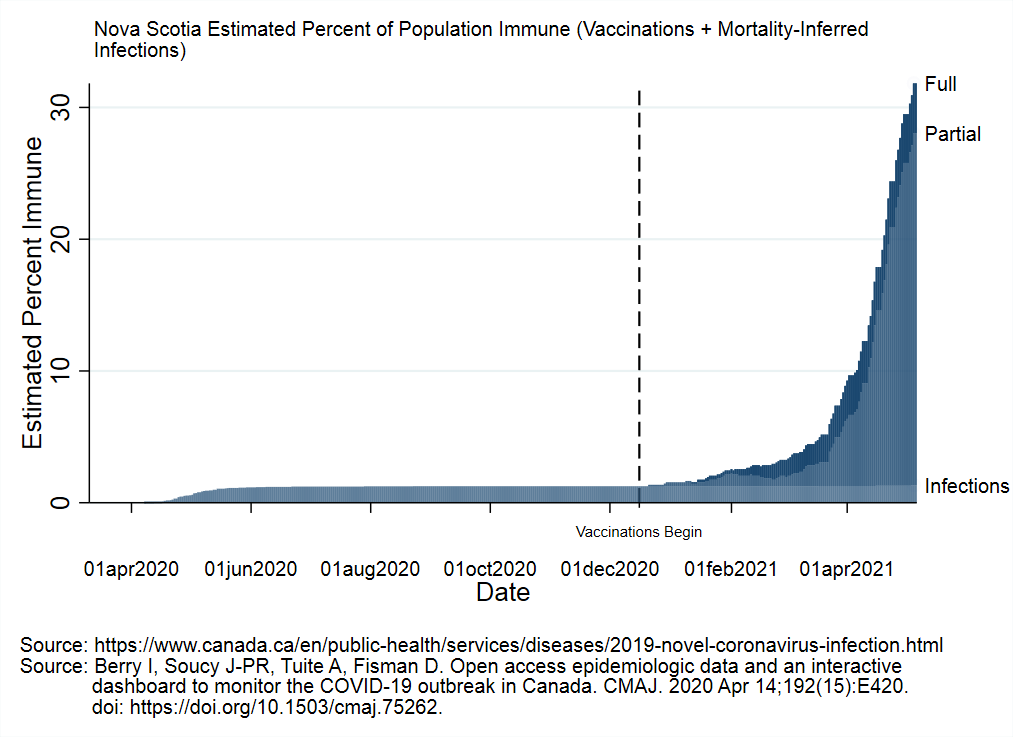
There is a record number of Nova Scotians in hospital from the pandemic at this time.
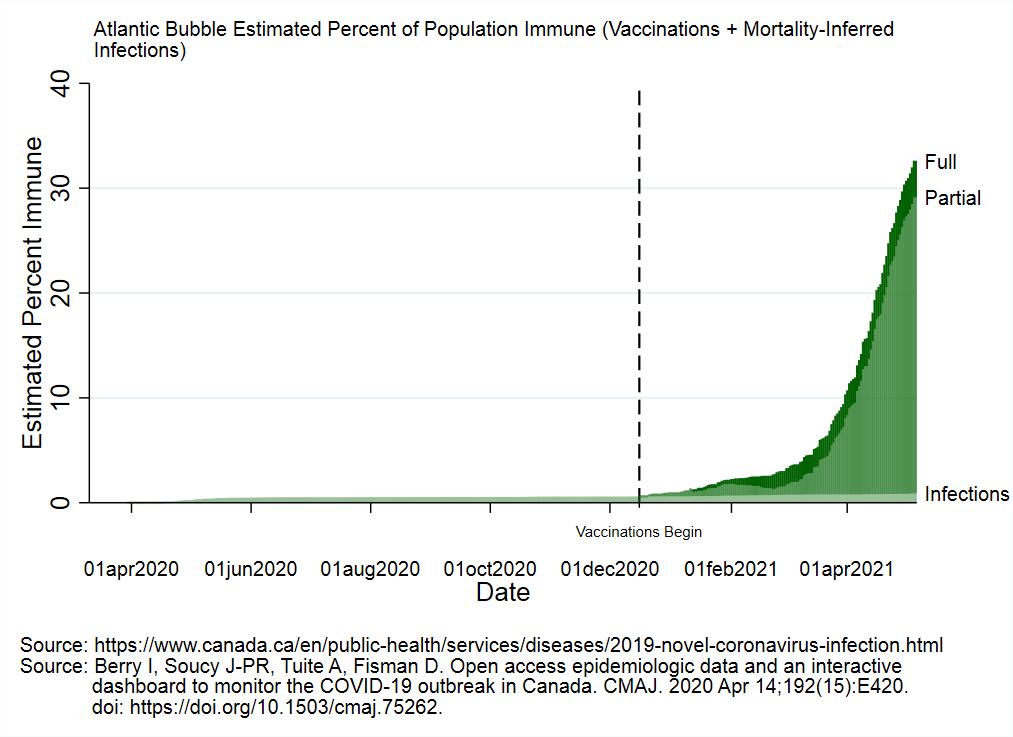
The vaccines rolled out so far will likely blunt the mortality/hospitalizations stemming from this wave by a lot.
But it can still get very bad. The hospitals can fill (see other provinces)
The vaccines rolled out so far will likely blunt the mortality/hospitalizations stemming from this wave by a lot.
But it can still get very bad. The hospitals can fill (see other provinces)
If you can avoid sharing an indoor space with people from other households, please do so.
Even if there& #39;s some carve-out or condition that lets you tick a box: and make it compliant with active restrictions: it is not a good idea.
Even if there& #39;s some carve-out or condition that lets you tick a box: and make it compliant with active restrictions: it is not a good idea.

 Read on Twitter