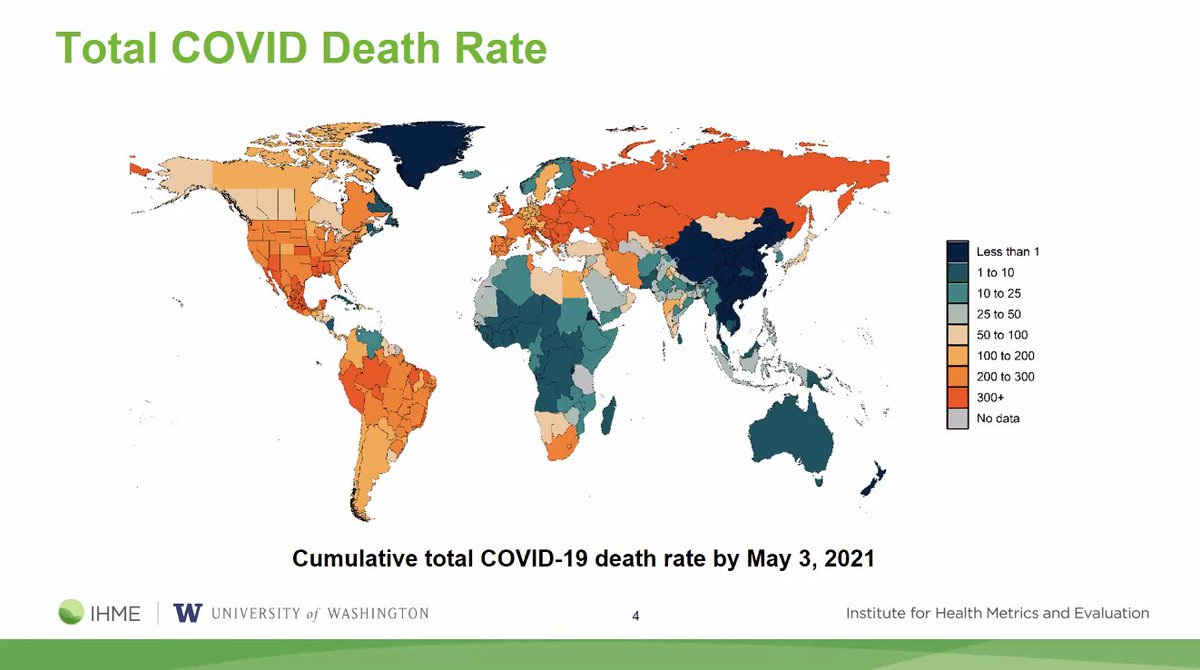
This morning, we& #39;re releasing a major change in our COVID-19 model ( https://abs.twimg.com/emoji/v2/... draggable="false" alt="➡️" title="Pfeil nach rechts" aria-label="Emoji: Pfeil nach rechts"> http://covid19.healthdata.org"> http://covid19.healthdata.org ). We& #39;re now incorporating excess mortality to approximate the total COVID-19 death rate worldwide.
Our understanding of the magnitude of COVID-19 to date has been much worse than what we have been thinking.  https://abs.twimg.com/emoji/v2/... draggable="false" alt="🗓️" title="Spiralkalenderblatt" aria-label="Emoji: Spiralkalenderblatt"> We are also extending our COVID-19 projections out to September 1, 2021 (they previously went out to August 1, 2021).
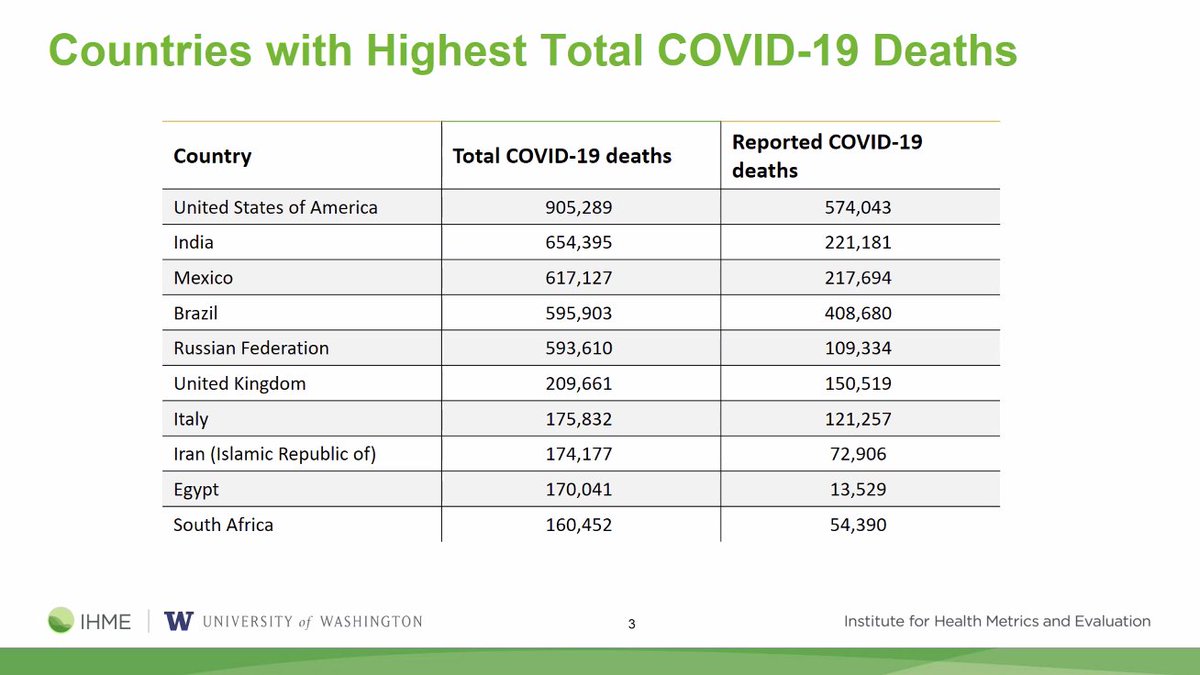
With this total COVID-19 mortality adjustment, these are the countries that we estimate currently have the highest total COVID-19 deaths .vs. reported COVID-19 deaths:
What kind of statistical methods are we using to calculate total COVID-19 mortality? Dr. Murray explains:
Reported COVID-19 mortality is strongly related to how much testing a country has done. So total COVID-19 mortality includes predicted ratios, and we& #39;ve used these kinds of statistical methods in our annual #GBDstudy.
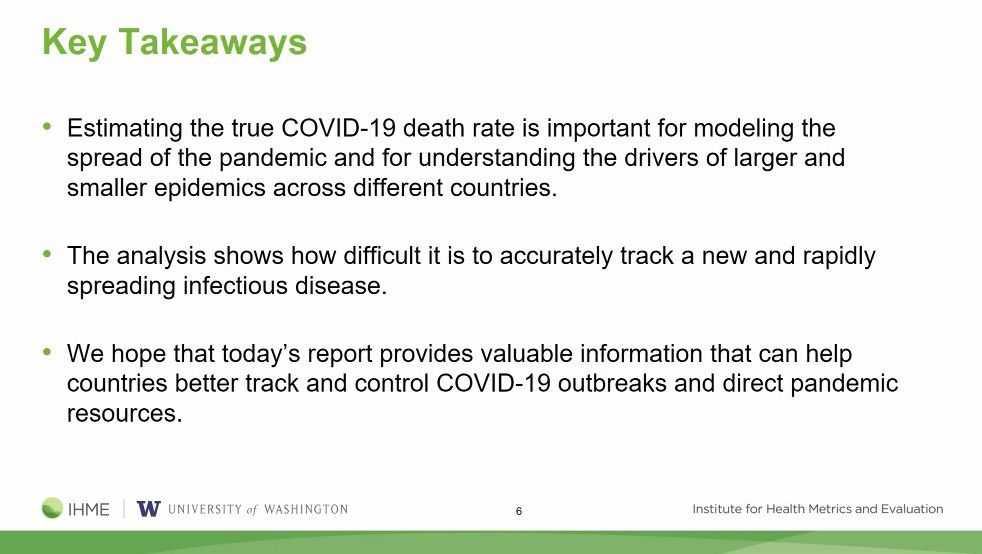
Key takeaways on our new modeling approach outlined below.  https://abs.twimg.com/emoji/v2/... draggable="false" alt="📺" title="Fernsehen" aria-label="Emoji: Fernsehen"> To watch the full video of Dr. Murray discussing total COVID-19 mortality, visit: https://bit.ly/IHME-Episodes ">https://bit.ly/IHME-Epis...
Our press release on this major update to our modeling methods  https://abs.twimg.com/emoji/v2/... draggable="false" alt="⬇️" title="Pfeil nach unten" aria-label="Emoji: Pfeil nach unten"> https://www.healthdata.org/news-release/covid-19-has-caused-69-million-deaths-globally-more-double-what-official-reports-show">https://www.healthdata.org/news-rele...
Detailed description of our new excess mortality methods  https://abs.twimg.com/emoji/v2/... draggable="false" alt="⬇️" title="Pfeil nach unten" aria-label="Emoji: Pfeil nach unten"> http://www.healthdata.org/special-analysis/estimation-excess-mortality-due-covid-19-and-scalars-reported-covid-19-deaths">https://www.healthdata.org/special-a...

 Read on Twitter

 To watch the full video of Dr. Murray discussing total COVID-19 mortality, visit: https://bit.ly/IHME-Epis..." title="Key takeaways on our new modeling approach outlined below. https://abs.twimg.com/emoji/v2/... draggable="false" alt="📺" title="Fernsehen" aria-label="Emoji: Fernsehen"> To watch the full video of Dr. Murray discussing total COVID-19 mortality, visit: https://bit.ly/IHME-Epis..." class="img-responsive" style="max-width:100%;"/>


