
 Read on Twitter
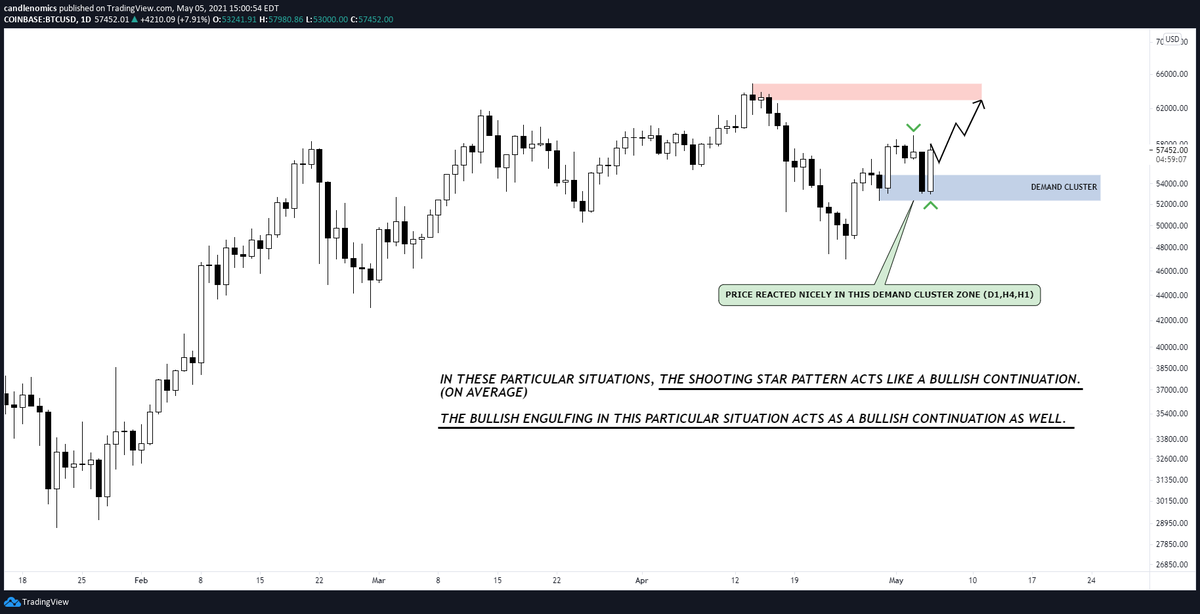
statistically, in these particular situations, both the shooting star and engulfing pattern have led to higher prices. that and the bullish reaction in the demand cluster has flipped my bias to bullish (for the next few days) for #BTC  https://abs.twimg.com/hashflags... draggable="false" alt="">
 " title="statistically, in these particular situations, both the shooting star and engulfing pattern have led to higher prices. that and the bullish reaction in the demand cluster has flipped my bias to bullish (for the next few days) for #BTC https://abs.twimg.com/hashflags... draggable="false" alt="">" class="img-responsive" style="max-width:100%;"/>
because of my HTF bullish bias, i don& #39;t think the resistance cluster (red box) will hold. i will bid any pull backs into the LONG1 and LONG2 areas denoted on the chart. target is the daily supply above
 will hold. i will bid any pull backs into the LONG1 and LONG2 areas denoted on the chart. target is the daily supply above")
this front running of a level has me a bit worried. i& #39;ve seen this PA break a level HARD one too many times. my orders hasn& #39;t been filled yet, so i& #39;m reducing my size by half just in case. if the original plan works out, great. i& #39;ll just add more a the LONG 2 area.

daily bias is still bullish (near term). just LTF price action is making me a bit cautious with my entry
There’s that hard break I was talking about. Order is finally filled, but let’s hope for my stop losses sake it’s only a short lived deviation

stopped out. thankfully i reduced risk by 50%. so far the daily analyses have been spot on, but my LTF executions have been off. might need to do some journaling and dissect the issues

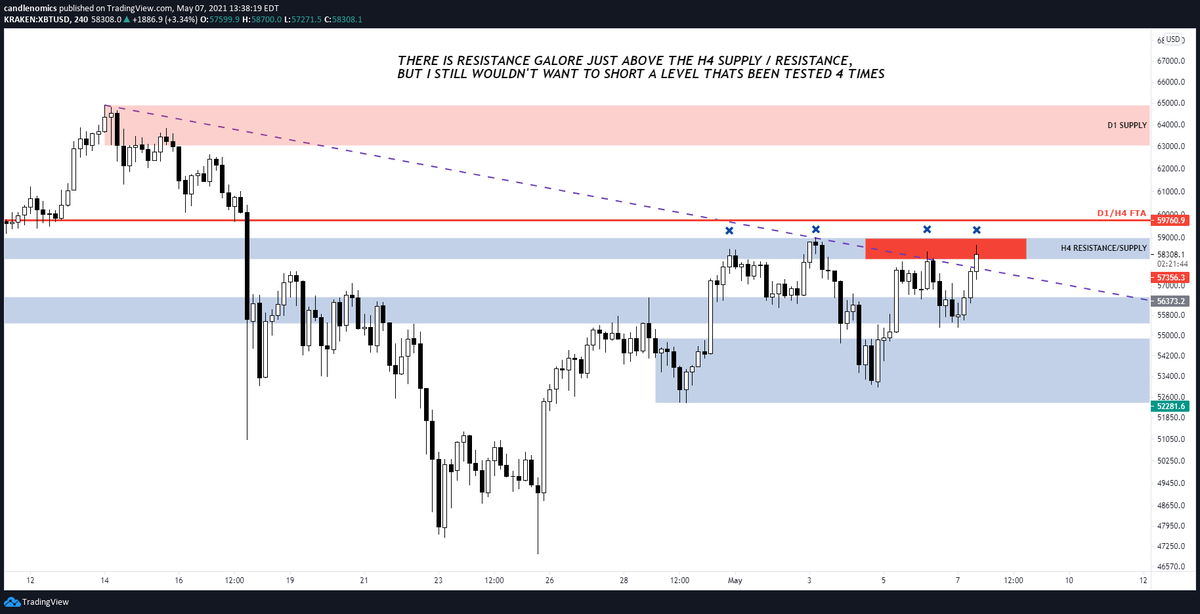
H1 closed above the trend line, and we& #39;re testing supply/resistance for the 4th time now (gobbling up sell orders) - i think we break upward soon. theres a ton of resistance above, but i think we& #39;ll continue higher towards the D1 supply #BTC https://abs.twimg.com/hashflags... draggable="false" alt=""> LONG 2 bids still in play for me
 LONG 2 bids still in play for me" title="H1 closed above the trend line, and we& #39;re testing supply/resistance for the 4th time now (gobbling up sell orders) - i think we break upward soon. theres a ton of resistance above, but i think we& #39;ll continue higher towards the D1 supply #BTC https://abs.twimg.com/hashflags... draggable="false" alt=""> LONG 2 bids still in play for me" class="img-responsive" style="max-width:100%;"/>
the fomosapien in me just deviated from my plan and market bought https://abs.twimg.com/emoji/v2/... draggable="false" alt="🐒" title="Affe" aria-label="Emoji: Affe">
oof. that H4 doesn& #39;t look good. this is why you have to tame the inner fomosapien
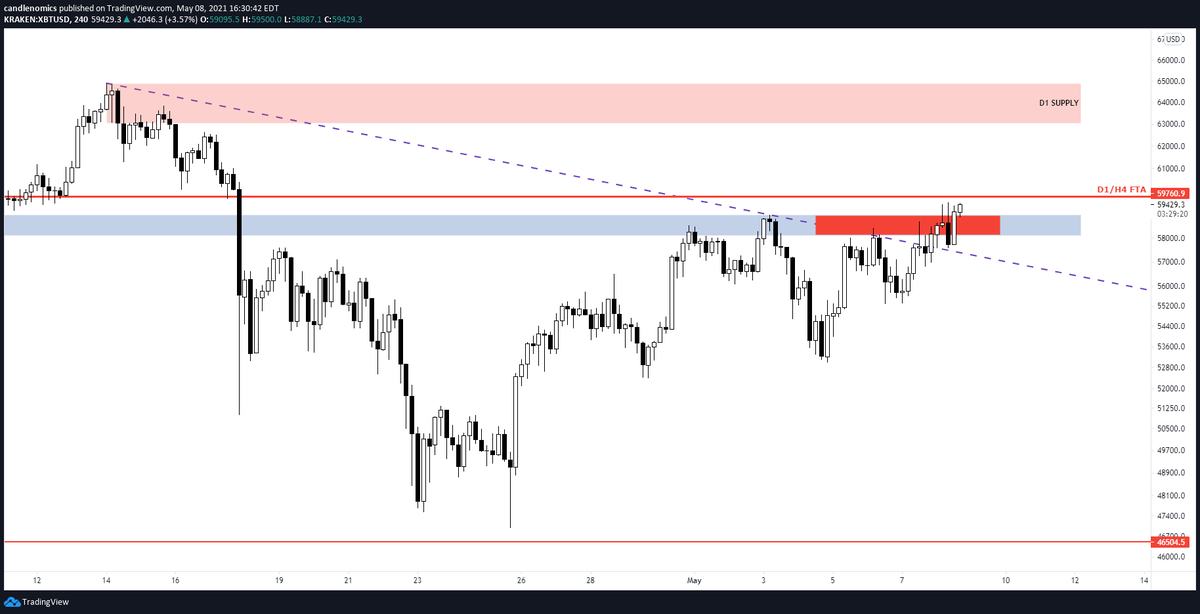
was a tad bit bumpy, but looks like we& #39;re finally clearing that H4 resistance/supply zone. bulls will be tested again shortly with the H4/D1 first trouble area approaching. #BTC https://abs.twimg.com/hashflags... draggable="false" alt="">
 " title="was a tad bit bumpy, but looks like we& #39;re finally clearing that H4 resistance/supply zone. bulls will be tested again shortly with the H4/D1 first trouble area approaching. #BTC https://abs.twimg.com/hashflags... draggable="false" alt="">" class="img-responsive" style="max-width:100%;"/>
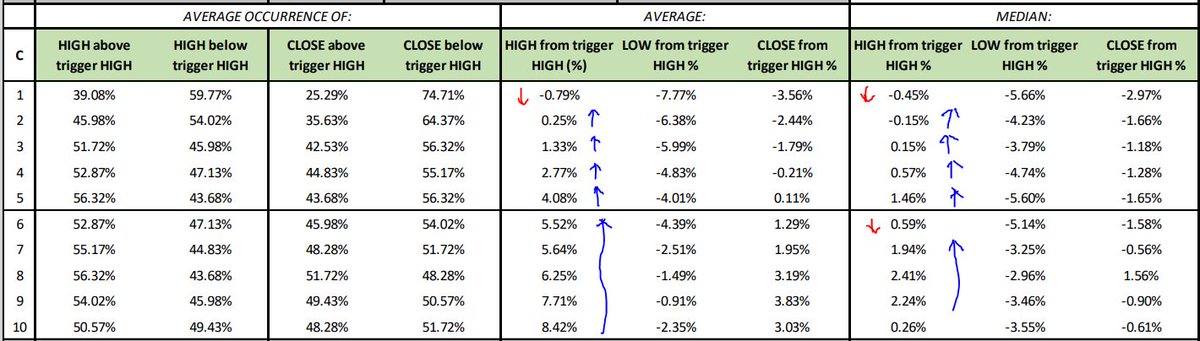
still amazes me how well these statistics hold up. just look at the very 1st chart in this thread. right on cue, price makes a LH on the 6th day (for now). the lows stats dont interest me as much bc we& #39;re focused on the upside. good news is, statistically we go up from here #BTC https://abs.twimg.com/hashflags... draggable="false" alt="">
 " title="still amazes me how well these statistics hold up. just look at the very 1st chart in this thread. right on cue, price makes a LH on the 6th day (for now). the lows stats dont interest me as much bc we& #39;re focused on the upside. good news is, statistically we go up from here #BTC https://abs.twimg.com/hashflags... draggable="false" alt="">" class="img-responsive" style="max-width:100%;"/>


