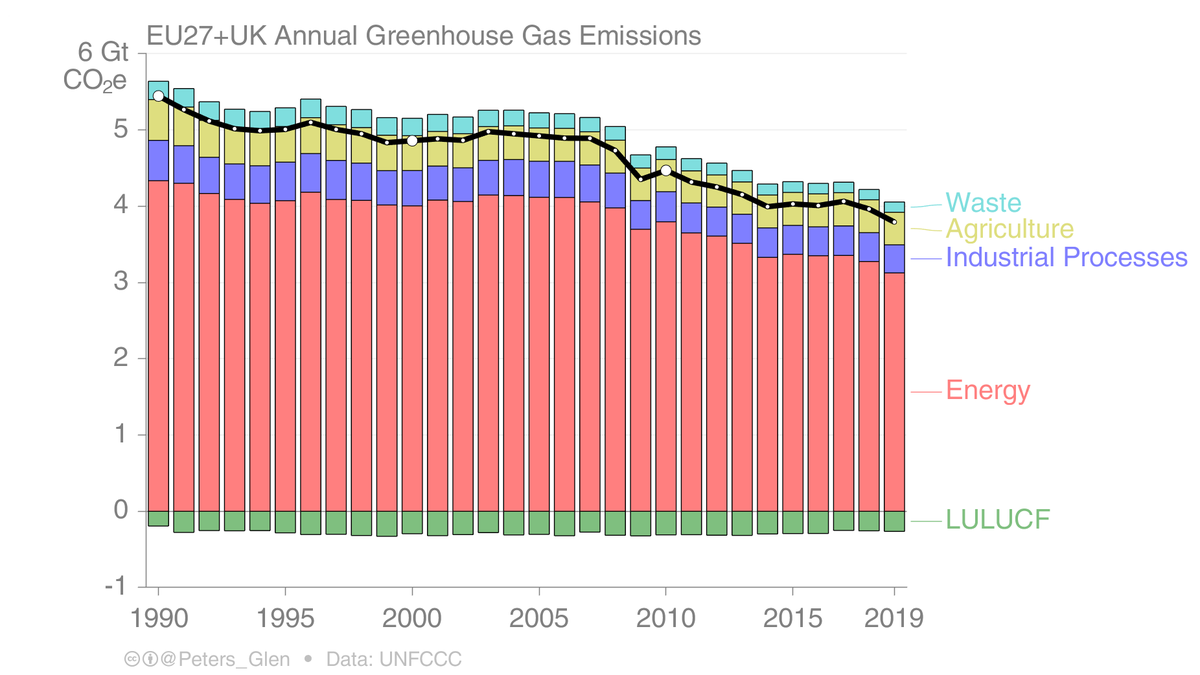
EU27+UK GHG emissions (including LULUCF) have declined 30% from 1990 to 2019.
By changes by sector were:
* Energy: -28%
* Industry: -30%
* Agriculture: -20%
* Waste: -44%
* LULUCF: +37% (stronger sink)
1/
By changes by sector were:
* Energy: -28%
* Industry: -30%
* Agriculture: -20%
* Waste: -44%
* LULUCF: +37% (stronger sink)
1/
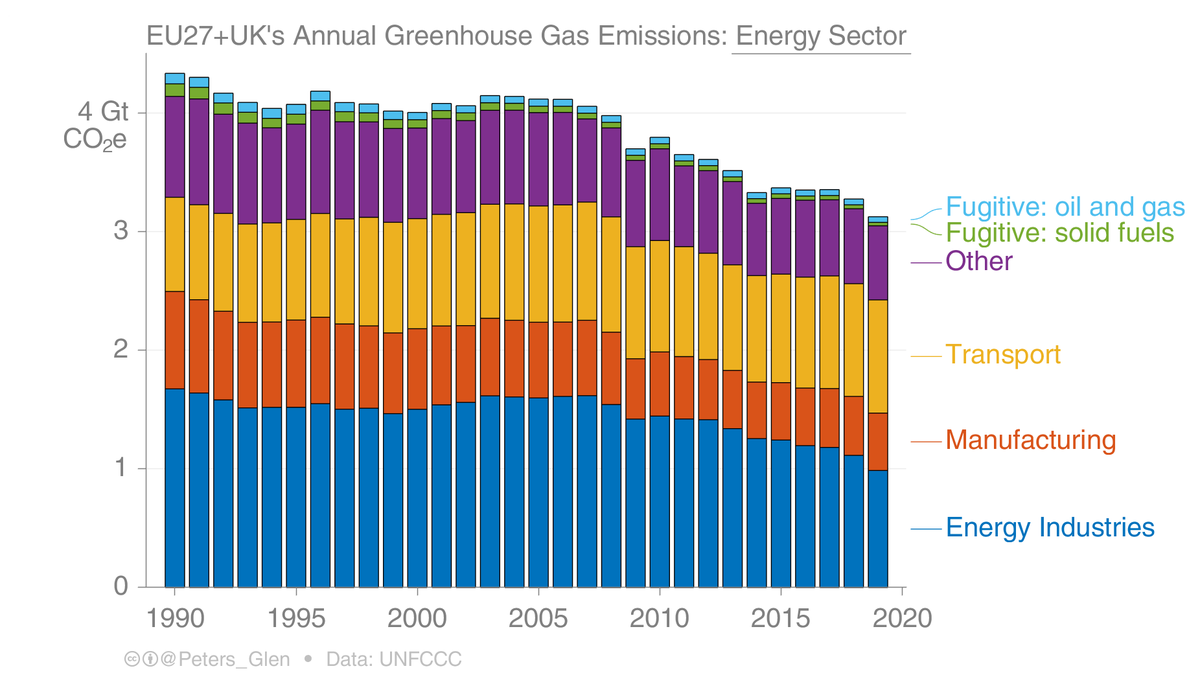
The energy sector is the largest in terms of GHG emissions.
The changes from 1990 to 2019 were:
* Energy industries: -41%
* Manufacturing: -41%
* Transport: +20%
* Other (buildings, etc): -27%
* Fugitive: solid -73%, oil/gas -46%
Transport is a problem...
2/
The changes from 1990 to 2019 were:
* Energy industries: -41%
* Manufacturing: -41%
* Transport: +20%
* Other (buildings, etc): -27%
* Fugitive: solid -73%, oil/gas -46%
Transport is a problem...
2/
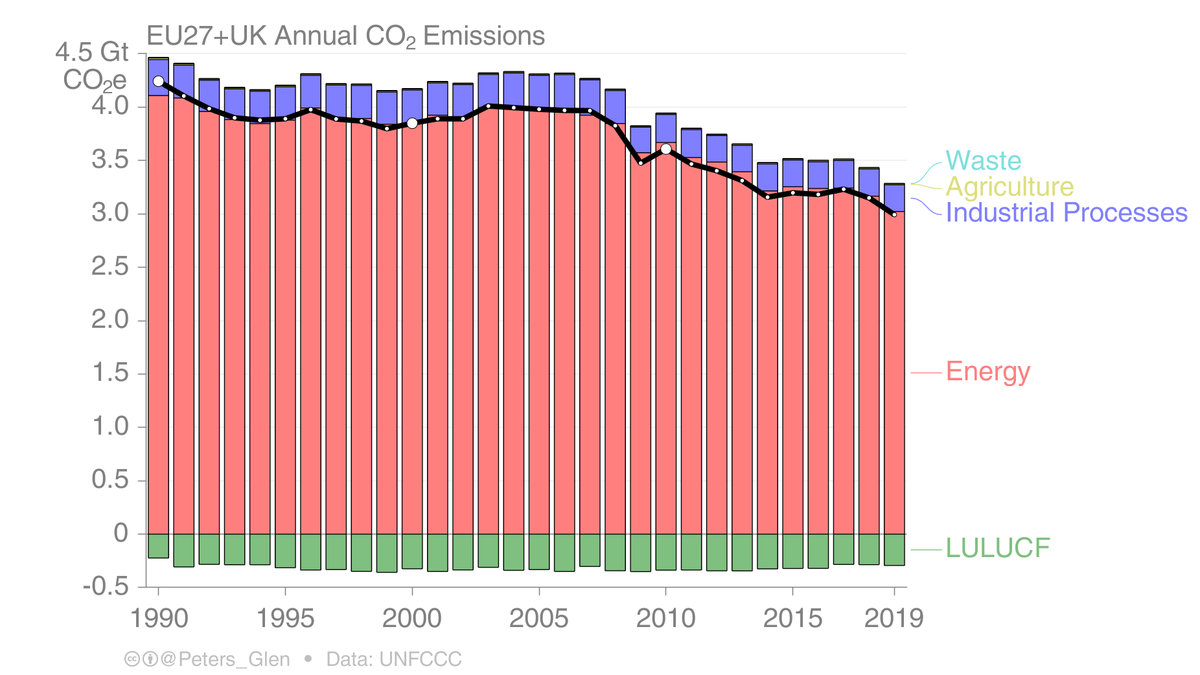
Considering only CO₂ emissions, emissions are nearly totally dominated by energy (see previous tweet for details), with some emissions from industrial processes (cement, etc) and LULUCF as a sink.
3/
3/
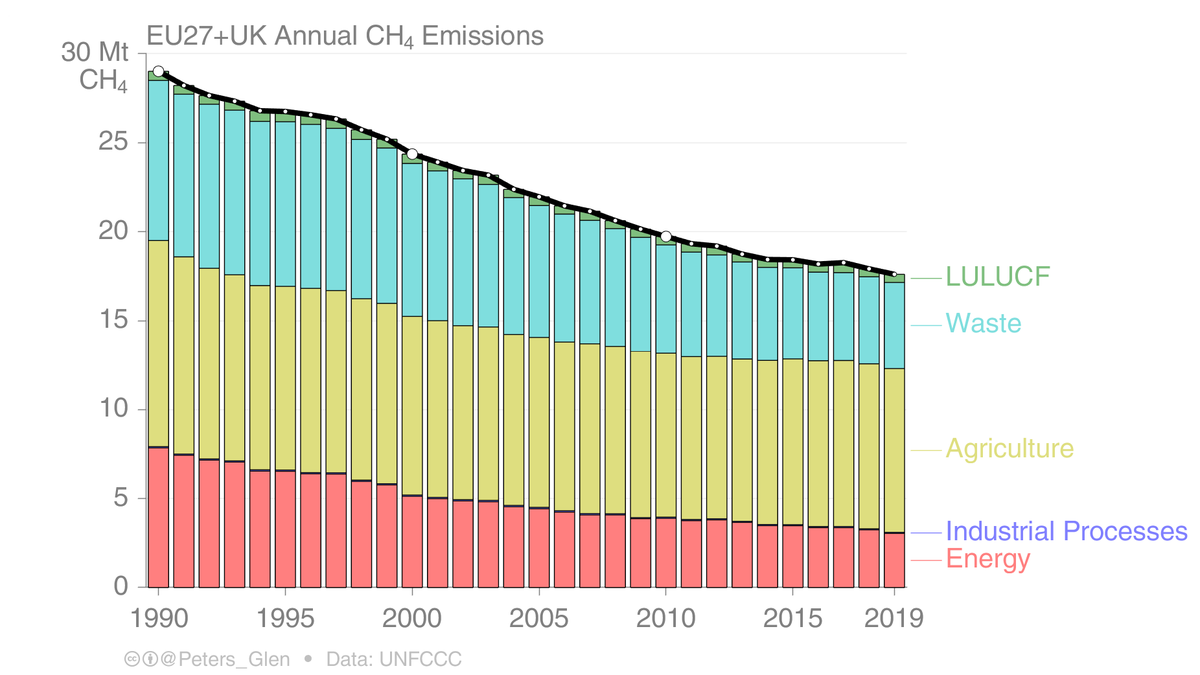
CH₄ emissions have gone down 40% from 1990 to 2019, by sector:
* Energy: -61%
* Agriculture: -21%
* Waste: -46%
This shows that big reductions can be made for CH₄, it is more than burning cows...
4/
* Energy: -61%
* Agriculture: -21%
* Waste: -46%
This shows that big reductions can be made for CH₄, it is more than burning cows...
4/
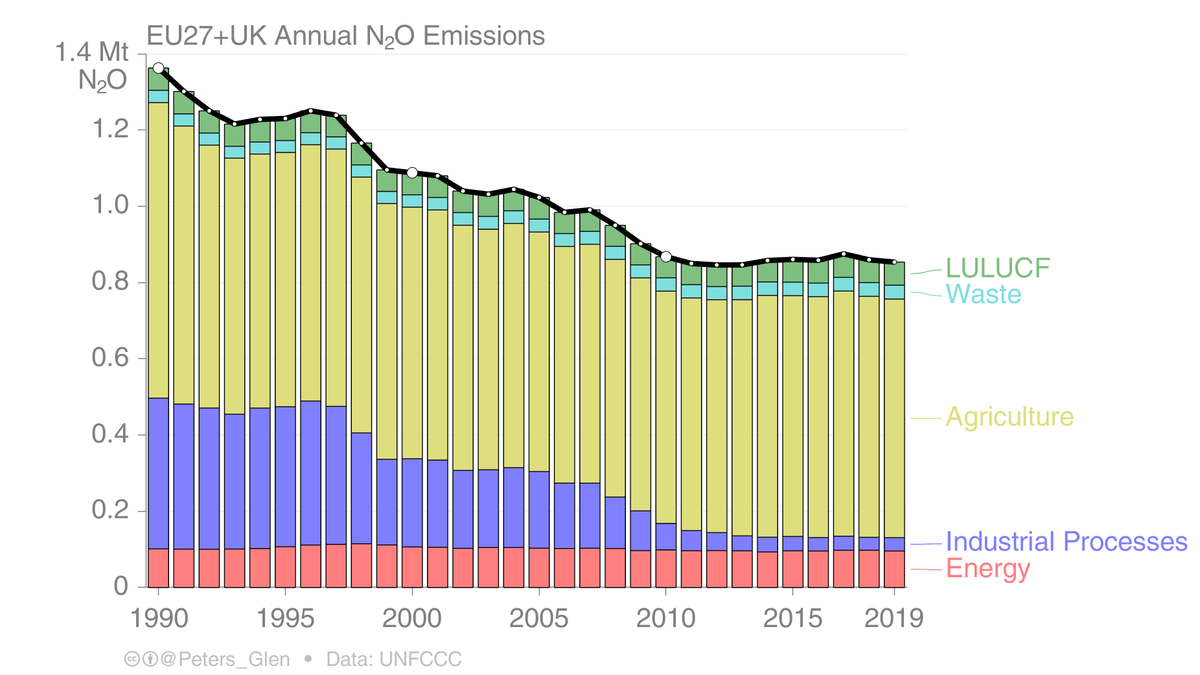
N₂O emissions have gone down 37% from 1990 to 2019, by sector:
* Energy -5%
* Industry: -90%
* Agriculture: -19%
* Waste: +12%
* LULUCF: +4%
Again, N₂O reductions can be made, particularly in industry. It is not just agriculture...
5/
* Energy -5%
* Industry: -90%
* Agriculture: -19%
* Waste: +12%
* LULUCF: +4%
Again, N₂O reductions can be made, particularly in industry. It is not just agriculture...
5/
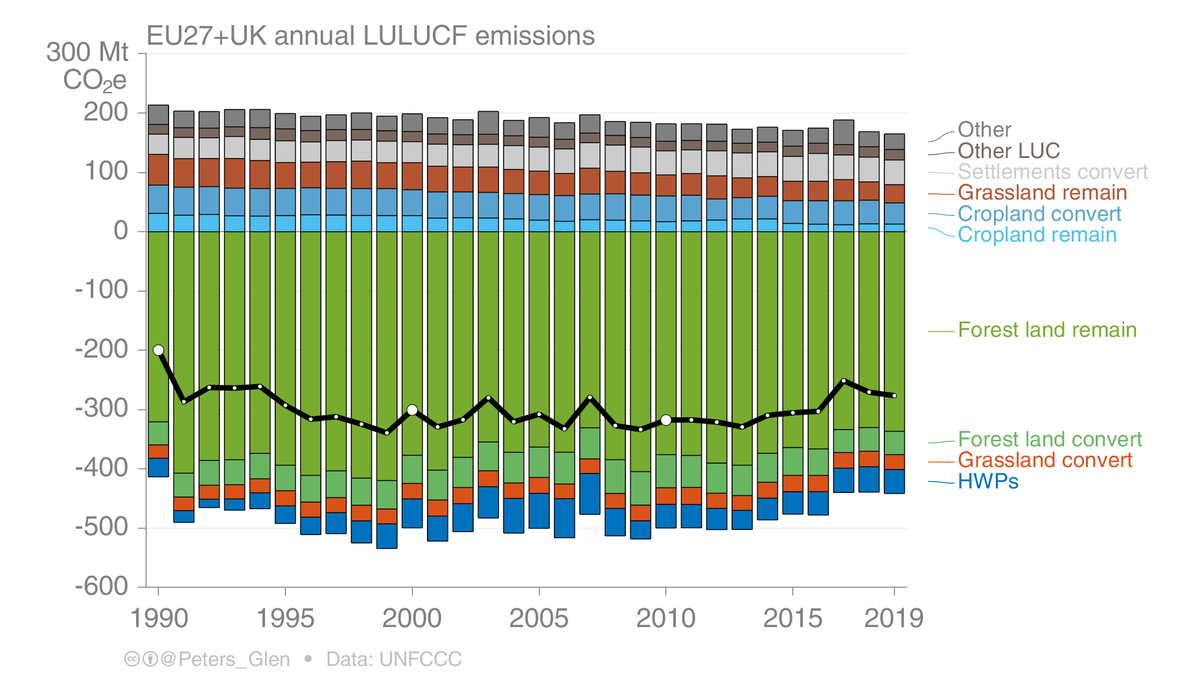
Finally, the most complex sector, LULUCF, where there are both emissions & removals.
The biggest removals are from forests that remain forests (managed forests). Some of this will be management, some will be CO₂ fertilisation & climate (ie, luck).
Lots of other dynamics...
6/
The biggest removals are from forests that remain forests (managed forests). Some of this will be management, some will be CO₂ fertilisation & climate (ie, luck).
Lots of other dynamics...
6/
That was the EU27+UK GHG emissions in a nutshell.
Lots more data to dig into, this is just a summary found in the UNFCCC submitted emission inventories. And there are about 40 countries with this data (Annex I).
Let me know what data you would like to see...
7/7
Lots more data to dig into, this is just a summary found in the UNFCCC submitted emission inventories. And there are about 40 countries with this data (Annex I).
Let me know what data you would like to see...
7/7
My apologies for burning the cows in tweet 4, I only meant them to burp...

 Read on Twitter