Fractals
Thread https://abs.twimg.com/emoji/v2/... draggable="false" alt="👇" title="Rückhand Zeigefinger nach unten" aria-label="Emoji: Rückhand Zeigefinger nach unten">
Thread
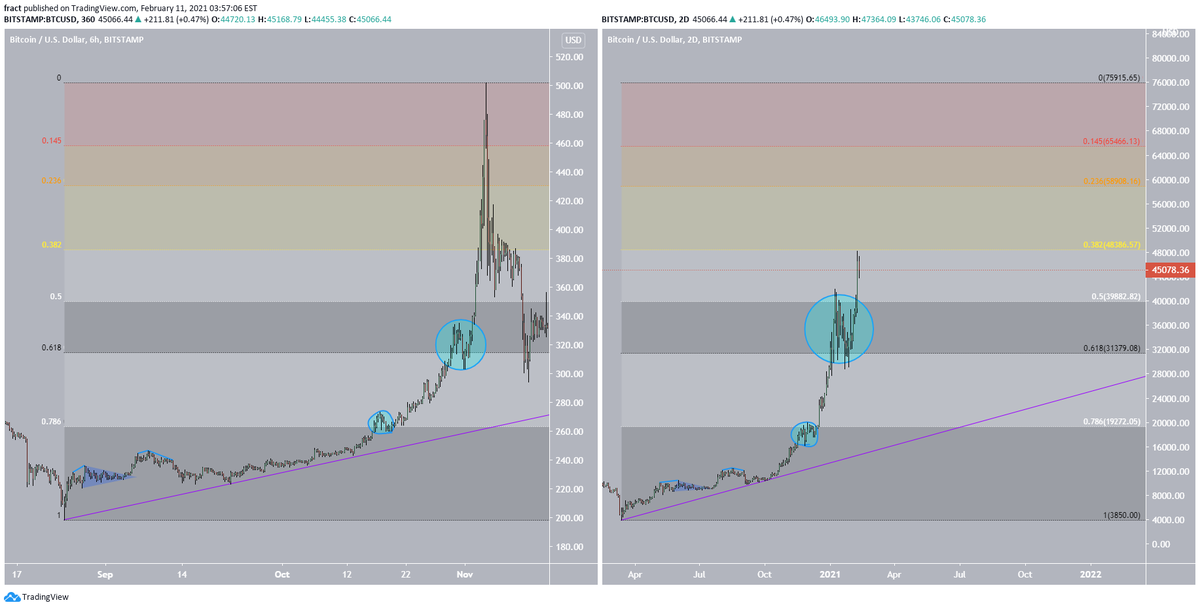
Fractals are not only abundant in nature, they are also a building block in markets.
They are repetitive formations, self-similar across different time frames.
In markets, they are used to identify a trend, pattern or outlook.
Charts by Fract: https://www.tradingview.com/u/fract/ ">https://www.tradingview.com/u/fract/&...
They are repetitive formations, self-similar across different time frames.
In markets, they are used to identify a trend, pattern or outlook.
Charts by Fract: https://www.tradingview.com/u/fract/ ">https://www.tradingview.com/u/fract/&...
There are strategies and indicators based on fractals, each with their own rules.
They identify patterns that repeat across timeframes or when added up create a prevailing trend.
Bill Williams used fractals in his system and has inspired many: https://www.tradingview.com/scripts/williamsfractal/">https://www.tradingview.com/scripts/w...
They identify patterns that repeat across timeframes or when added up create a prevailing trend.
Bill Williams used fractals in his system and has inspired many: https://www.tradingview.com/scripts/williamsfractal/">https://www.tradingview.com/scripts/w...
The Bars Pattern tool can be used to look for fractals in price action.
First select a starting point and ending point.
Then compare and contrast price action between different points in time.
First select a starting point and ending point.
Then compare and contrast price action between different points in time.
The Ghost Feed tool can be used to map out a fractal.
Select the tool and then estimate the pattern with each click.
Use Ghost Feed to visualize any pattern you see and test its merit.
Select the tool and then estimate the pattern with each click.
Use Ghost Feed to visualize any pattern you see and test its merit.
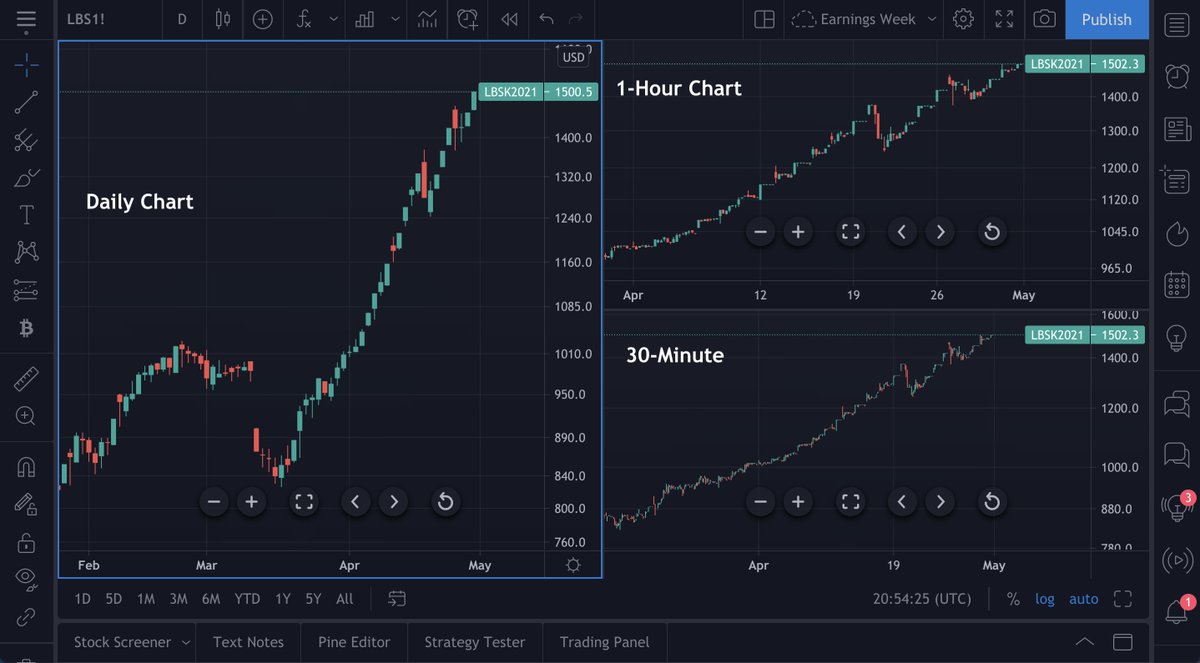
The multi-chart layout can be used to examine repeating price behavior over different timeframes.
This chart shows three different timeframes for the same asset.
Those who are interested in fractals might look for repeating price behavior on each timeframe.
This chart shows three different timeframes for the same asset.
Those who are interested in fractals might look for repeating price behavior on each timeframe.
If you know a trader or investor who uses fractals in their work, tag them below.
We hope you found this thread interesting.
Thanks for reading https://abs.twimg.com/emoji/v2/... draggable="false" alt="😄" title="Lächelndes Gesicht mit geöffnetem Mund und lächelnden Augen" aria-label="Emoji: Lächelndes Gesicht mit geöffnetem Mund und lächelnden Augen">
We hope you found this thread interesting.
Thanks for reading

 Read on Twitter


