I am deeply sceptical of TA in general (astrology for traders); however, I do recognize that there are recurring patterns that have predictive power, and these can be helpful.
I bring this up because BNT is doing something interesting on a largely neglected timeframe - weekly.
I bring this up because BNT is doing something interesting on a largely neglected timeframe - weekly.
Before we get there it is important to acknowledge the fake-out that stressed out the day traders on the daily. There was a convincing breakout from resistance (a) followed by what looked like a back-test that broke support (b). If this had you worried, pay attention.
Patterns on short time frames are unreliable, and some of these imaginary lines are more convincing than they ought to be. However, structures on longer time frames can be more compelling.
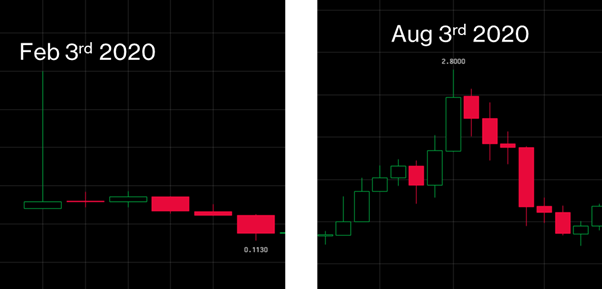
On the week of Feb 3rd 2020, the BNTUSDT chart on Binance (its first candle) wicked as high as $1, and on Aug 3rd 2020, it wicked up to $2.80 – the height of DeFi Summer.
Assume that these points are the resistance of an ascending parallel channel. The bottom of the channel is very well defined, with 10 touchpoints on the weekly.
Now the structure starts to look more familiar.
Now the structure starts to look more familiar.
As I stated at the beginning of this thread, I am not convinced that these charting techniques provide any real certainty.
I think this is only slightly better than palm reading.
Regardless, you guys seem to find it interesting, so I thought a big picture view might appeal.
I think this is only slightly better than palm reading.
Regardless, you guys seem to find it interesting, so I thought a big picture view might appeal.

 Read on Twitter


