Today in the #AtlanticBubble
Don& #39;t freak out about the backlog
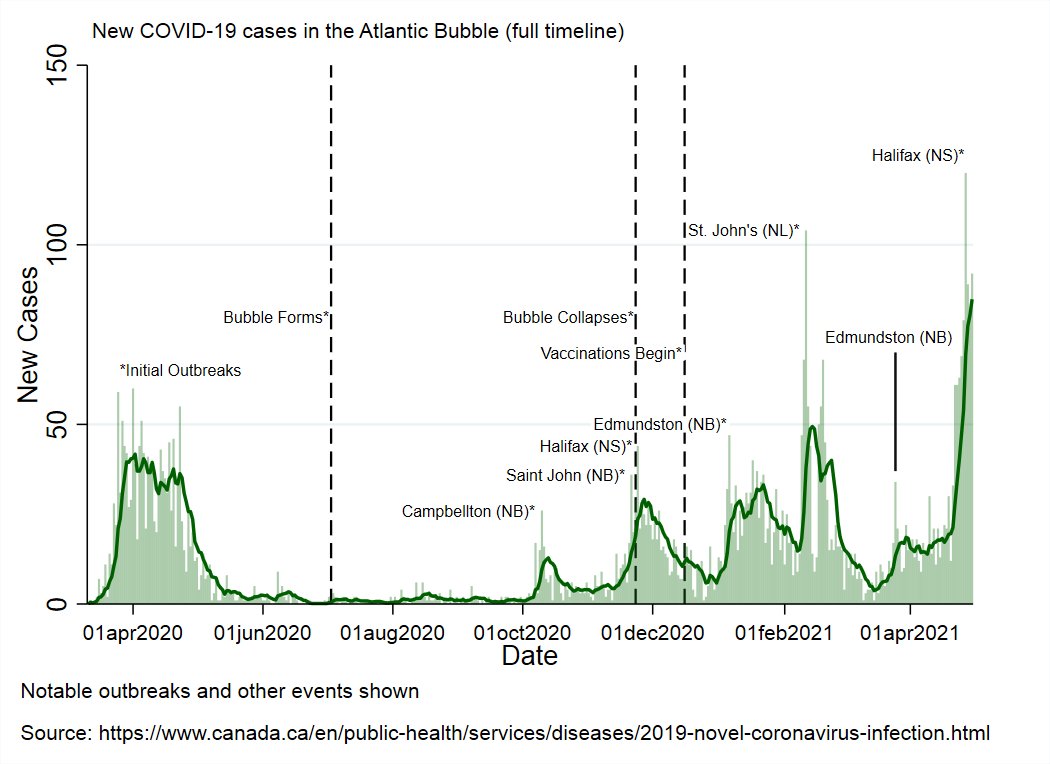
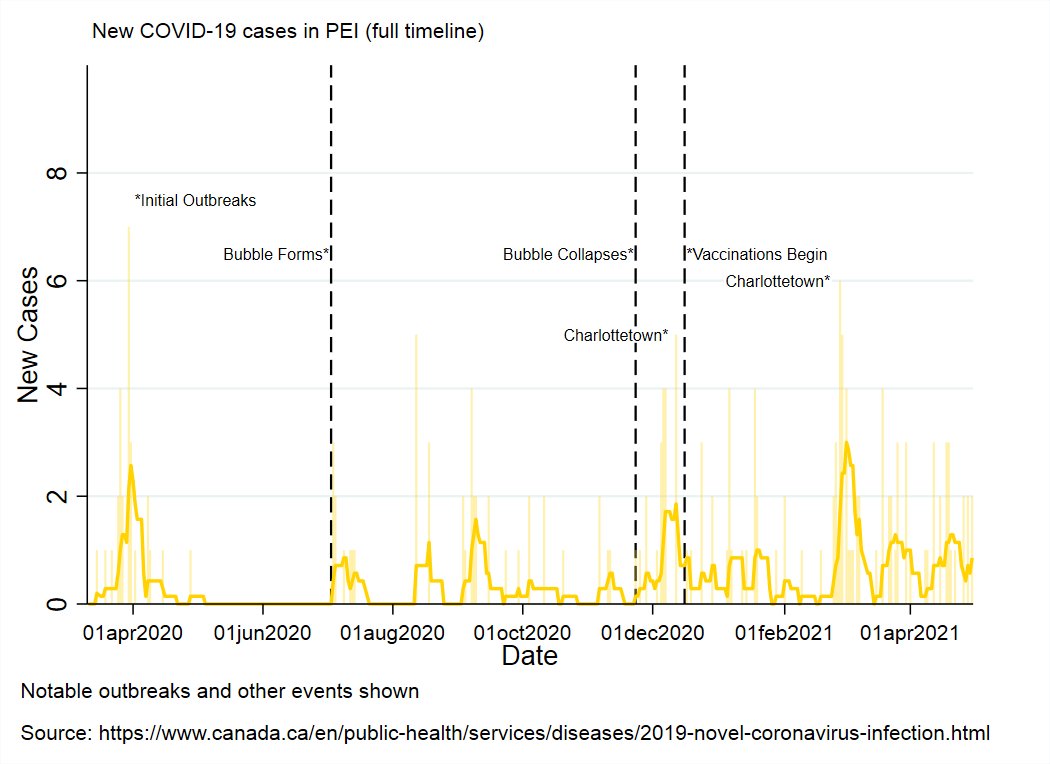
92 new cases were reported: 2 in PEI, 8 in Newfoundland and Labrador, 15 in New Brunswick, and 67 in Nova Scotia.
21/25 outside NS were traced.
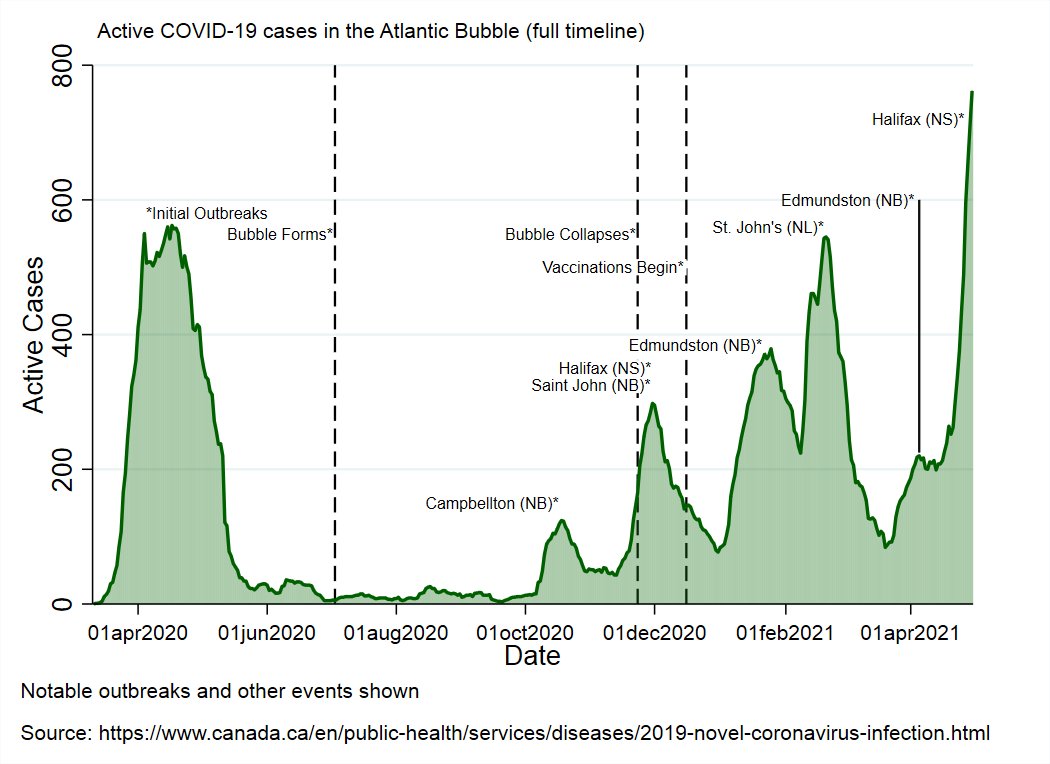
There are now 761 known, active cases in the region.
Don& #39;t freak out about the backlog
92 new cases were reported: 2 in PEI, 8 in Newfoundland and Labrador, 15 in New Brunswick, and 67 in Nova Scotia.
21/25 outside NS were traced.
There are now 761 known, active cases in the region.
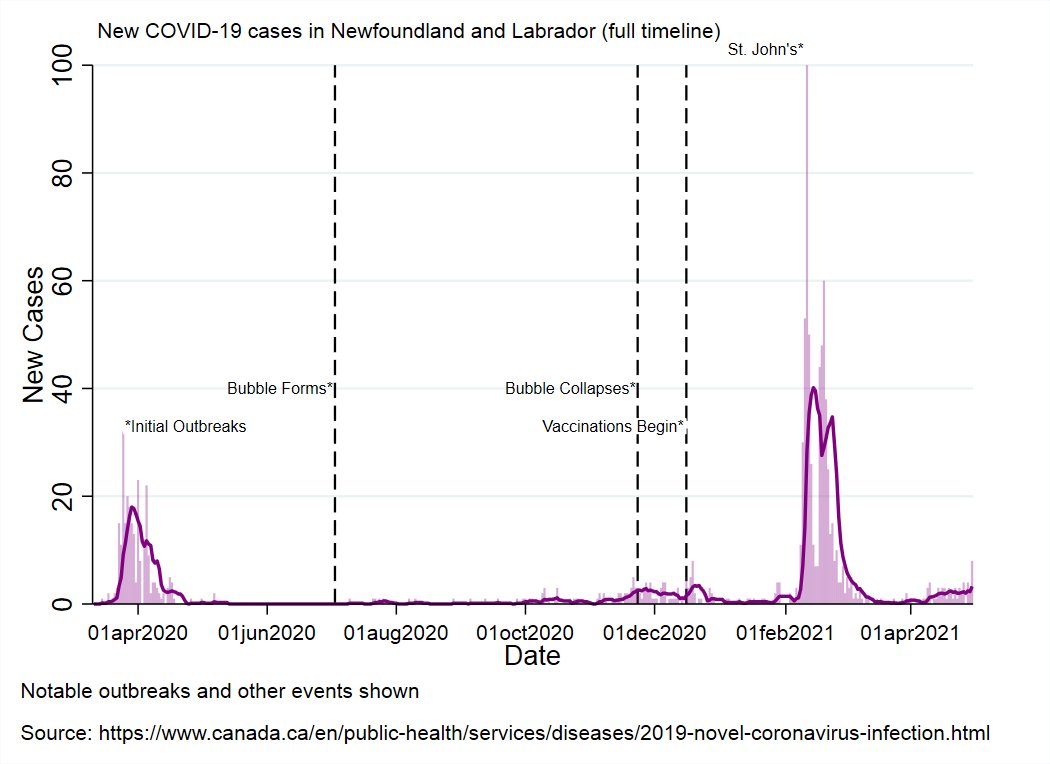
NL reported 8 new cases today:
3 each in the Eastern and Central health regions (all travel-related), and 2 in the Western health region (1 travel related and 1 still under investigation).
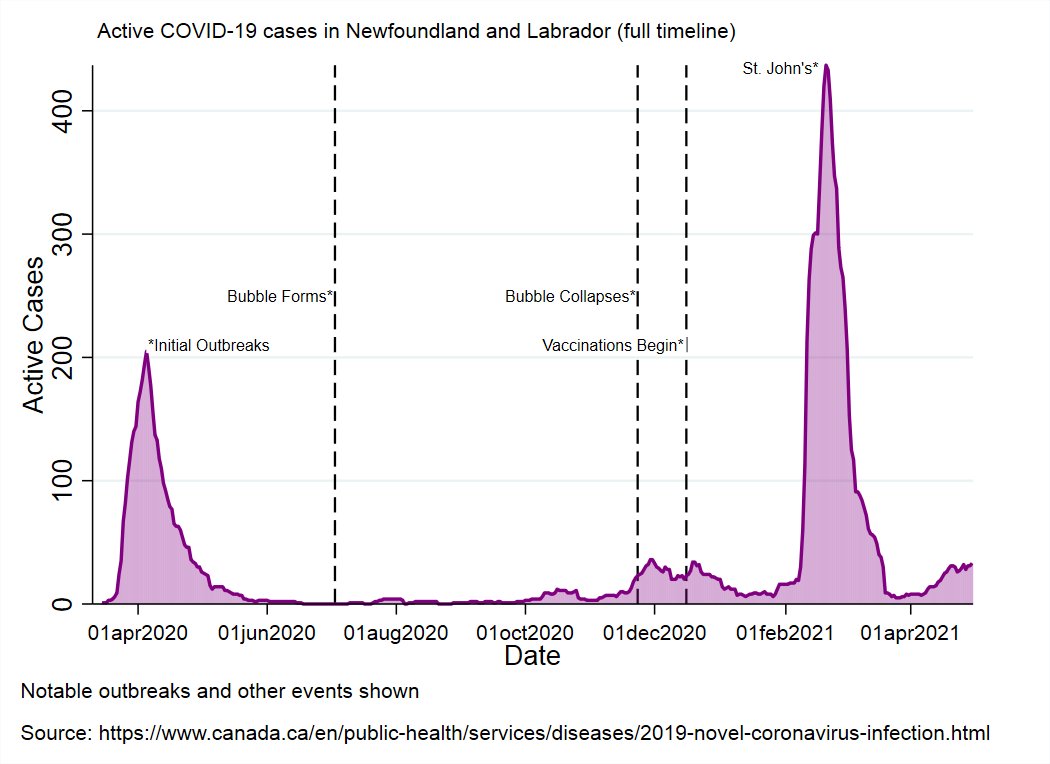
There are now 33 known, active cases in NL.
3 each in the Eastern and Central health regions (all travel-related), and 2 in the Western health region (1 travel related and 1 still under investigation).
There are now 33 known, active cases in NL.
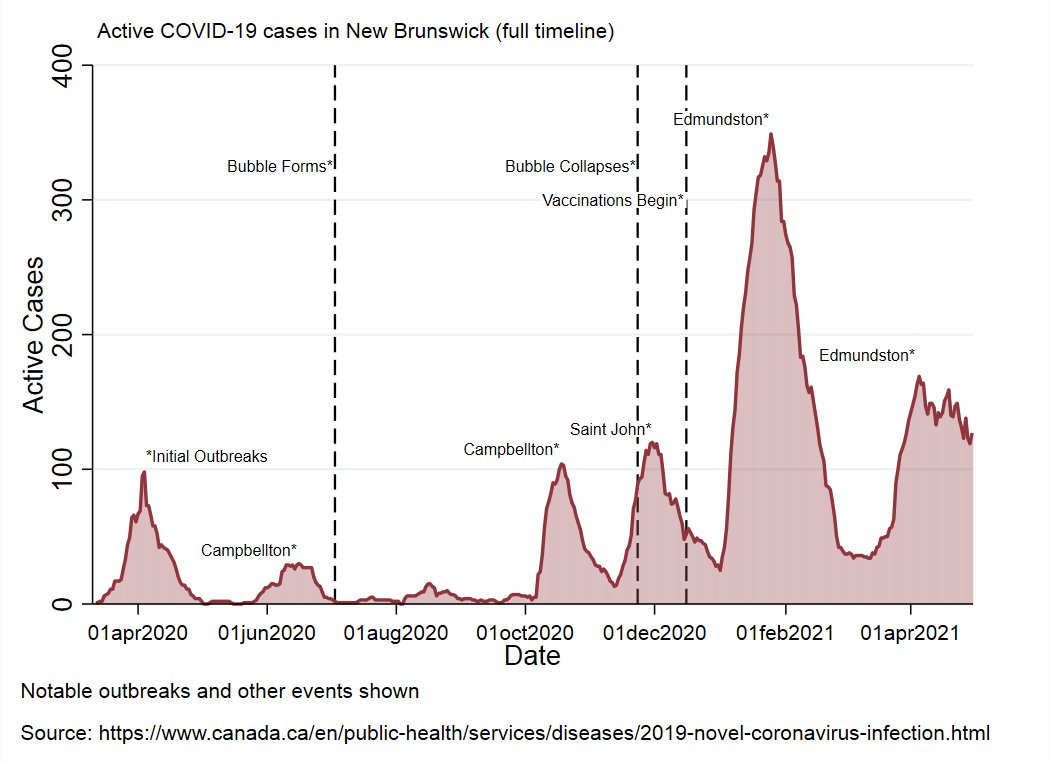
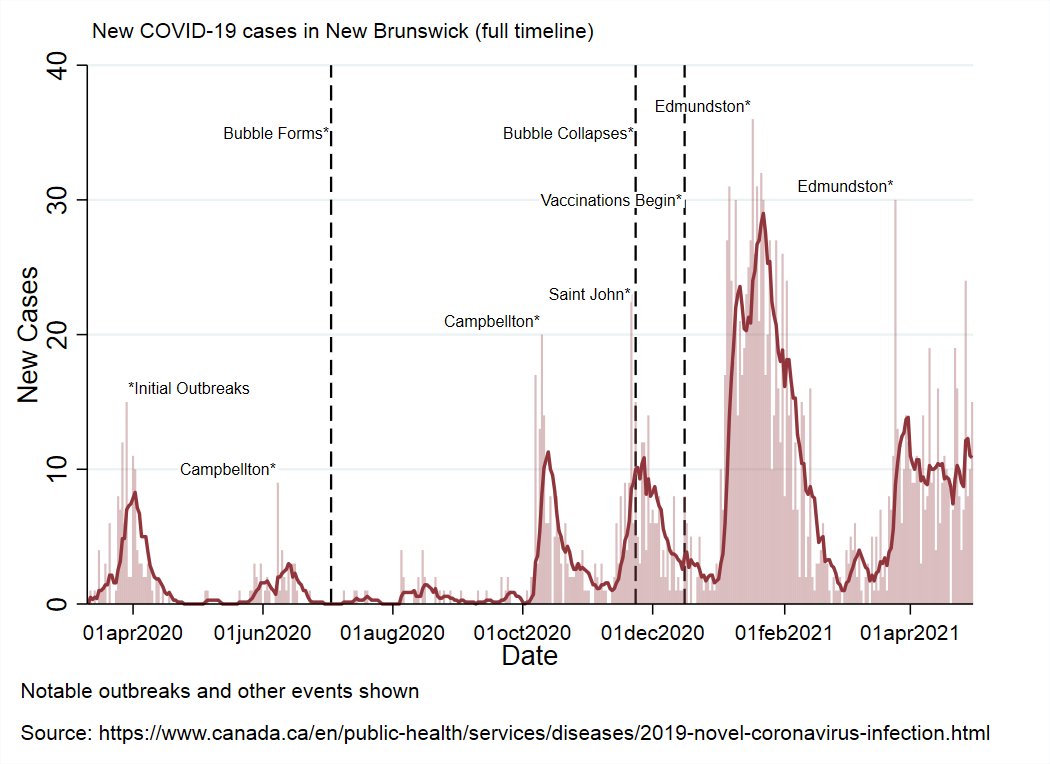
NB reported 15 new cases:
1 in Moncton (travel)
1 in Edmundston (close contact)
3 in Fredericton (1 travel, 1 close contact, 1 under investigation)
3 in Saint John (2 travel and 1 under investigation)
3 in Miramichi (2 travel, 1 under investigation)
4 in Bathurst (travel)
1 in Moncton (travel)
1 in Edmundston (close contact)
3 in Fredericton (1 travel, 1 close contact, 1 under investigation)
3 in Saint John (2 travel and 1 under investigation)
3 in Miramichi (2 travel, 1 under investigation)
4 in Bathurst (travel)
There are now 127 known, active cases in NB.
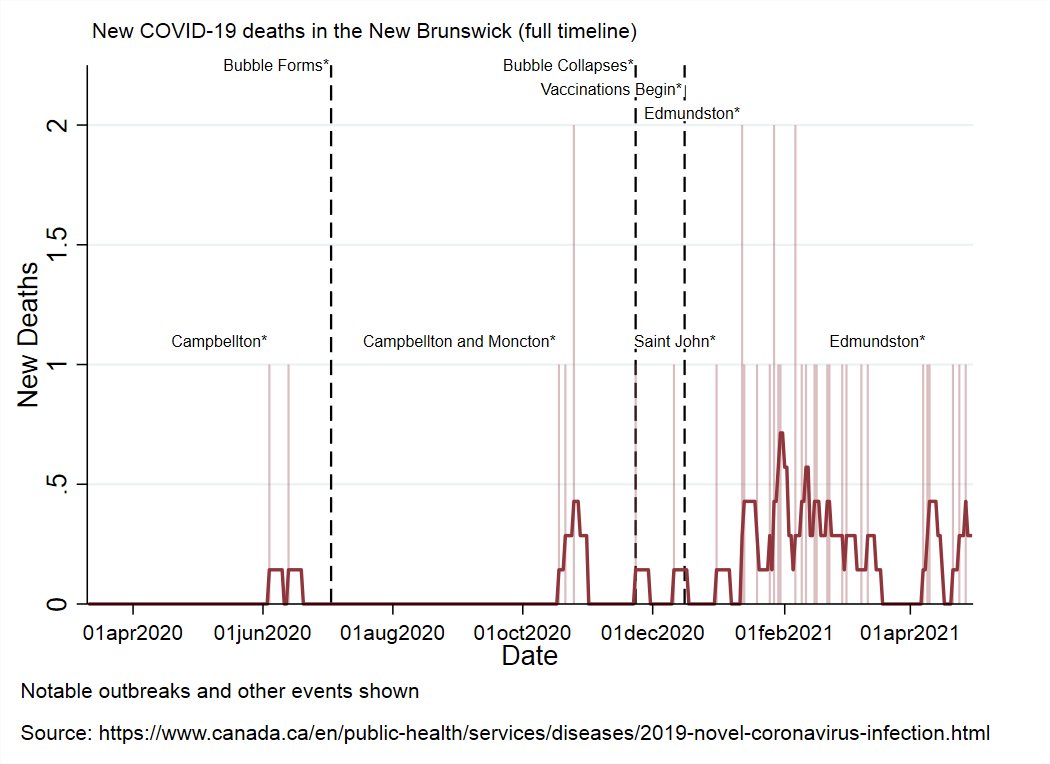
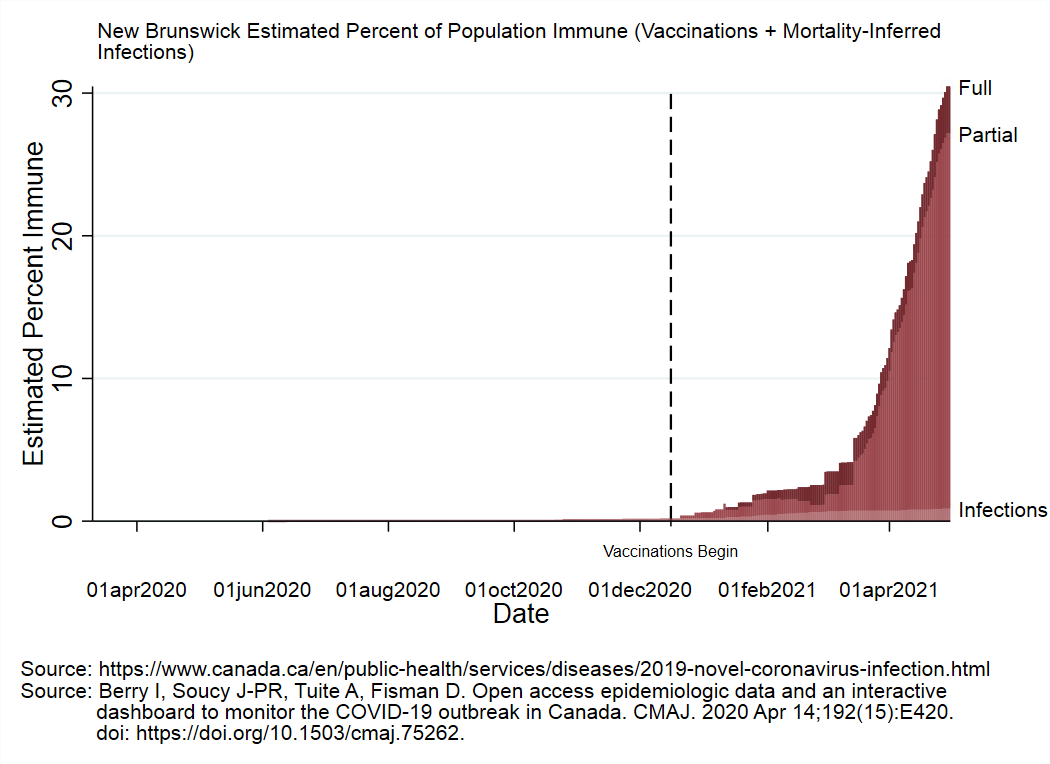
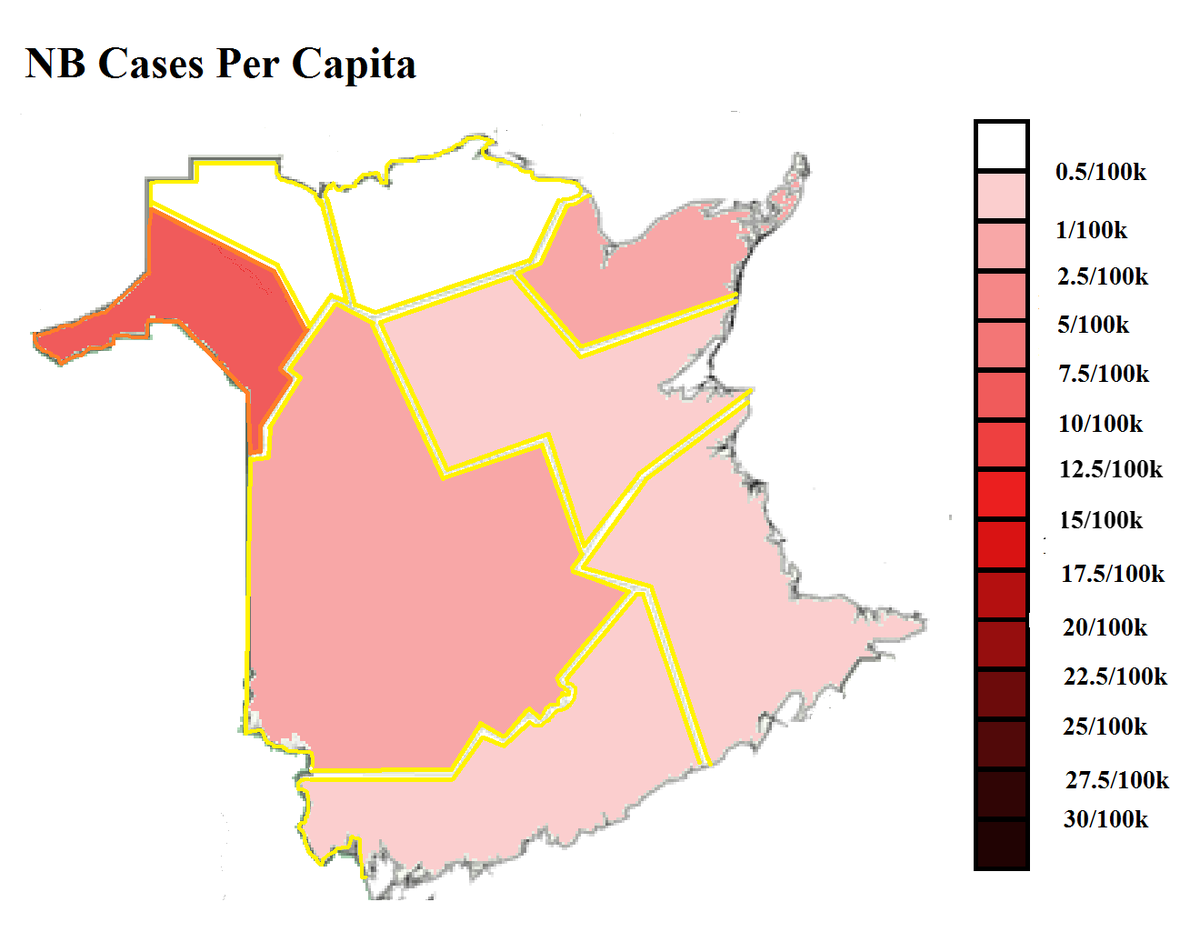
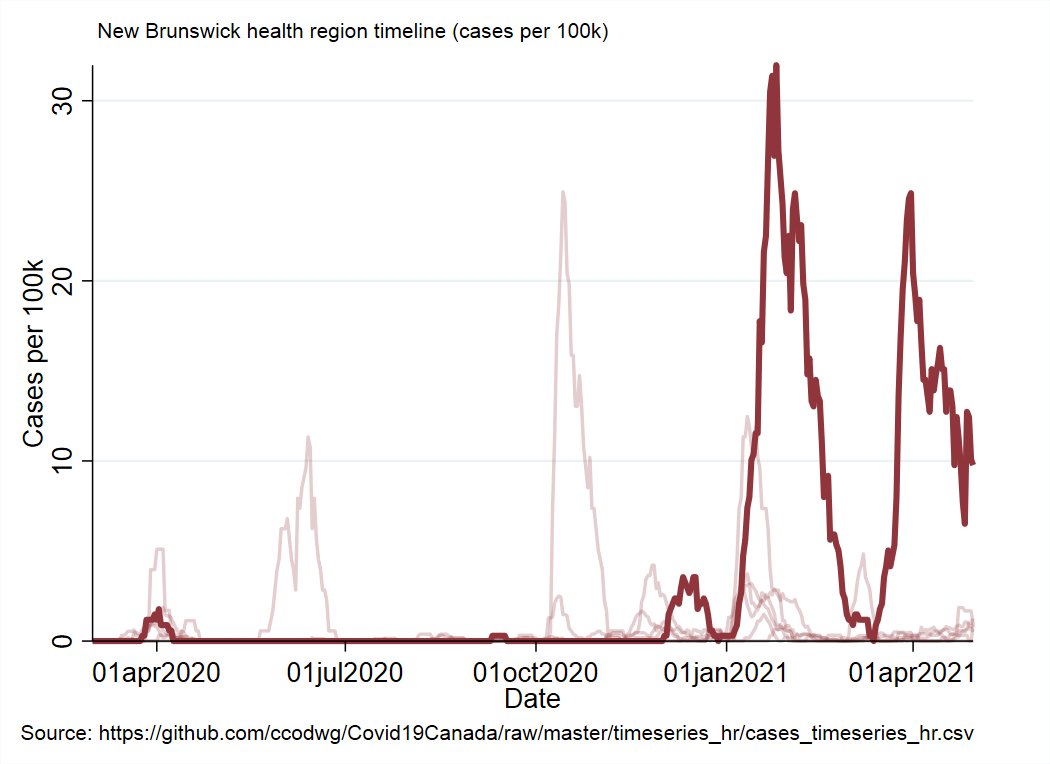
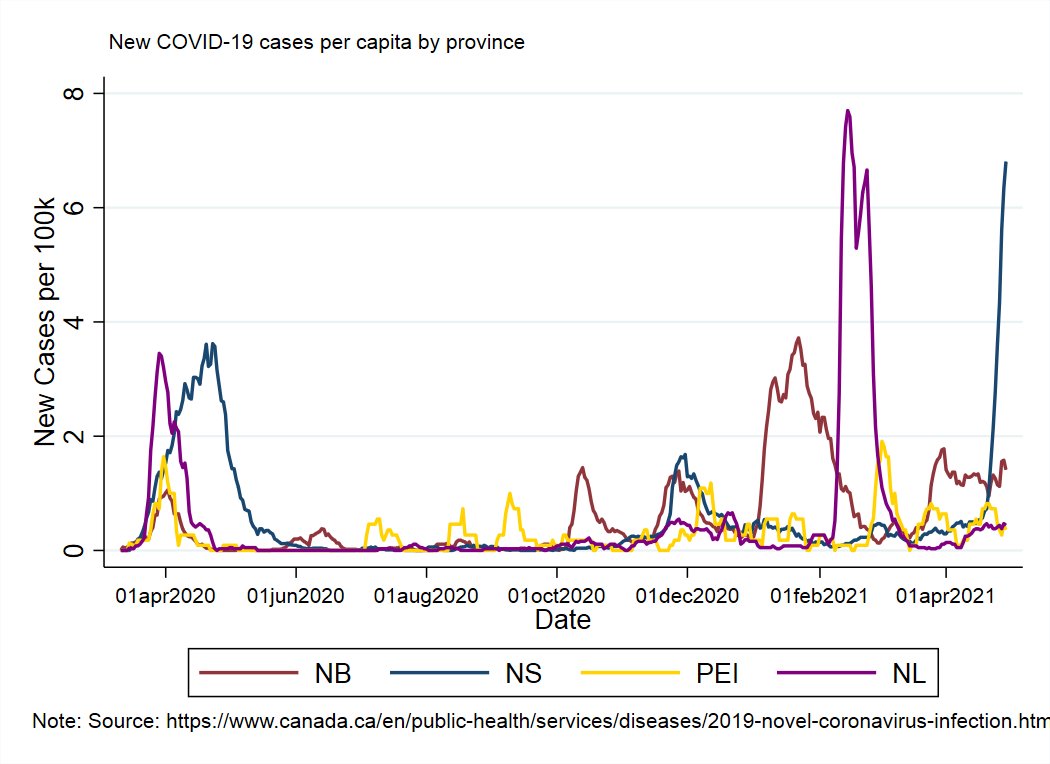
Updated restrictions/case levels map, and cases per capita timeline with Edmundston emphasized.
Weird peppering of cases under investigation today, but no obvious cause of concern.
Updated restrictions/case levels map, and cases per capita timeline with Edmundston emphasized.
Weird peppering of cases under investigation today, but no obvious cause of concern.
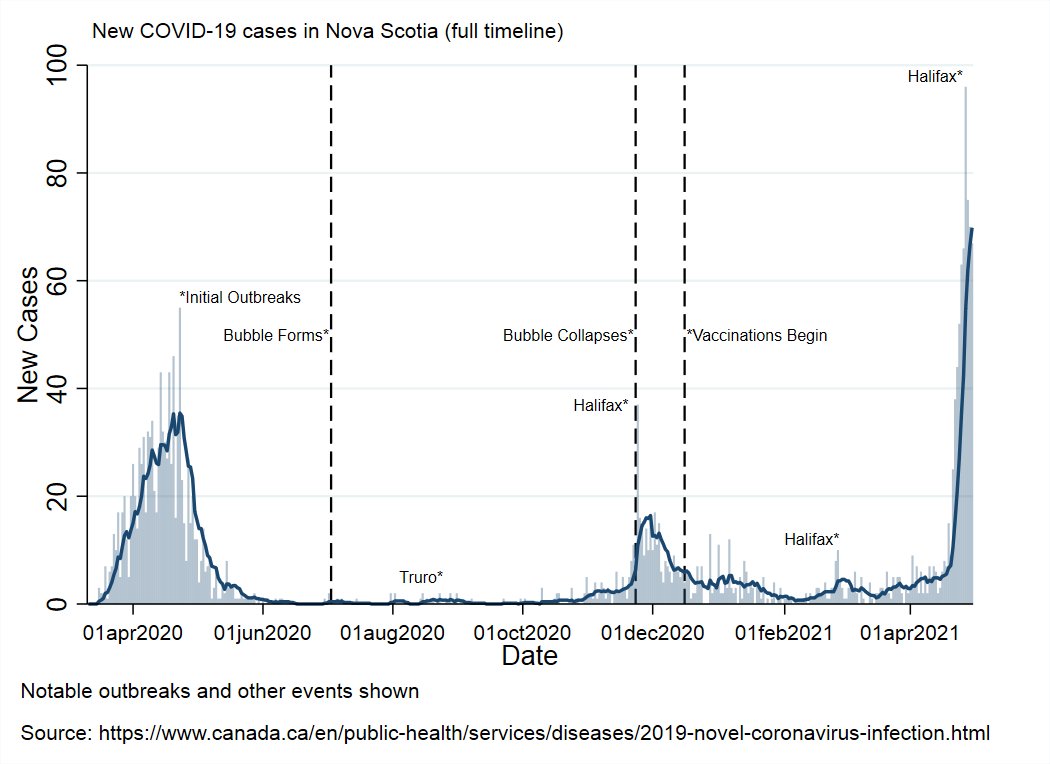
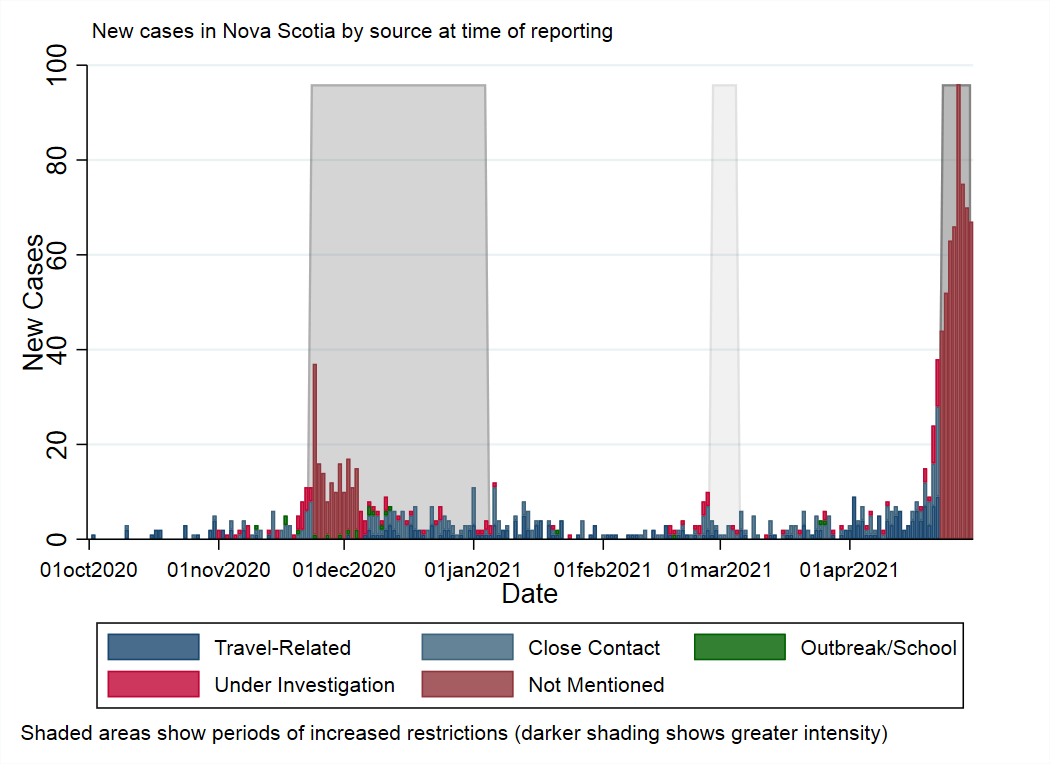
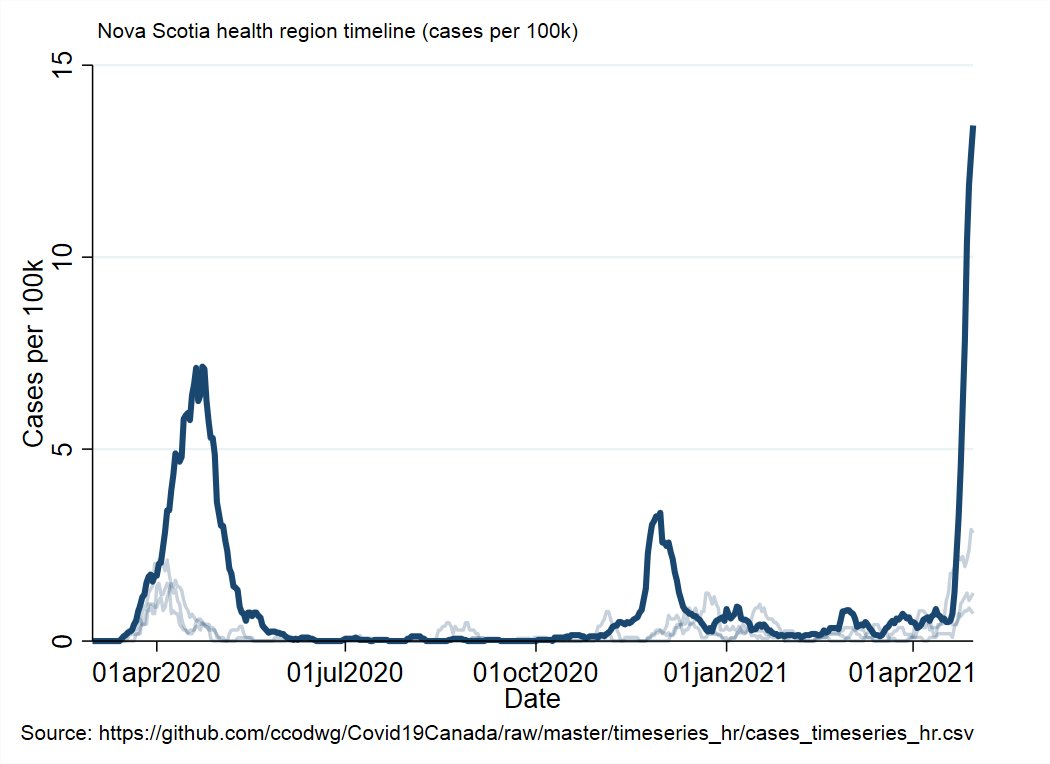
NS reported 67 new cases: 3 each in the Eastern and Northern zones, 4 in the Western zone, and 57 in the Halifax area (Central zone).
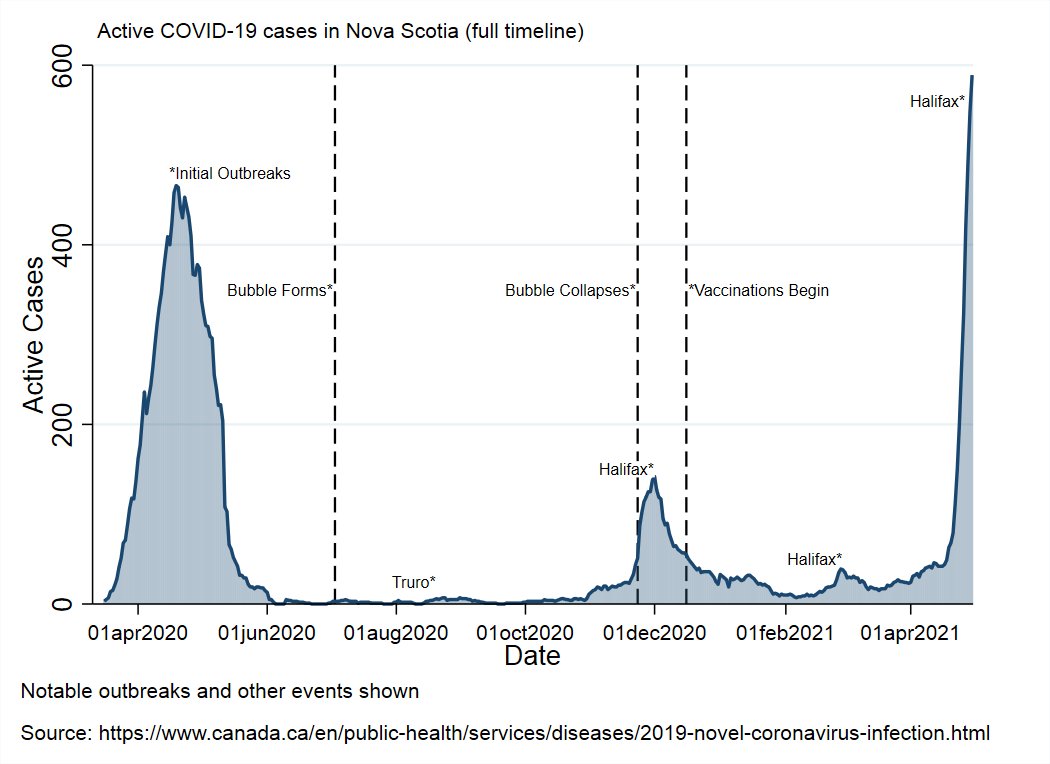
There are now 589 known, active cases in NS.
There are now 589 known, active cases in NS.
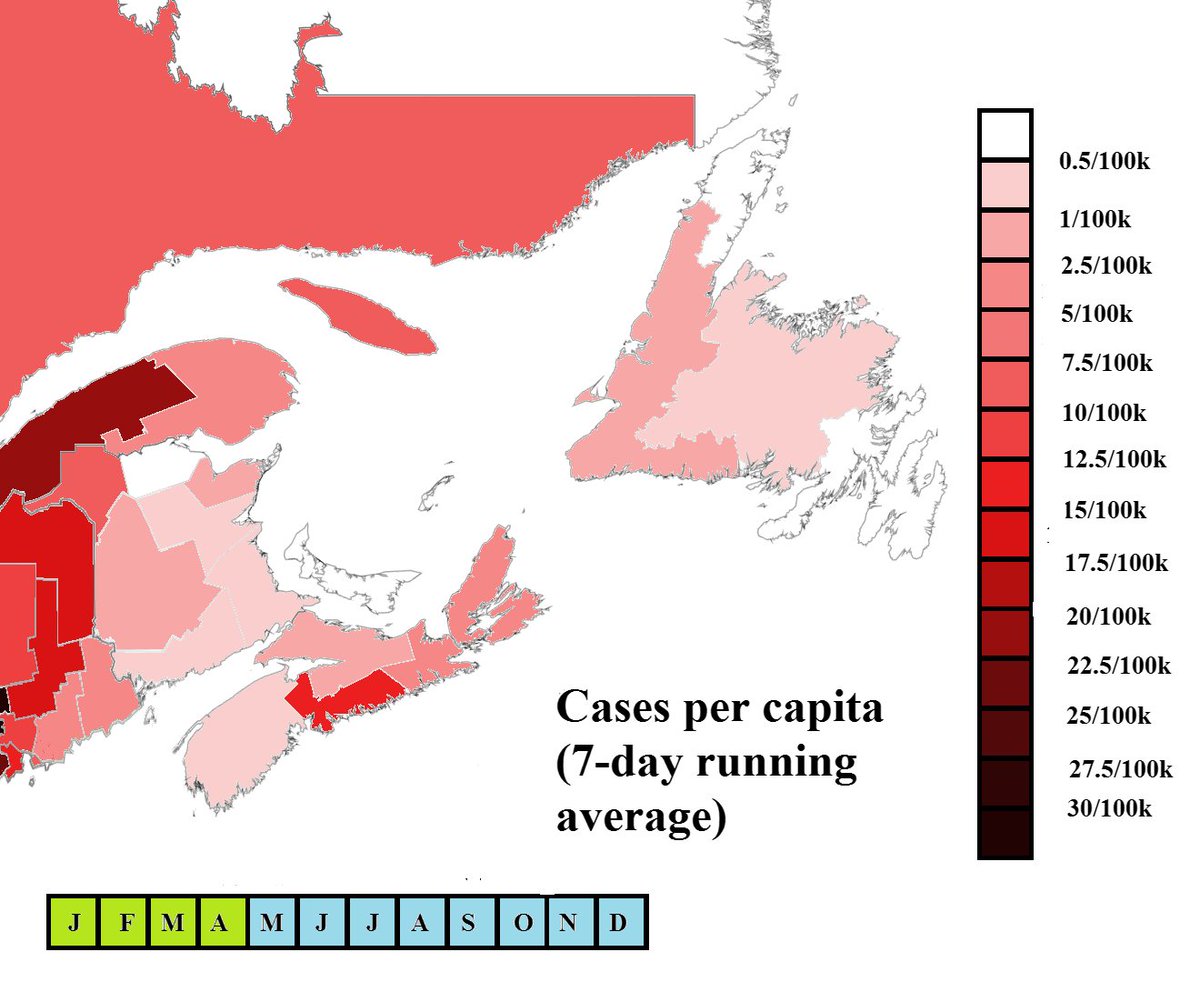
Updated restrictions/case levels map for NS, case origin timeline, and cases per capita timeline with Halifax emphasized.
Still no evidence of community spread outside of the Halifax area. Hopefully it stays that way and the numbers are a bit better next week.
Still no evidence of community spread outside of the Halifax area. Hopefully it stays that way and the numbers are a bit better next week.
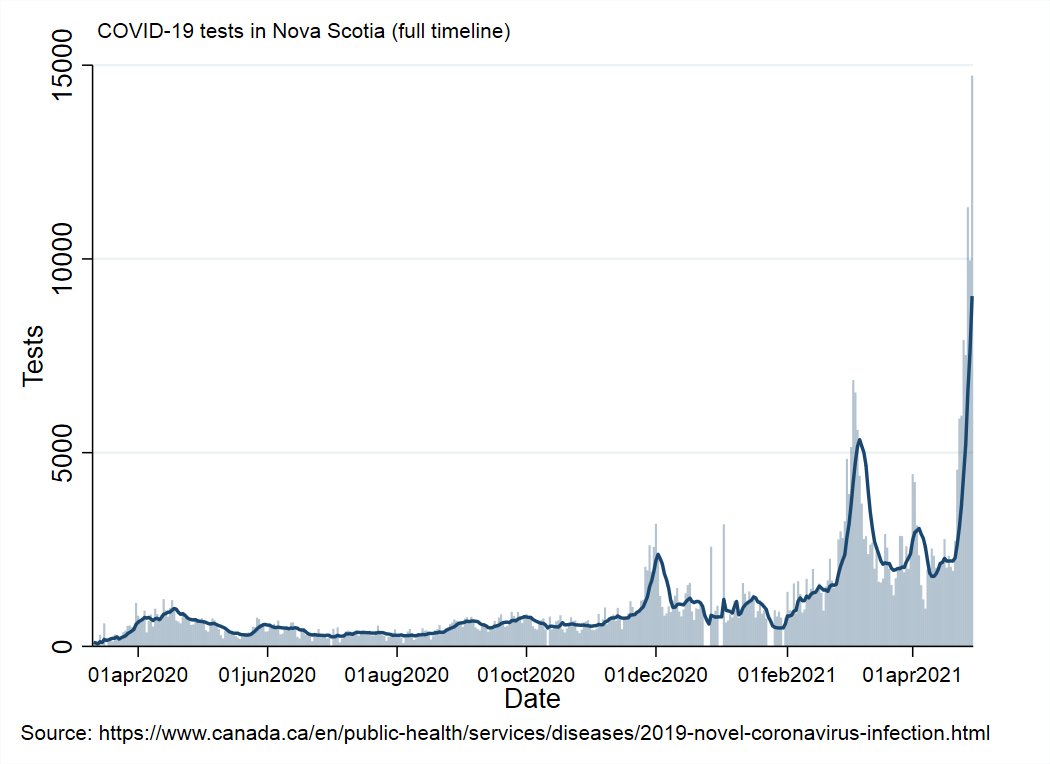
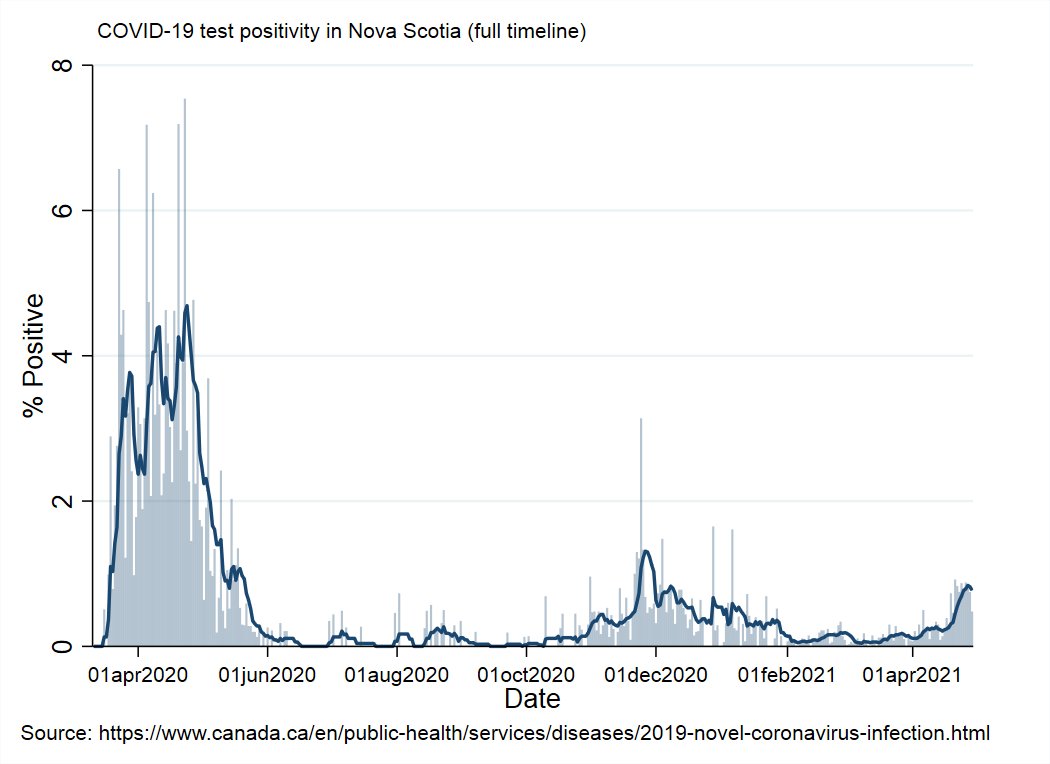
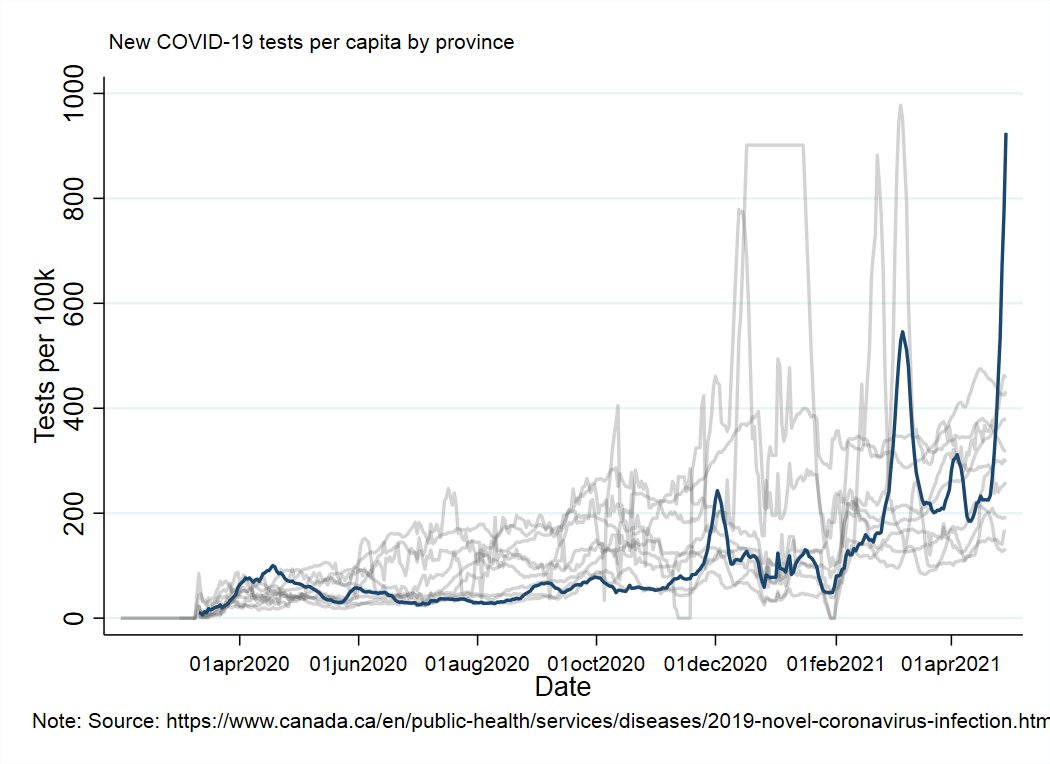
Updated test numbers and test positivity for NS (hovering at a bit under 0.8%) and comparison with the rest of the country.
Due to the unprecedented surge in demand for testing, NS currently has a backlog of about 45k tests (a few days worth) that have yet to be processed.
The immediate reaction when this was announced was & #39;my god, there could be thousands of cases in there!" but no probably not.
The immediate reaction when this was announced was & #39;my god, there could be thousands of cases in there!" but no probably not.
It& #39;s not that weird for provinces to have a backlog at some points.
You may remember that NS took over some testing for Ontario back in the Fall when they had a massive backlog of samples.
You may remember that NS took over some testing for Ontario back in the Fall when they had a massive backlog of samples.
Back then I tried to estimate ON& #39;s *true* case level by taking their recent positivity rate and applying it to the backlogged samples.
It was relatively accurate. Once they cleared the backlog, my estimates and their counts were very close.
It was relatively accurate. Once they cleared the backlog, my estimates and their counts were very close.
If you apply our recent positivity rate to (0.77%) to the backlog (45k) you get ~350 cases in the backlog.
I actually suspect it& #39;s quite a bit lower than that. They& #39;ve likely been prioritizing high risk contacts and exposures for processing, so backlog may have lower case rate.
I actually suspect it& #39;s quite a bit lower than that. They& #39;ve likely been prioritizing high risk contacts and exposures for processing, so backlog may have lower case rate.
Asymptomatic, non-exposure testing in NS has a very, very low positivity rate (~0.1%?).
If that backlog looks more like that, it would have closer to 45 cases.
No way to know until they& #39;re processed, but I think it won& #39;t be as high as some are imagining.
If that backlog looks more like that, it would have closer to 45 cases.
No way to know until they& #39;re processed, but I think it won& #39;t be as high as some are imagining.
If that doesn& #39;t put you mind at ease, try this:
The swabs are in the past
"What?"
The swabs that have been collected either are or are not positive. The people that were swabbed are either already in isolation or are very unlikely to test positive.
The swabs are in the past
"What?"
The swabs that have been collected either are or are not positive. The people that were swabbed are either already in isolation or are very unlikely to test positive.
We are already doing what we have to do, no matter that the case number in the backlog is.
If the number is low, that& #39;s great. If it& #39;s on the higher side (likely still the low hundreds), then we can deal with that, too.
If the number is low, that& #39;s great. If it& #39;s on the higher side (likely still the low hundreds), then we can deal with that, too.
Here& #39;s the current situation in the region.
There was a weird peppering of single untraced cases around the region today, but the hotpot is Halifax. Maybe Fredericton, but that hasn& #39;t gone anywhere yet.
Almost everything else on the map in the region is traced. (travel/contact)
There was a weird peppering of single untraced cases around the region today, but the hotpot is Halifax. Maybe Fredericton, but that hasn& #39;t gone anywhere yet.
Almost everything else on the map in the region is traced. (travel/contact)
You can see the entire pandemic timeline for the Atlantic region and surrounding area in the animation.
Each tick is a week since the start of the pandemic in March of last year.
Each tick is a week since the start of the pandemic in March of last year.
Provincial and Territorial Vaccine Roll-Out
Top of the ribbon is doses distributed, bottom is doses administered.
The higher the ribbon goes, the more people are being vaccinated. The wider it gets, the more doses sit unused.
National ribbon outlined in black.
Top of the ribbon is doses distributed, bottom is doses administered.
The higher the ribbon goes, the more people are being vaccinated. The wider it gets, the more doses sit unused.
National ribbon outlined in black.
Vaccine Roll-Out Metrics
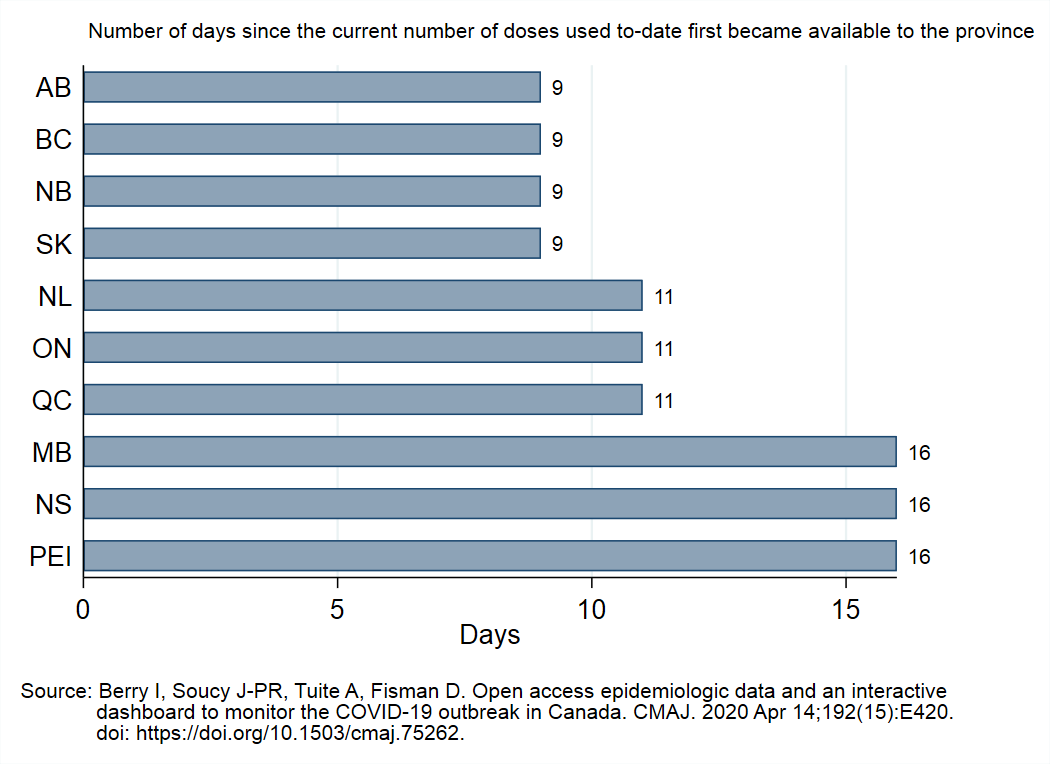
1st graph shows how many days since each province had enough doses to cover their current usage.
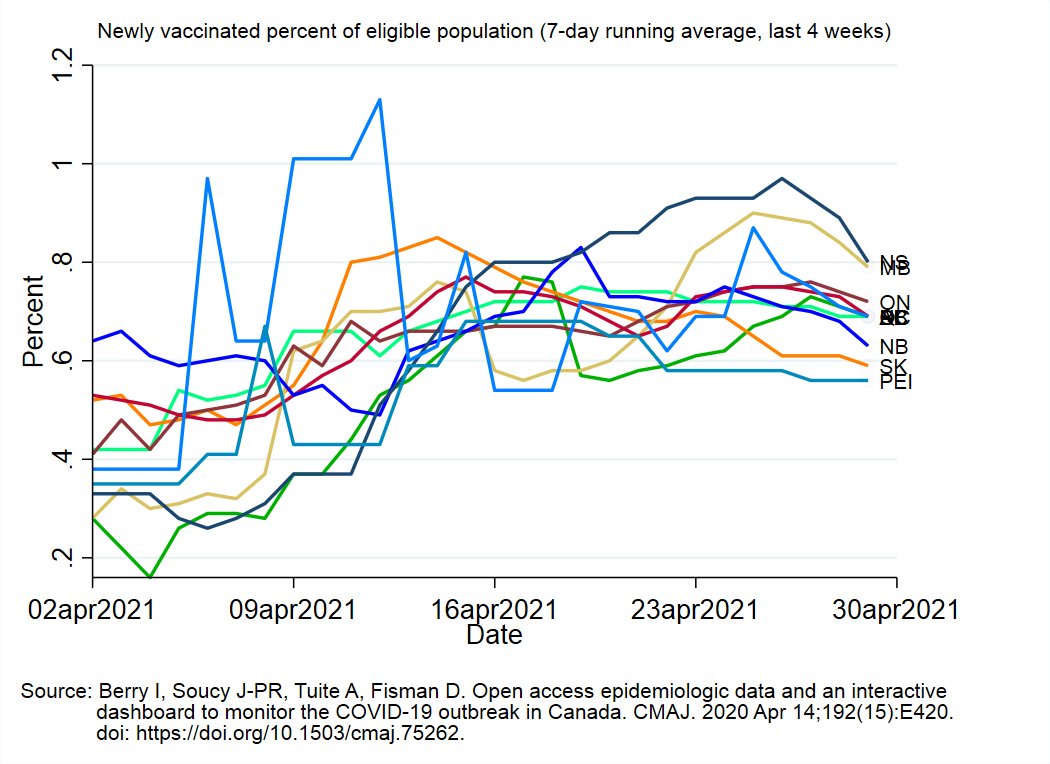
2nd graph shows percent of eligible population that is newly vaccinated each day
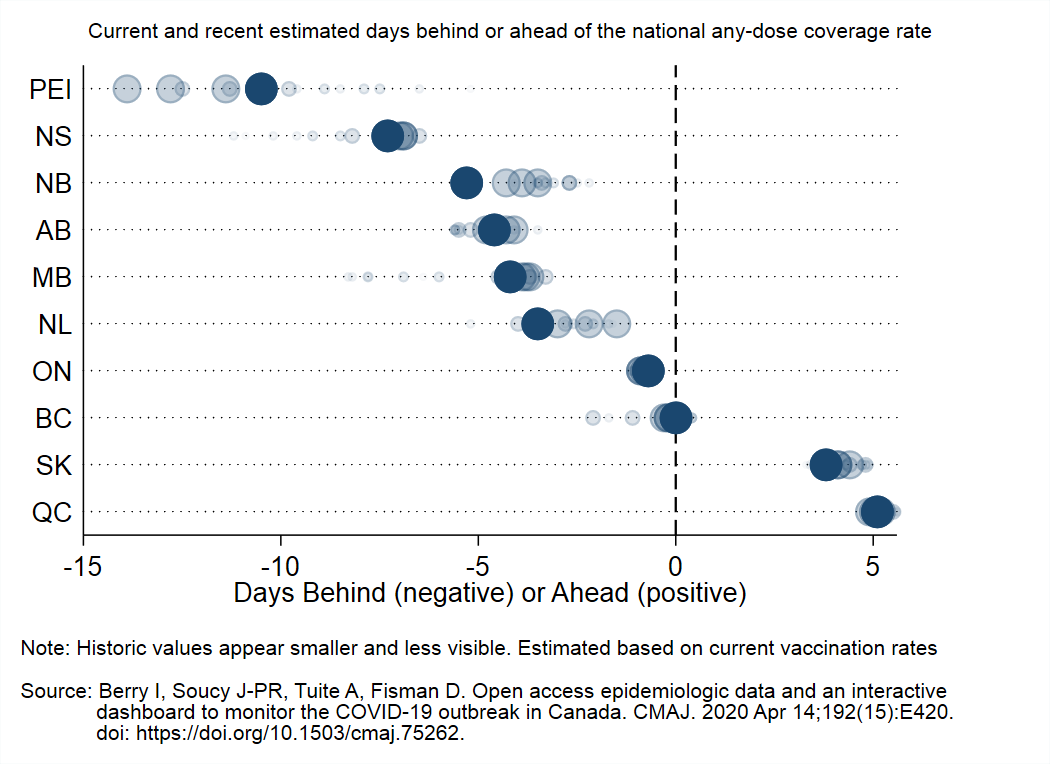
3rd graph shows days ahead/behind versus national average
1st graph shows how many days since each province had enough doses to cover their current usage.
2nd graph shows percent of eligible population that is newly vaccinated each day
3rd graph shows days ahead/behind versus national average
This animation shows each province& #39;s vaccination pace as a percent of the pace they need to each 80% first dose coverage by the end of June (based on how many they have already vaccinated and how much time is left).
Older data becomes less visible over time.
Older data becomes less visible over time.
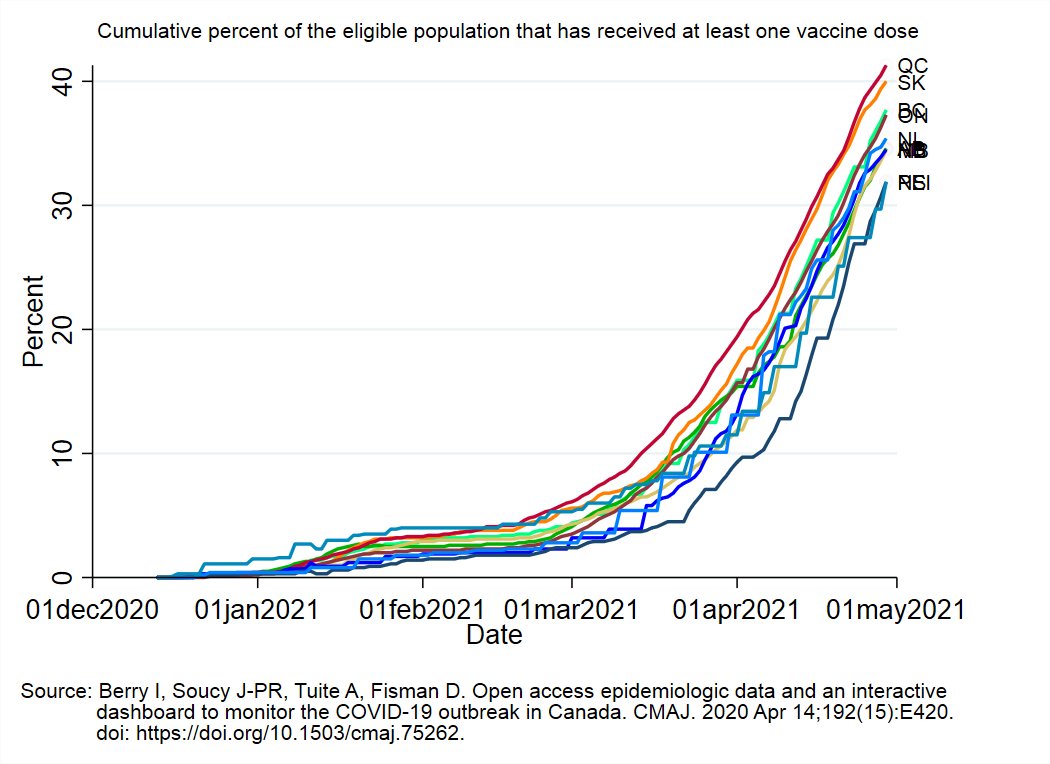
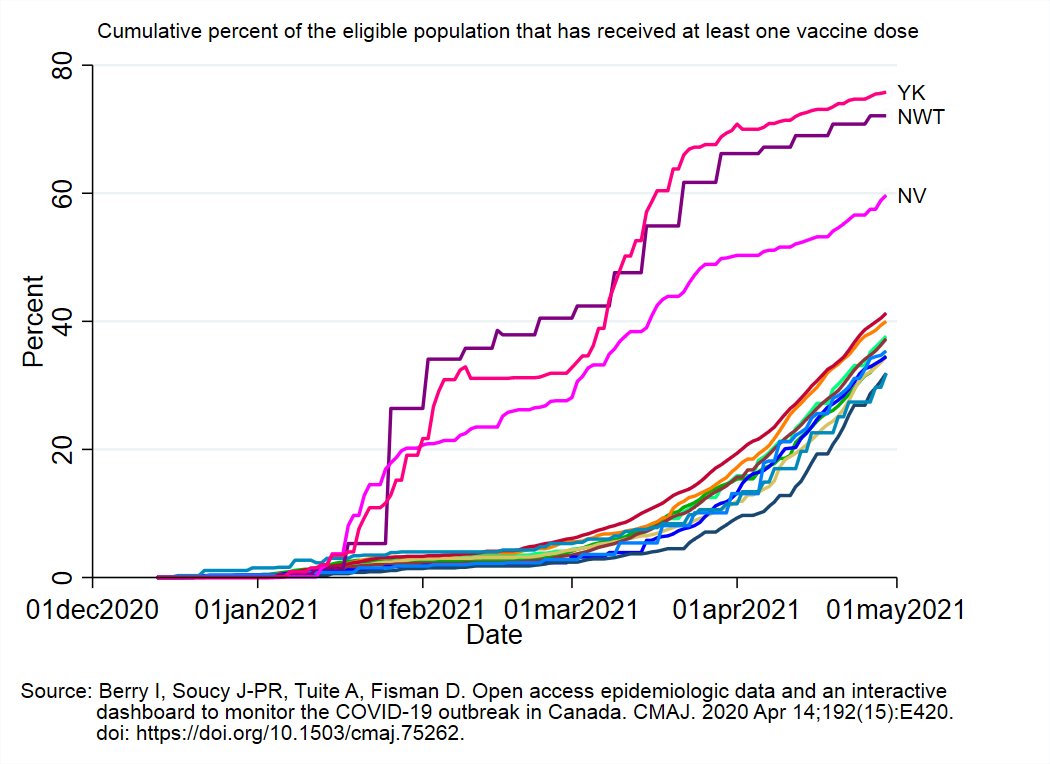
Here is the current percent of the eligible population of each province covered by at least one vaccine dose (Territories shown in the 2nd graph).
% eligible with at least one dose / % eligible that can get a first dose with what& #39;s in storage right now:
BC: 37.7%/5.1%
AB: 34.6%/4.7%
SK: 40.0%/4.1%
MB: 34.5%/8.7%
ON: 37.3%/4.9%
QC: 41.3%/3.6%
NB: 34.5%/6.2%
NS: 31.9%/8.2%
NL: 35.4%/6.8%
PEI: 31.9%/6.4%
BC: 37.7%/5.1%
AB: 34.6%/4.7%
SK: 40.0%/4.1%
MB: 34.5%/8.7%
ON: 37.3%/4.9%
QC: 41.3%/3.6%
NB: 34.5%/6.2%
NS: 31.9%/8.2%
NL: 35.4%/6.8%
PEI: 31.9%/6.4%
Nightly quick look to see how the rest of the country is doing, for context.
Several of the other provinces have turned the corner.
Several of the other provinces have turned the corner.
I forgot to mention it up-thread, but due to the backlog in tests, NS is shifting how it organizes its tests.
If you don& #39;t have symptoms and have no known exposures, the province wants you to get tested through the pop-up rapid test sites, instead of the appointment system.
If you don& #39;t have symptoms and have no known exposures, the province wants you to get tested through the pop-up rapid test sites, instead of the appointment system.

 Read on Twitter