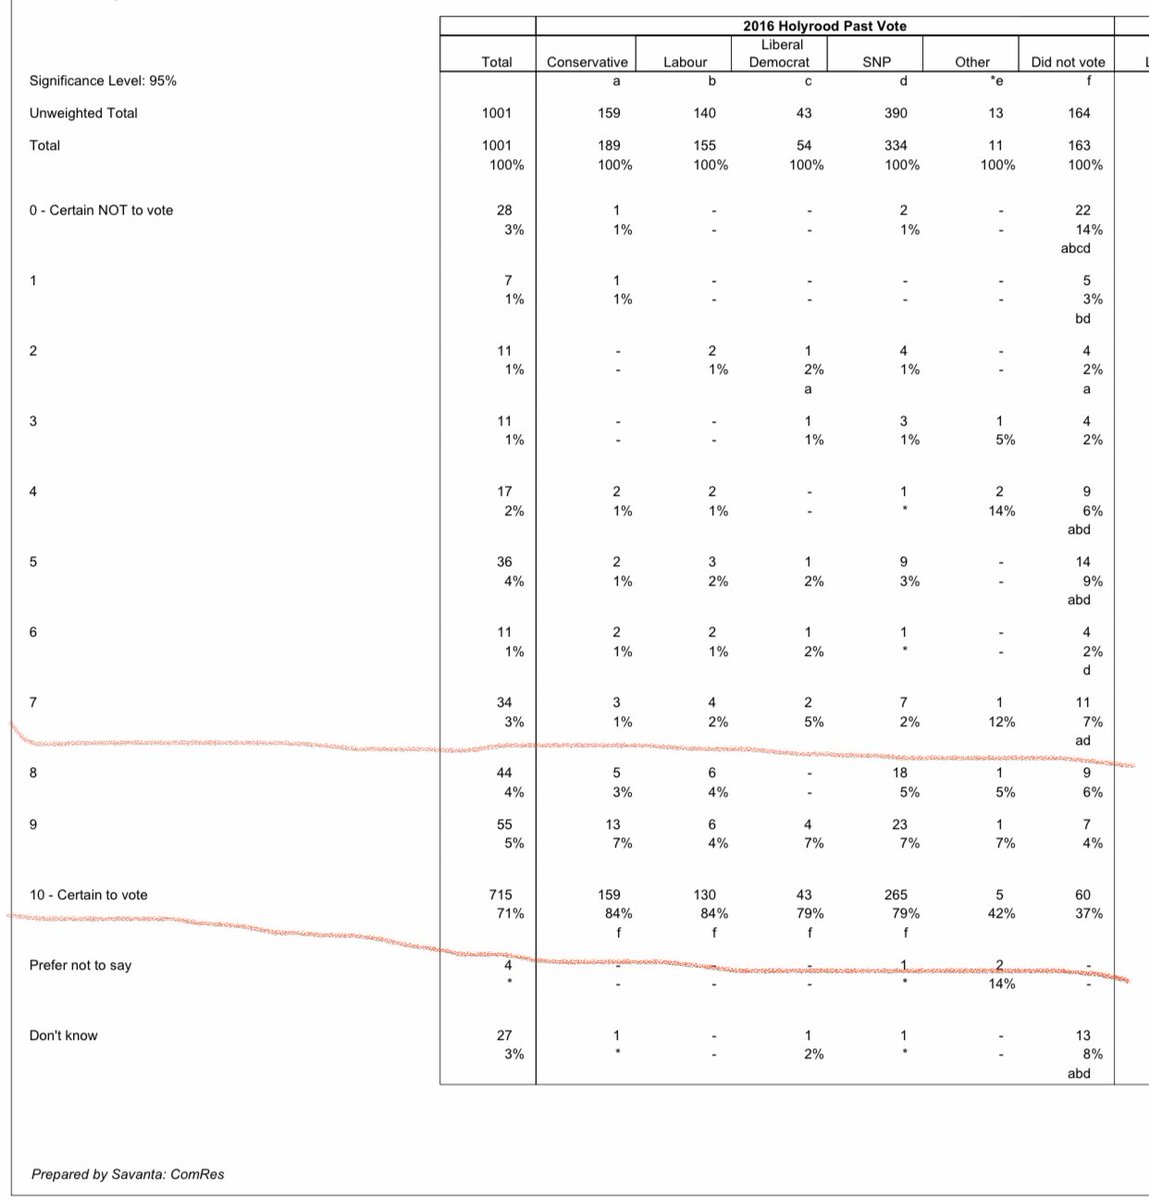
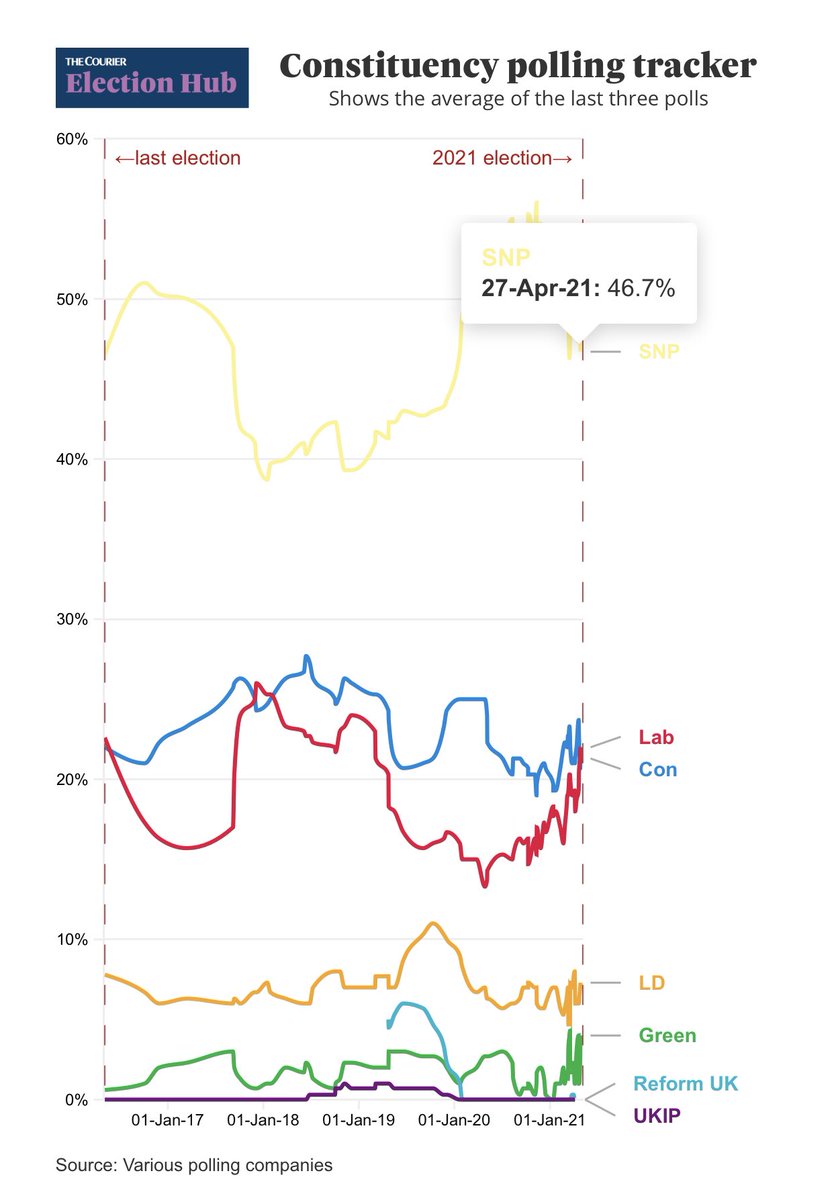
Thinking about turnout, motivation to vote & constituency vote shares for the parties as we face final week of #SP21.
 https://abs.twimg.com/emoji/v2/... draggable="false" alt="➡️" title="Pfeil nach rechts" aria-label="Emoji: Pfeil nach rechts"> How likely are the 2016 supporters of each party to turnout?
 https://abs.twimg.com/emoji/v2/... draggable="false" alt="➡️" title="Pfeil nach rechts" aria-label="Emoji: Pfeil nach rechts"> Are the SNP in trouble if they can’t get their less enthusiastic voters to vote?
(1/17)
(1/17)
SavantaComRes 29 April 2021
0 = certain NOT to vote
10= CERTAIN to vote
Let’s start by focusing on the % certain to vote (10) and also the most most likely to vote (8,9,10) for each party.
(2/17)
0 = certain NOT to vote
10= CERTAIN to vote
Let’s start by focusing on the % certain to vote (10) and also the most most likely to vote (8,9,10) for each party.
(2/17)
Totally certain to vote: 79% (10)
Most most likely to vote all added together: 91% (8,9,10)
(3/17)
Totally certain: 84% (10)
Most most likely: 92% (8,9,10)
(4/17)
Totally certain: 84% (10)
Most most likely: 94% (8,9,10)
(5/17)
Totally certain: 79% (10)
Most most likely: 86% (8,9,10)
(6/17)
Among those absolute certainties to vote, SNP & LibDem (79% each) are behind Labour (92%) & Conservatives (94%)
(7/17)
LibDems have lowest likelihood to turnout with 86%. SNP at 91% are very marginally behind Lab 92% & Con 94%
(8/17)
(9/17)
Again it’s the LibDem numbers falling behind the others among likely to vote.
But even adding everyone net likely (6-10) the SNP are still very marginally behind Labour & Conservatives. But there is not much in it.
(10/17)
Bottom line: if it’s a question of motivation to vote across the parties, those who voted LDem in 2016 are less motives than the others.
And those who voted SNP in 2016 are very marginally behind Lab and Con, but there isn’t much in it.
(11/17)
And those who voted SNP in 2016 are very marginally behind Lab and Con, but there isn’t much in it.
(11/17)
This is where things get more interesting(concerning) for the SNP...
(12/17)
All respondents likely to vote (6-10) constituency:
SNP 41% (
(13/17)
So: those who voted SNP in 2016 are very marginally behind those who voted Lab & Con in 2016 to turnout. But it’s extremely marginal difference.
BUT: among all those likely to vote, SNP constituency vote share is significantly BELOW their overall constituency polling ave
(15/17)
BUT: among all those likely to vote, SNP constituency vote share is significantly BELOW their overall constituency polling ave
(15/17)
In fact the SNP’s constituency vote among likely to vote voters is 5.7% LESS than the their overall constituency polling average.
 https://abs.twimg.com/emoji/v2/... draggable="false" alt="❗️" title="Rotes Ausrufezeichen" aria-label="Emoji: Rotes Ausrufezeichen">if SNP can’t motive their less likely to vote supporters, they could be in serious trouble in certain constituencies they currently hold
 https://abs.twimg.com/emoji/v2/... draggable="false" alt="❗️" title="Rotes Ausrufezeichen" aria-label="Emoji: Rotes Ausrufezeichen">
(16/17)
(16/17)
Source:
SavantaComRes April 29th 2021 poll tables:
…https://2sjjwunnql41ia7ki31qqub1-wpengine.netdna-ssl.com/wp-content/uploads/2021/04/Final_38028217-Scotland-Poll-Scotsman-20210428_Private__.pdf
Courier">https://2sjjwunnql41ia7ki31qqub1-wpengine.netdna-ssl.com/wp-conten... poll tracker:
https://www.thecourier.co.uk/fp/news/politics/scottish-politics/2116855/scottish-election-2021-track-the-latest-polling-data/
(17/17)">https://www.thecourier.co.uk/fp/news/p...

 Read on Twitter
 But what if we broaden the range even further to include anyone choosing 6-10 we see this:(9/17)" title="https://abs.twimg.com/emoji/v2/... draggable="false" alt="❓" title="Rotes Fragezeichen-Symbol" aria-label="Emoji: Rotes Fragezeichen-Symbol">But what if we broaden the range even further to include anyone choosing 6-10 we see this:(9/17)" class="img-responsive" style="max-width:100%;"/>
 All respondents likely to vote (6-10) constituency: SNP 41% (https://abs.twimg.com/emoji/v2/... draggable="false" alt="👈" title="Rückhand Zeigefinger nach links" aria-label="Emoji: Rückhand Zeigefinger nach links">https://abs.twimg.com/emoji/v2/... draggable="false" alt="❗️" title="Rotes Ausrufezeichen" aria-label="Emoji: Rotes Ausrufezeichen">https://abs.twimg.com/emoji/v2/... draggable="false" alt="❗️" title="Rotes Ausrufezeichen" aria-label="Emoji: Rotes Ausrufezeichen">https://abs.twimg.com/emoji/v2/... draggable="false" alt="❗️" title="Rotes Ausrufezeichen" aria-label="Emoji: Rotes Ausrufezeichen">)(13/17)" title="https://abs.twimg.com/emoji/v2/... draggable="false" alt="👀" title="Augen" aria-label="Emoji: Augen"> All respondents likely to vote (6-10) constituency: SNP 41% (https://abs.twimg.com/emoji/v2/... draggable="false" alt="👈" title="Rückhand Zeigefinger nach links" aria-label="Emoji: Rückhand Zeigefinger nach links">https://abs.twimg.com/emoji/v2/... draggable="false" alt="❗️" title="Rotes Ausrufezeichen" aria-label="Emoji: Rotes Ausrufezeichen">https://abs.twimg.com/emoji/v2/... draggable="false" alt="❗️" title="Rotes Ausrufezeichen" aria-label="Emoji: Rotes Ausrufezeichen">https://abs.twimg.com/emoji/v2/... draggable="false" alt="❗️" title="Rotes Ausrufezeichen" aria-label="Emoji: Rotes Ausrufezeichen">)(13/17)" class="img-responsive" style="max-width:100%;"/>


