I& #39;ve updated my voter turnout demographics 1986-2020 for the release of the 2020 Current Population Survey Voting and Registration Supplement. Graphs and code are available here: http://www.electproject.org/home/voter-turnout/demographics">https://www.electproject.org/home/vote...
My stats differ from the Census Bureau, who counts all persons who *never responded* to the CPS survey as "Did Not Vote." This was 15.7% of respondents in 2020. I remove missing data and reweight state level turnout rates to equal my VEP turnout rates http://www.electproject.org/home/voter-turnout/cps-methodology">https://www.electproject.org/home/vote...
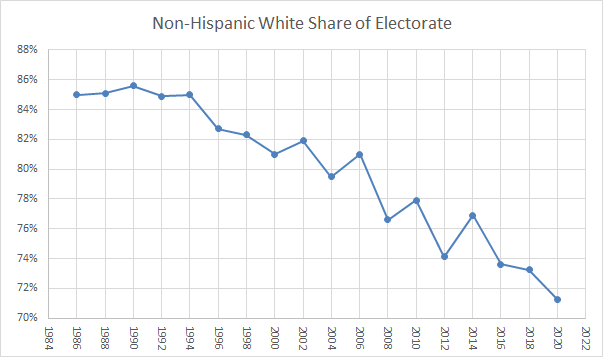
A big takeaway is that the electorate continues to diversify. 71.2% of the electorate was non-Hispanic White, down from 73.6% in 2016. This trend will likely continue and is a reason why Republicans have enacted voting laws that make it more difficult to vote
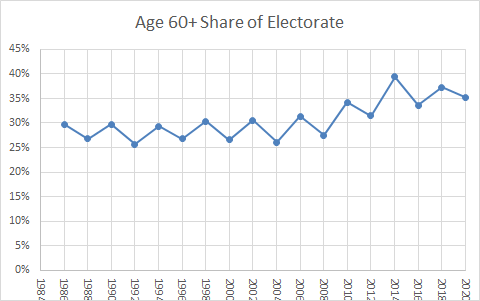
Countervailing the political ramifications of the growing diversity of the electorate is that the electorate continues to age, although the pace slowed a bit in the extremely high 2020 turnout election
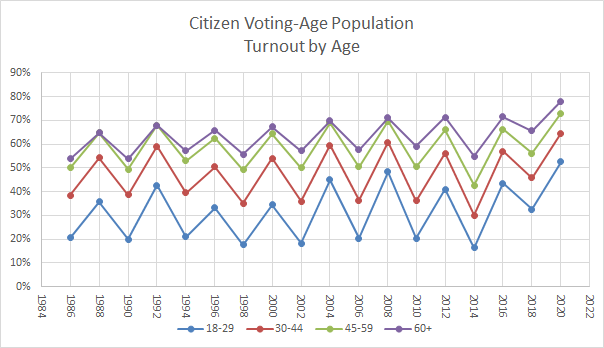
The difference in the turnout rates of citizens age 18-29 and age 60+ was 25.5 percentage points, which was the lowest age turnout gap since the 22.6 points in 2008, and second lowest in the CPS since 1986
Another closely watched group is Whites who do not hold a college degree. Their share in the overall citizen population continues to decrease, from 47.7% in 2016 to 42.7% in 2020. Their share of the electorate continued to decline as well, from 43.4% in 2016 to 39.9% in 2020
The growing diversity of the country, the fact that older people were less likely to go to college, and the growing levels of education among youth mean that non-Hispanic Whites without a college degree will likely continue to shrink in the population and the electorate
The Baby Boomers are reaching their peak turnout rates, but their turnout rates and share of the electorate will start declining as they become more elderly and pass on. I know the demos is destiny argument is trite, but we really are near the peak influence of Baby Boomers
Citizens age 18-29 had their highest turnout rate in the CPS data since 1986, at 52.5%, with the next highest the 48.4% in 2008. This should not be a surprise, when you have the highest overall turnout rate since 1900, lower turnout groups tend to see the largest increases
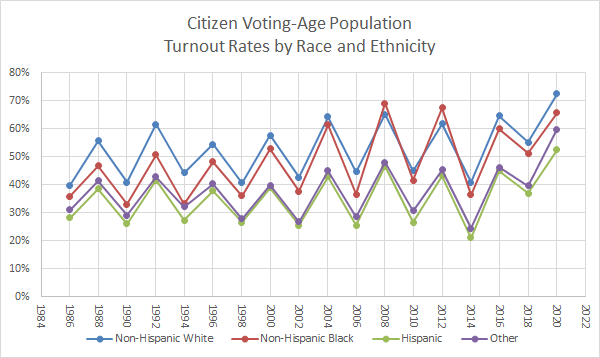
The 2020 election really stands out in the longer time-series. Turnout rates for every age range was at modern record levels

 Read on Twitter


