1/23 Ahead of @harrow_council& #39;s Cabinet meeting tonight to decide whether to remove 4 LTNs & 3 cycle lanes & continue 4 School Street trials, we thought we& #39;d take a look at the borough& #39;s pertinent #HealthyStreets results from our latest Scorecard. #Harrow
2/23 50% of journeys in #Harrow were made by sustainable modes ( #walking, #cycling or public transport) our 2020 Healthy Streets Scorecard revealed.
@gdh1961 @simon5096 @PhillipODell4 @krishnasuresh5 @adamswersky @Peymasad
#healthystreets https://www.datawrapper.de/_/g50jj/ ">https://www.datawrapper.de/_/g50jj/&...
@gdh1961 @simon5096 @PhillipODell4 @krishnasuresh5 @adamswersky @Peymasad
#healthystreets https://www.datawrapper.de/_/g50jj/ ">https://www.datawrapper.de/_/g50jj/&...
3/23 Less than 1% of journeys in #Harrow were by bike, 28% were walked and 22% were by public transport. (LTDS 3 yr average 2016/17-2018/19.)
#travel #walking #cycling #publictransport https://www.datawrapper.de/_/g50jj/ ">https://www.datawrapper.de/_/g50jj/&...
#travel #walking #cycling #publictransport https://www.datawrapper.de/_/g50jj/ ">https://www.datawrapper.de/_/g50jj/&...
4/23 The Mayor’s target is to increase the share of trips in London made by sustainable modes to 80% by 2041. #Harrow was one of 6 London boroughs which saw a decrease in sustainable mode share in our 2020 Scorecard results compared to our 2019 results. https://www.datawrapper.de/_/AI2ux/ ">https://www.datawrapper.de/_/AI2ux/&...
5/23 Less than a third of adults (32.3%) in #Harrow walked at least 5 times per week, which was below the Greater London average of 37.2%. (Two-year average 2016/17 and 2017/18.)
#walking https://www.datawrapper.de/_/RWp3B/ ">https://www.datawrapper.de/_/RWp3B/&...
#walking https://www.datawrapper.de/_/RWp3B/ ">https://www.datawrapper.de/_/RWp3B/&...
6/23 Less than 2% of adult residents cycled frequently in #Harrow (at least 5 times per week), well below the Greater London average of 4.3%. (Two-year average 2016/17 and 2017/18.)
#cycling #healthystreetsscorecard https://www.datawrapper.de/_/cPq2y/ ">https://www.datawrapper.de/_/cPq2y/&...
#cycling #healthystreetsscorecard https://www.datawrapper.de/_/cPq2y/ ">https://www.datawrapper.de/_/cPq2y/&...
7/23 #Harrow is one of the #London boroughs with the highest levels of car ownership. It has 115 #cars registered for every 100 households, 82 cars more/100HH than the lowest borough ownership in Islington of 33 cars/100HH. https://www.datawrapper.de/_/itIfV/ ">https://www.datawrapper.de/_/itIfV/&...
8/23 Our 2020 Scorecard #LowTrafficNeighbourhoods results revealed #Harrow had only 0.04 modal filters per mile of borough road length (12 filters in total). This was below the Greater London average of 0.11 modal filters per mile of road length. https://www.datawrapper.de/_/QnN0r/ ">https://www.datawrapper.de/_/QnN0r/&...
9/23 Just 5% of Harrow’s schools had traffic-free School Streets in October 2020 compared to a Greater London average of 12%. Source: Healthy Streets Scorecard and @MumsforLungs interim report on #SchoolStreets. https://www.datawrapper.de/_/JW23l/ ">https://www.datawrapper.de/_/JW23l/&...
10/23 Only 3.3% of roads in #Harrow had protected cycle lanes compared to a Greater London average of 5%.
#cycling #HealthyStreetsScorecard #healthystreets https://www.datawrapper.de/_/0nVvo/ ">https://www.datawrapper.de/_/0nVvo/&...
#cycling #HealthyStreetsScorecard #healthystreets https://www.datawrapper.de/_/0nVvo/ ">https://www.datawrapper.de/_/0nVvo/&...
11/23 There were 6.7 pedestrian and cyclist serious and fatal casualties in #Harrow per 100,000 daily journey stages on average annually, less than the Greater London average of 7.6. (3 year average using data from 2016-2018.) #roadsafety https://www.datawrapper.de/_/N6OVT/ ">https://www.datawrapper.de/_/N6OVT/&...
12/23 Let’s also look at how #Harrow is performing against some of the Local Implementation Plan 3 targets the @MayorofLondon has set the borough in order to help achieve the Mayor’s #Transport Strategy priorities for #London.
13/23 Every London borough has LIP3 targets for a range of indicators and these are different for central, inner & outer London. You can find out each borough’s targets in a TfL spreadsheet named ‘LIP3 MTS Borough outcomes’: http://planning.data.tfl.gov.uk"> http://planning.data.tfl.gov.uk
14/23 #Harrow’s Local Implementation Plan target for sustainable mode share is 50% for 2021 & 64% for 2041, which the borough was on track to achieve based on the last London Travel Demand Survey. (Harrow had a 53% sustainable mode share: LTDS 3 year-average 2017/18-2019/20.)
15/23 #Harrow is not on track to achieve its LIP targets for the % of residents doing at least the 20 mins of #activetravel a day they need to stay healthy. Only a quarter achieved this (LTDS 3 year-average 2017/18-2019/20), whereas the target for 2021 is 34% & 70% for 2041.
16/23 @harrow_council’s Transport LIP3 stated that “This will be an extremely difficult target for #Harrow to achieve". It noted that #obesity & #diabetes levels are high & activity levels are low in the borough.
17/23 “The total prevalence of people in Harrow with #diabetes…is estimated to be 10.5% of the population; this is the second highest local authority prevalence in England.” - #Harrow Transport Local Implementation Plan 2019/20- 2021/22
18/23 None of #Harrow’s residents lived within 400m of the London-wide strategic cycle network as of November 2020. The borough’s LIP target is 10% for 2021 and 51% by 2041.
#cycling
#cycling
19/23 There were 56 deaths and serious injuries (KSIs) from road collisions in #Harrow in 2019. The borough’s LIP target for KSIs in 2022 is 38 and zero for 2041.
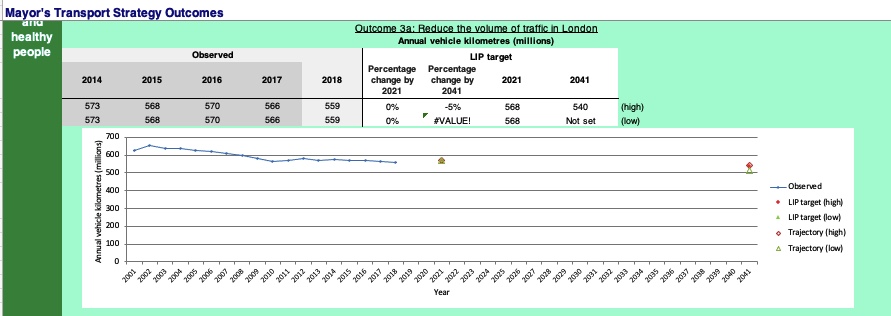
20/23 In 2018, traffic levels in #Harrow were 559 million annual vehicle kilometres. At that point, the borough was on a trajectory to meet its LIP target of 568m annual vehicle km by 2021. Its 2041 target is 540m annual km, a 5% reduction on its 2015 #traffic levels.
21/23 In 2019, there were 103,572 licensed #cars owned in #Harrow. This chart suggests the borough is not on track to reduce car ownership to LIP target levels of 100,600 cars by 2021 and 100,800 by 2041.
#carownership
#carownership
22/23 In 2016, 141,800 tonnes of CO2, 390 tonnes of NOx, 48 tonnes of PM10 and 25 tonnes of PM2.5 were emitted from road #transport in #Harrow. The borough’s LIP targets for 2021 are 124,800 tonnes of CO2, 210 tonnes of NOx, 43 tonnes of PM10 and 21 tonnes of PM2.5.
23/23 @harrow_council declared a Climate Emergency in 2019.
Our next #HealthyStreetsScorecard results for all #London boroughs will be published this July.
#Harrow #climateemergency
Our next #HealthyStreetsScorecard results for all #London boroughs will be published this July.
#Harrow #climateemergency

 Read on Twitter


