Charts: Bitcoin& #39;s UTXO volume profile
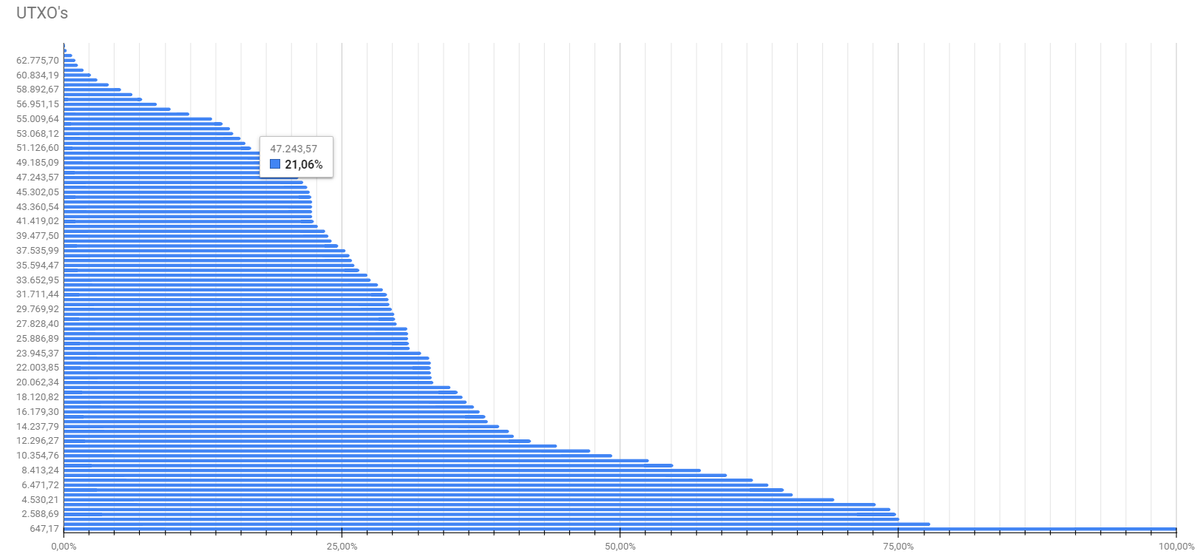
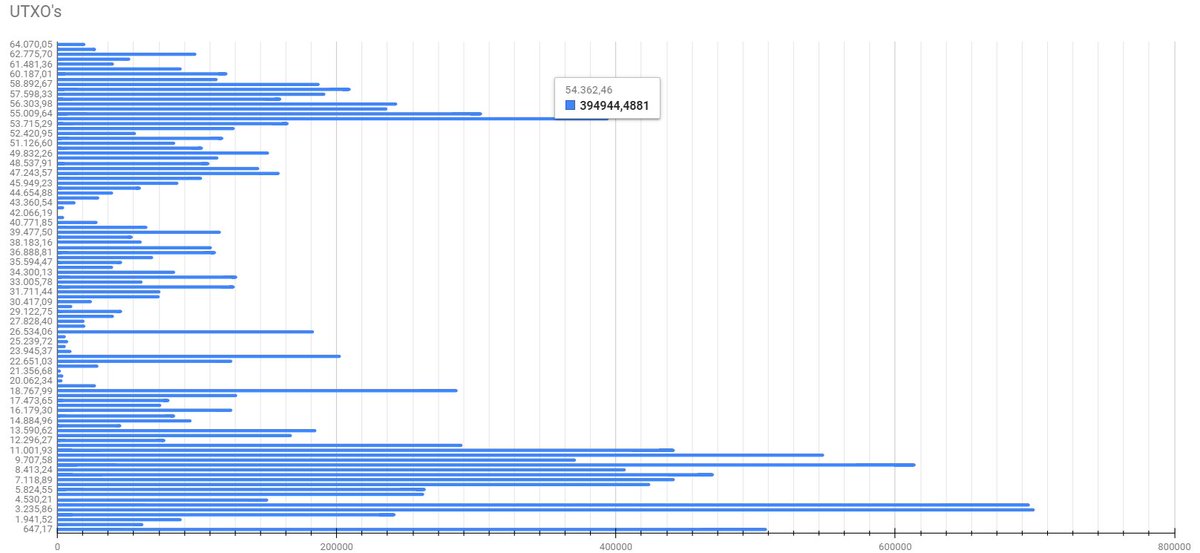
>20% of UTXO volume occured above $47000 with the moat of the volume at $54-55K
That makes it resistance - if price can travel through the cluster to the upside, we have a large accumulation base
If not, there is a lot of volume trapped 1/
>20% of UTXO volume occured above $47000 with the moat of the volume at $54-55K
That makes it resistance - if price can travel through the cluster to the upside, we have a large accumulation base
If not, there is a lot of volume trapped 1/
When volume is trapped in the wrong hands, markets tend to move against those positions as a result
In other words, if strong hands accumulated, weak hands end up chasing the market up
If strong hands distributed, weak hands end up capitulating in a panic dump 2/
In other words, if strong hands accumulated, weak hands end up chasing the market up
If strong hands distributed, weak hands end up capitulating in a panic dump 2/
Larger players are more price agnostic than smaller traders. They accumulate as supply is available and distribute as demand is present.
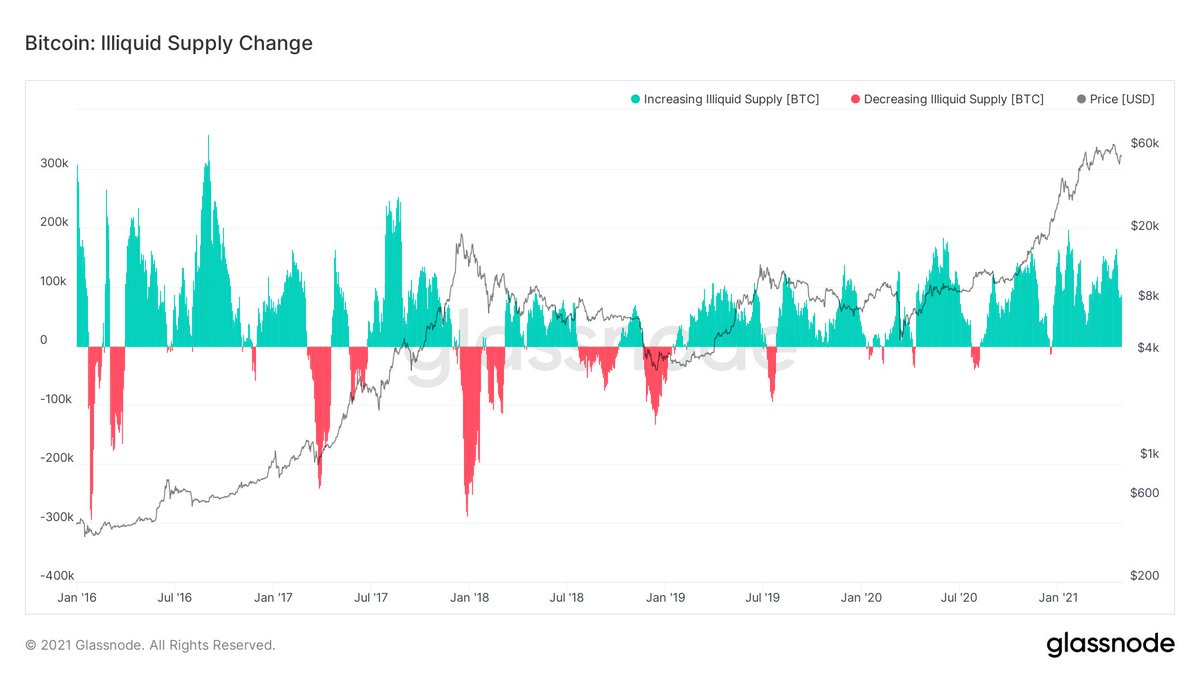
The charts in tweet 2 can be deceiving: price can travel corrective against accumulating strong hands and vice versa 3/
The charts in tweet 2 can be deceiving: price can travel corrective against accumulating strong hands and vice versa 3/
Eventually this results in an imbalance of supply & demand, setting up a new trend
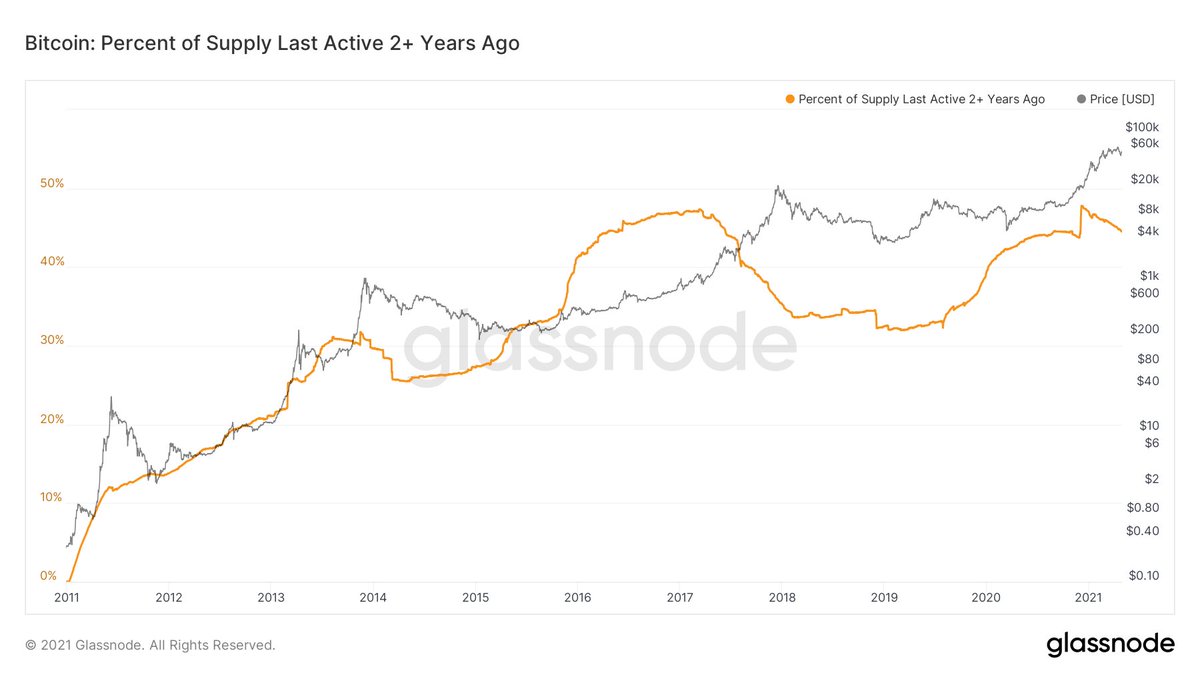
Longer term hodlers have started distributing, but are far from finished 4/
Longer term hodlers have started distributing, but are far from finished 4/
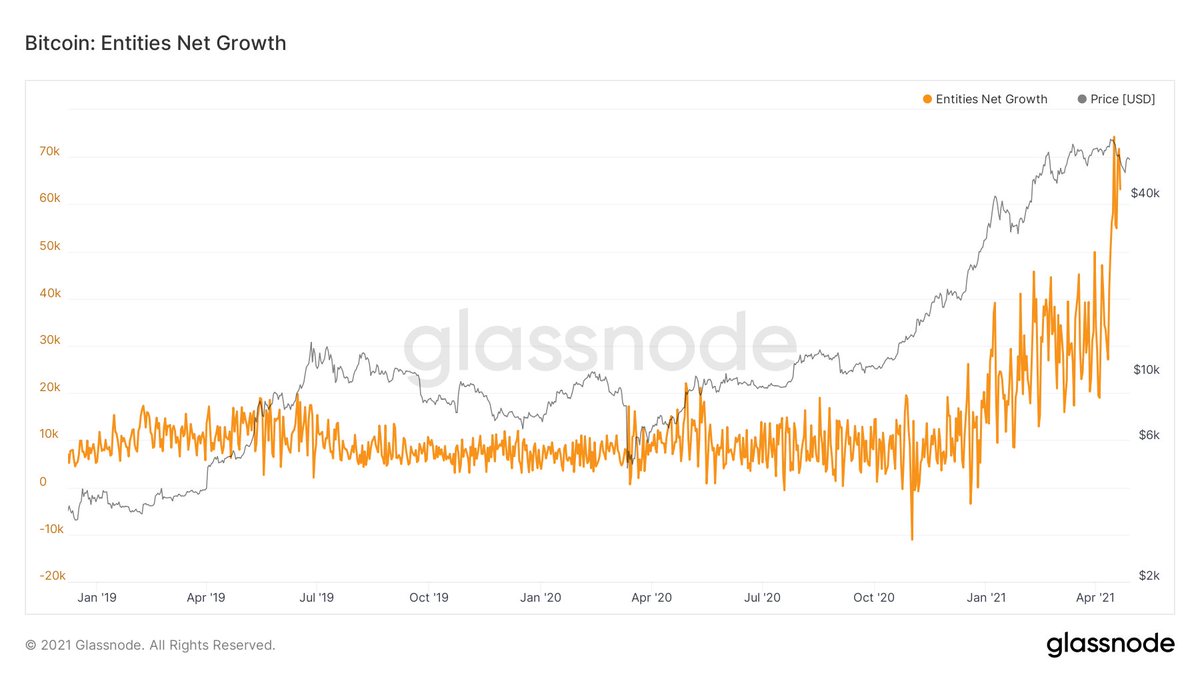
With the arrival of many new entities, if the supply & demand imbalance resolves bullish, the herd is arriving at rapid pace to match the need of long term hodlers taking profit 5/
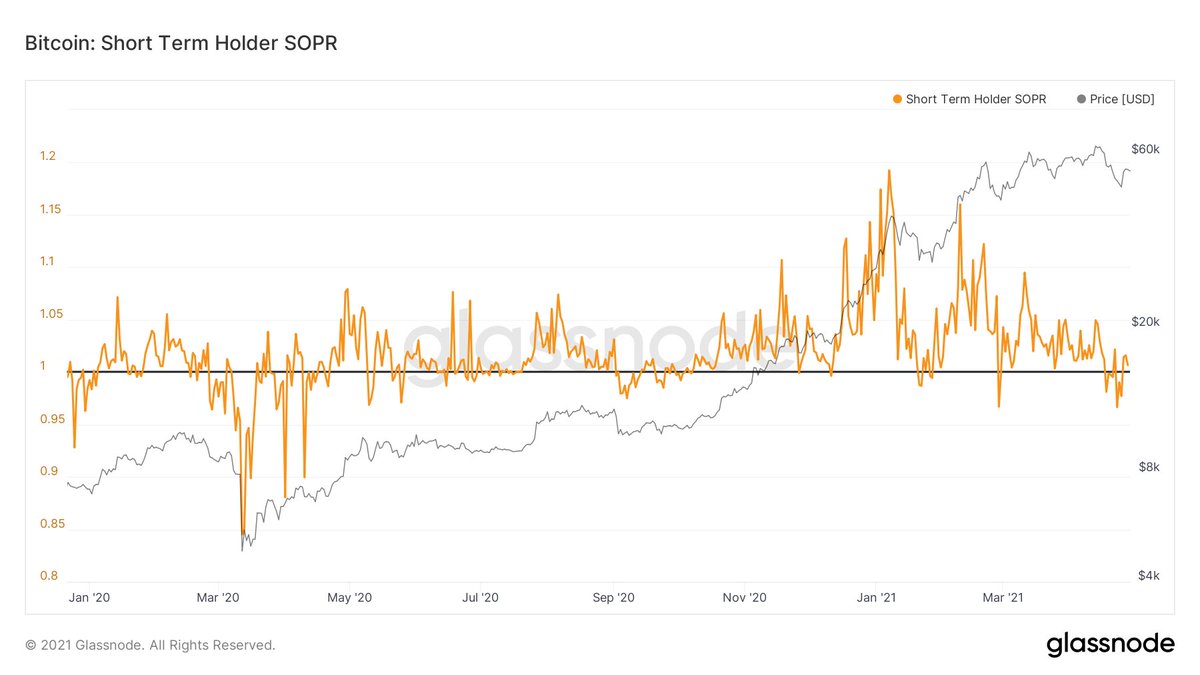
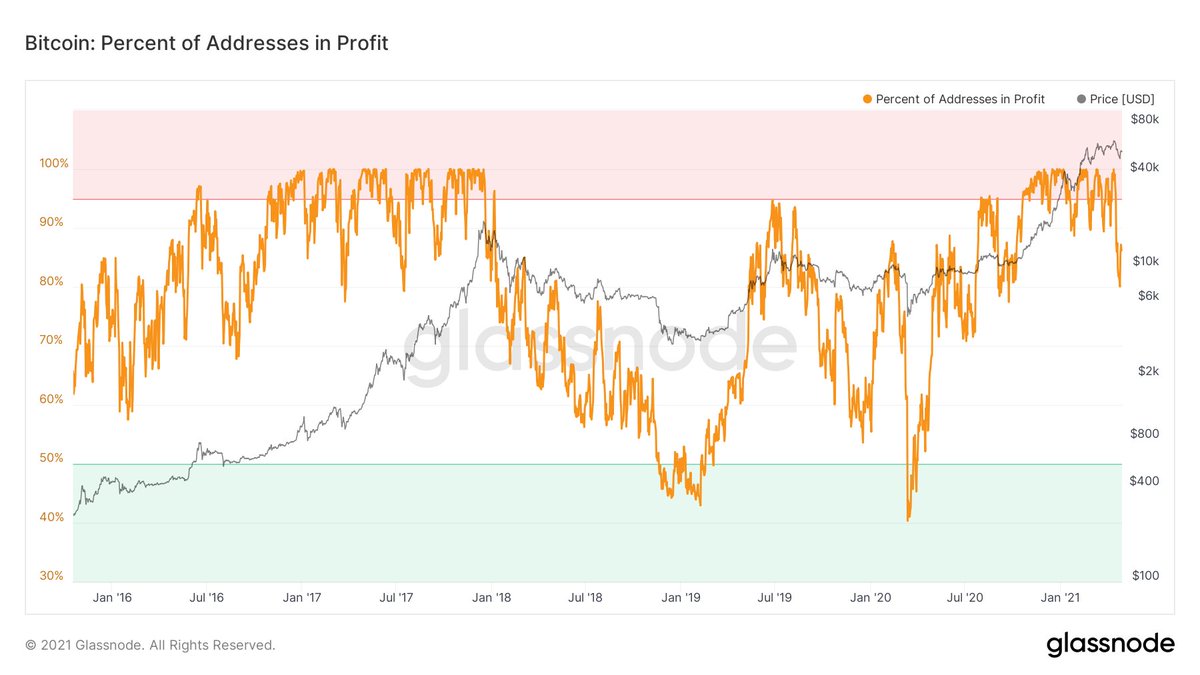
Short term holders have been selling at a loss, indicated by the negative readings on the first chart & a relatively large percentage of addresses were/are at a loss for bull market conditions 6/
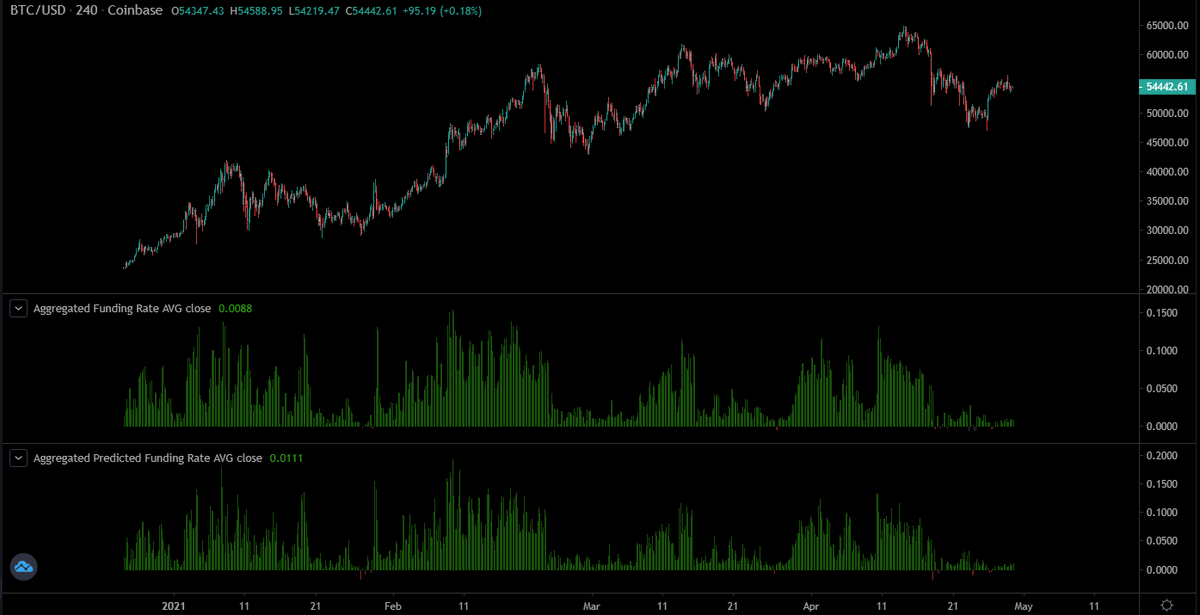
Sentiment readings have dropped to levels not seen in this bull run & funding on perpetual swaps confirms neutral/balanced market positioning
We have all the ingredients, but someone needs to start cooking 7/7
We have all the ingredients, but someone needs to start cooking 7/7

 Read on Twitter