This seems odd. National Grid& #39;s Future Energy Scenarios models 4 decarbonisation scenarios to 2050. Most transport is electrified. Heat is a combination of electricity and hydrogen. Yet they envisage minimal-increase-to-major-reduction in peak electricity demand.
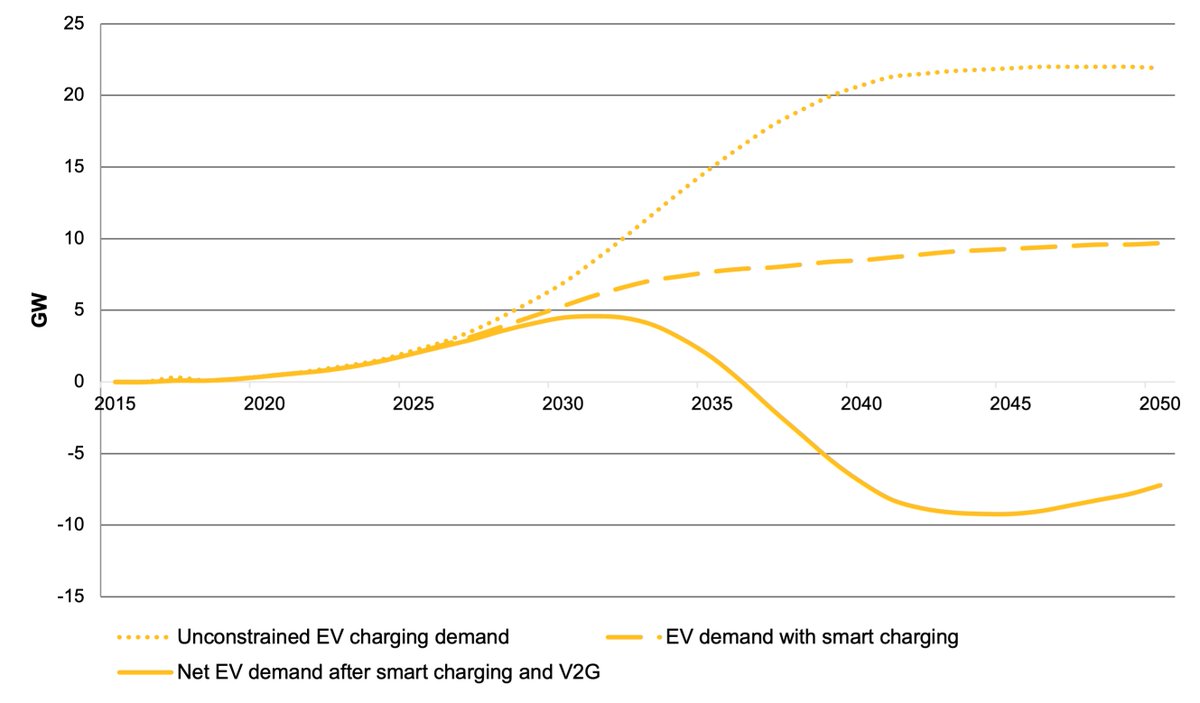
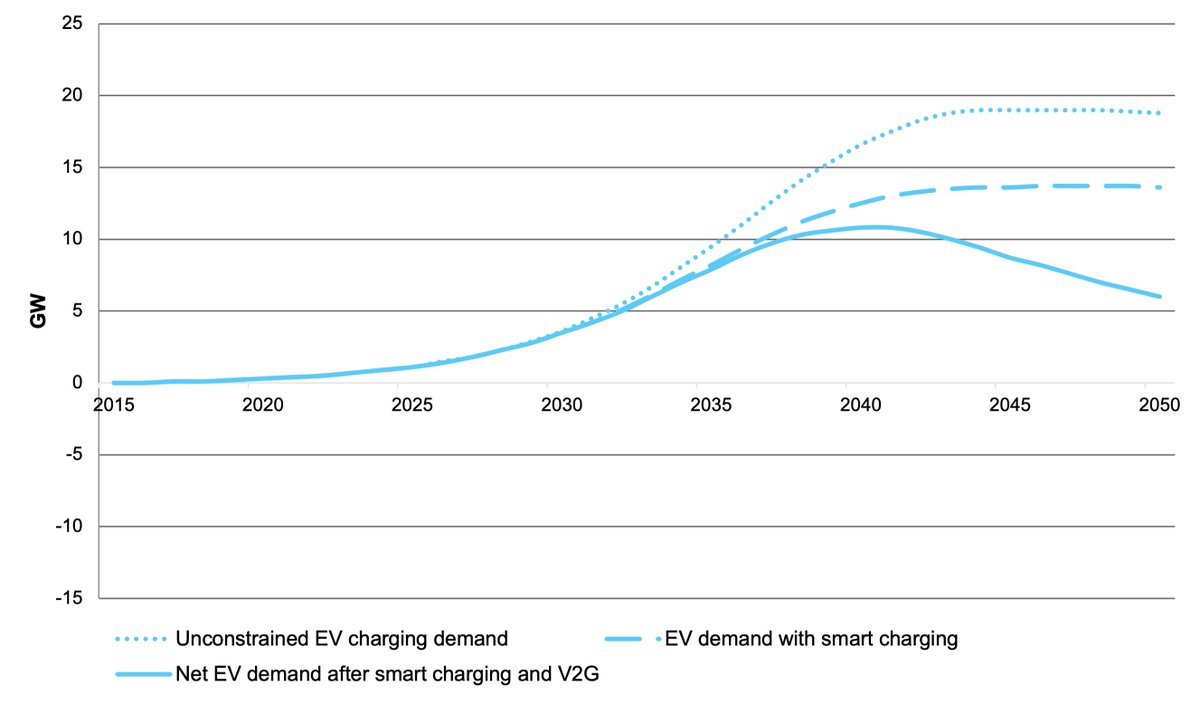
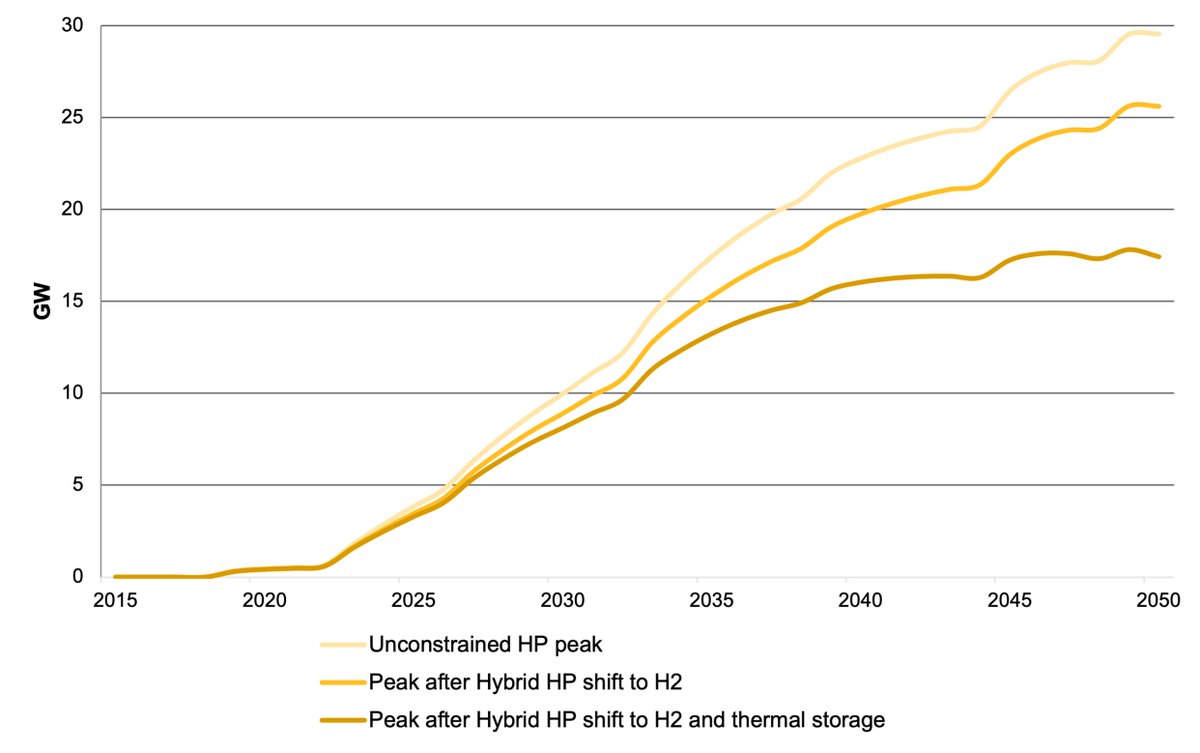
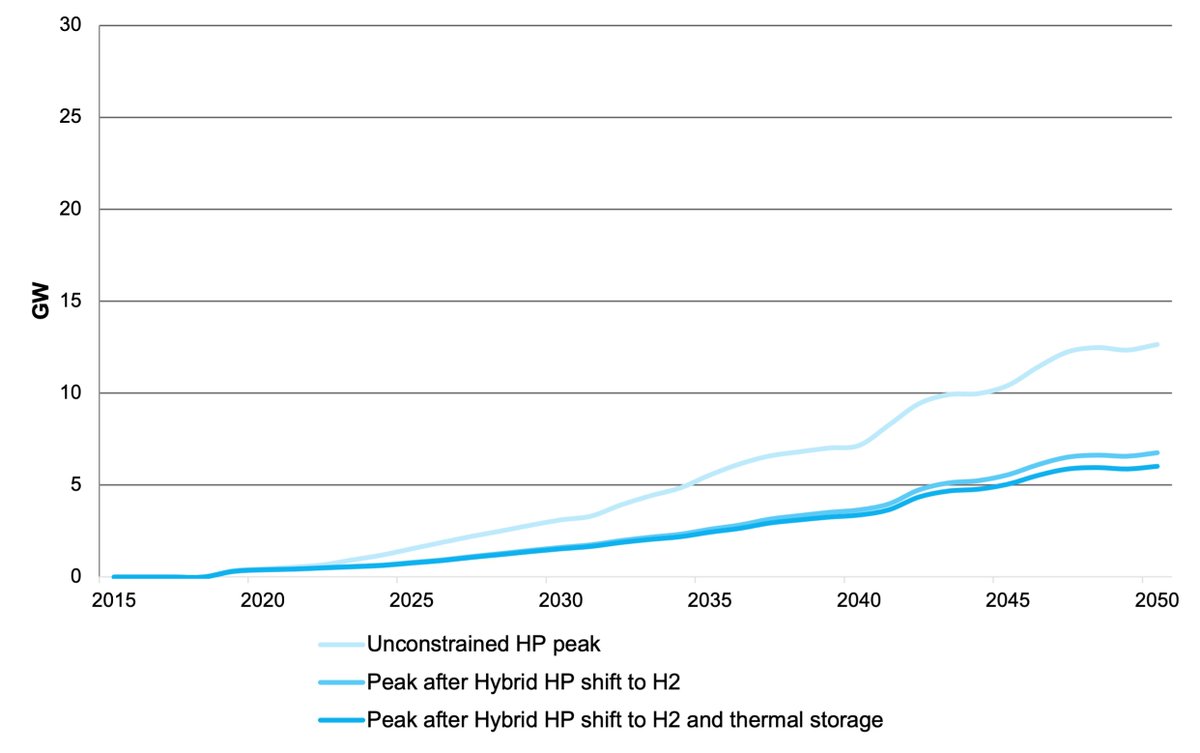
The key seems to be that, although heat pumps add to peak demand, EV charging is switched from another addition to demand to a way of reducing peak demand in some scenarios. These are heroic assumptions about consumer behaviour. Yet they don& #39;t seem to add up in their own right.
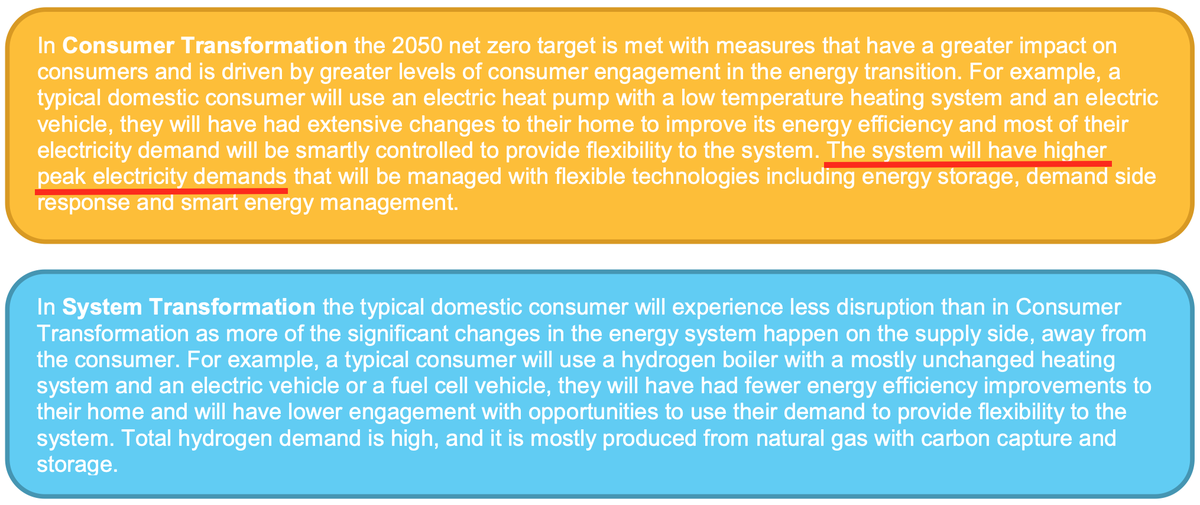
In the 1st chart, Consumer Transformation (CT) is lower than System Transformation (ST). But in the following charts, peak HP demand outweighs V2G balancing services far more in CT than ST. This fits with the scenario descriptions, which say CT has "higher peak electric demands".
This may be cock-up or @ng_eso may have an explanation. The numbers may be squared, but I don& #39;t think the text can be. It highlights that models as complex as those of our energy systems in 30 years time are likely to be opaque to their creators as much as to the rest of us.
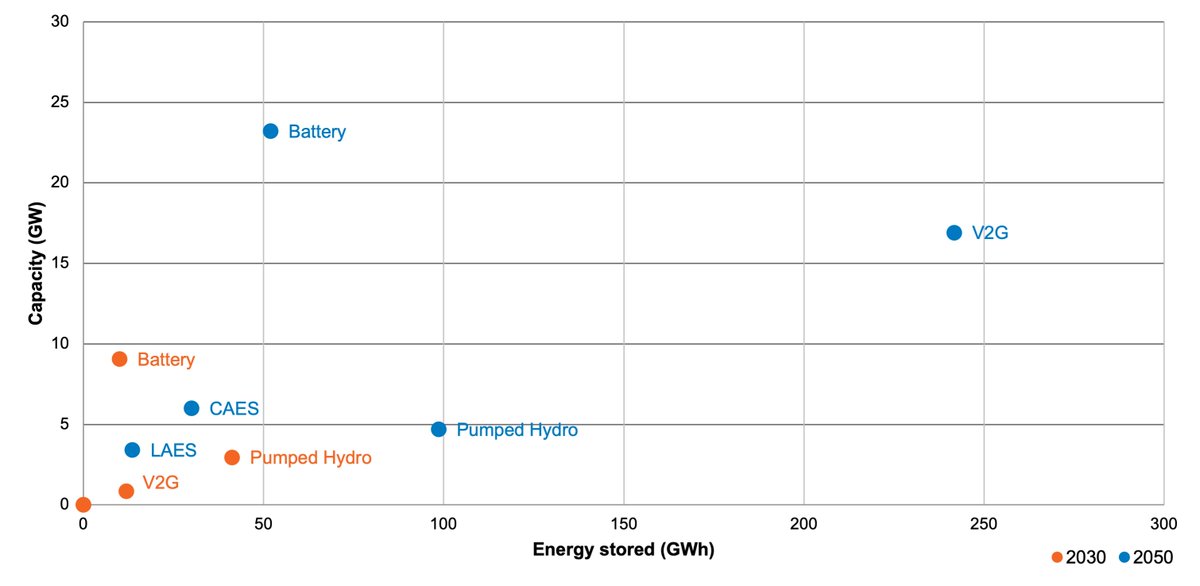
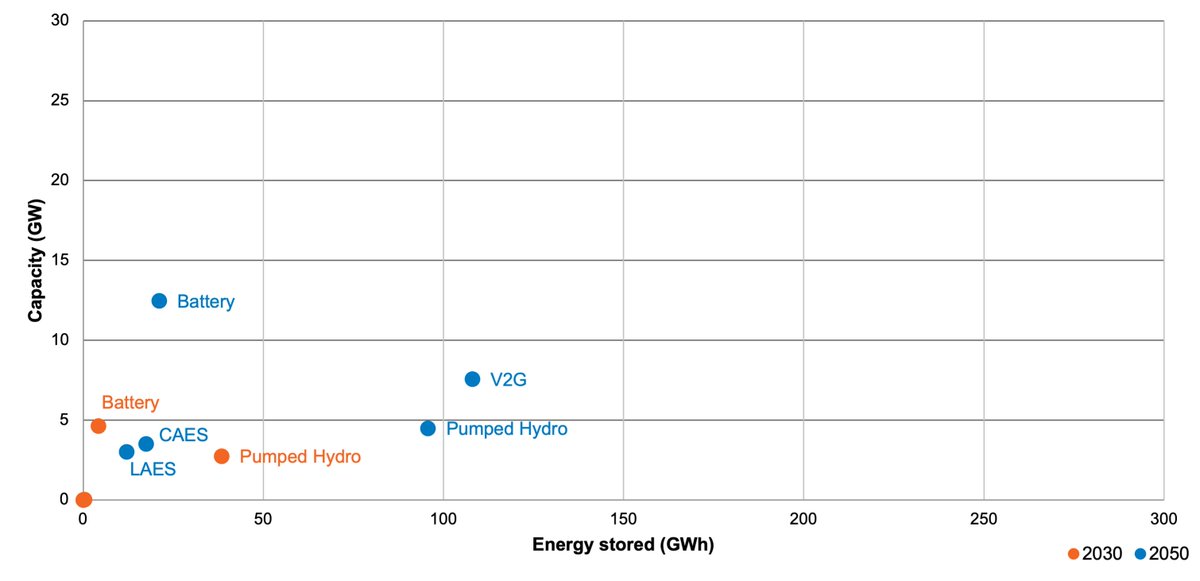
Interestingly, they envisage a tiny amount of electricity storage relative to the system stresses of a system that has disposed of low-cost dispatchable generation (Chart 1: CT; 2: ST). The longest-cycle tech is pumped hydro at c.20 hrs. Total GWh are a few hours of demand.
If not coal, gas or storage for balancing electrified energy, it must be interconnectors? They certainly plan a big increase in capacity (CT: 25 GW; ST: 21.5). But the flows reverse, so exports massively dominate imports. ST barely sees any import increase at all.
Hardly a surprise because they& #39;ve got massively more intermittents ([CT/ST (GW):] Offshore: 83/88; Onshore: 48/29; Solar: 75/56), and flatter electricity demand (451/374 TWh without a big increase in peak). They& #39;re assuming they can dump the excess intermittents on the neighbours
as though the neigbours (exc. Norway) won& #39;t have similar excesses of intermittents. It& #39;s a magic bullet for the excess but not for a shortfall.
Hydrogen seems to be their deus ex machina. We& #39;ve just got to ignore the inefficiency and the economics of load factors of 8-13%.
Hydrogen seems to be their deus ex machina. We& #39;ve just got to ignore the inefficiency and the economics of load factors of 8-13%.
& H2 isn& #39;t sufficient, because such low LFs mean only 8-14 TWh p.a. It& #39;s hard to see how they deal with the scale of the imbalances.
They use AFRY& #39;s BID3 for hourly modelling, but neither model nor outputs are publicly available. They seem to have assumed away a lot of variance.
They use AFRY& #39;s BID3 for hourly modelling, but neither model nor outputs are publicly available. They seem to have assumed away a lot of variance.
That& #39;s what I was feeling towards when I started this geeky thread. Most of the "Net Zero will be OK" models aggregate the balancing problems away. I was looking for ones that don& #39;t. So far, I& #39;ve found two (sort of): NG/FES/BID3 and BEIS/DDM. But you can& #39;t check either of them.
Not only are the models not publicly available, but they don& #39;t publish the outputs either. We& #39;re supposed to trust they& #39;re well-designed & error-free. But the aggregated figures they support look incredible. I suspect they& #39;re an "inverted pyramid of piffle". But I can& #39;t test it.
There should be a rule that any model that is used to develop or justify policy should be publicly available. And the outputs of those models should be published so anybody can analyse them. Otherwise, it& #39;s expert rule without any means for outsiders to challenge expert failure.

 Read on Twitter
