Some analysis on the #VaccinationDrive of #COVID19India
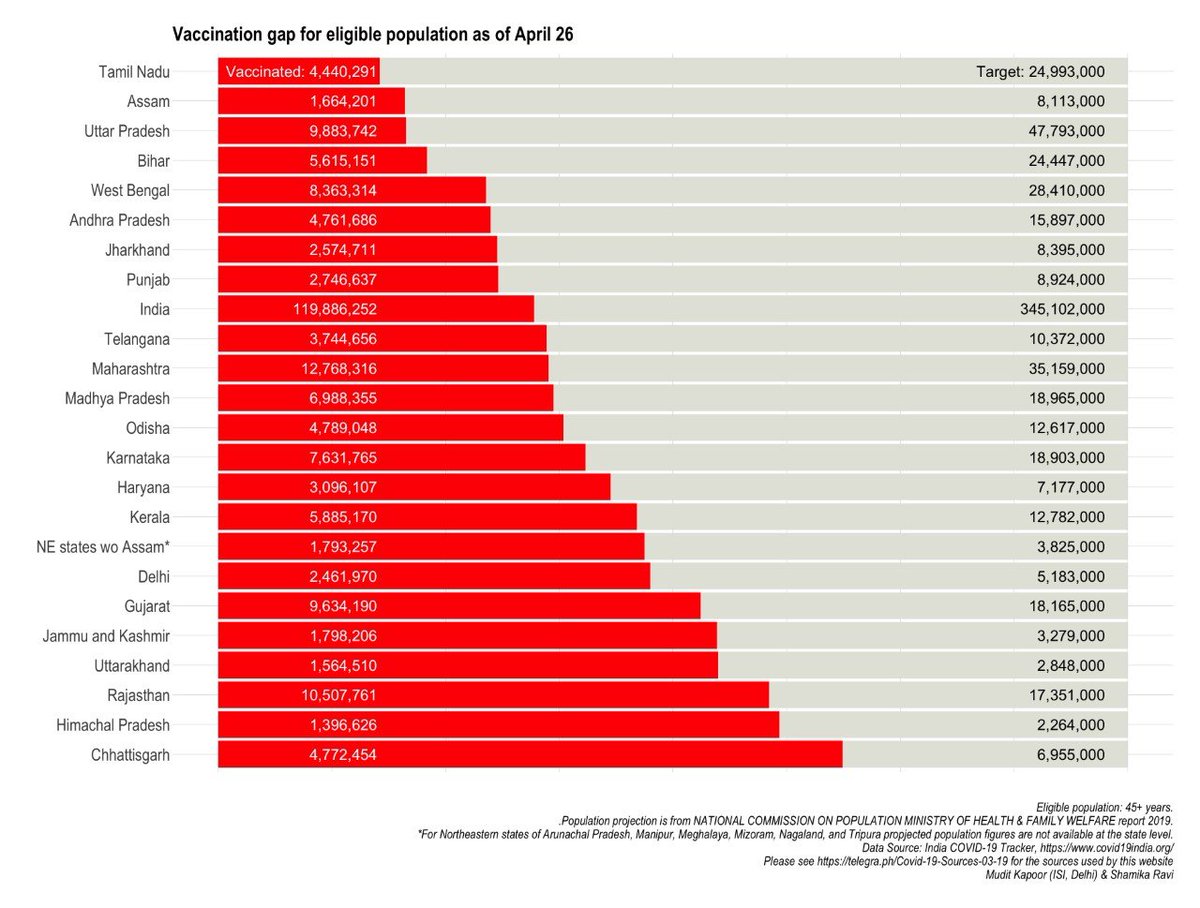
1) India has vaccinated 35% of the current eligible population (45+ years) overall. It& #39;s a long way home.
2) Big variations across states: Tamil Nadu has only covered 18% of eligible pop while Chhattisgarh has covered 69%.
1) India has vaccinated 35% of the current eligible population (45+ years) overall. It& #39;s a long way home.
2) Big variations across states: Tamil Nadu has only covered 18% of eligible pop while Chhattisgarh has covered 69%.
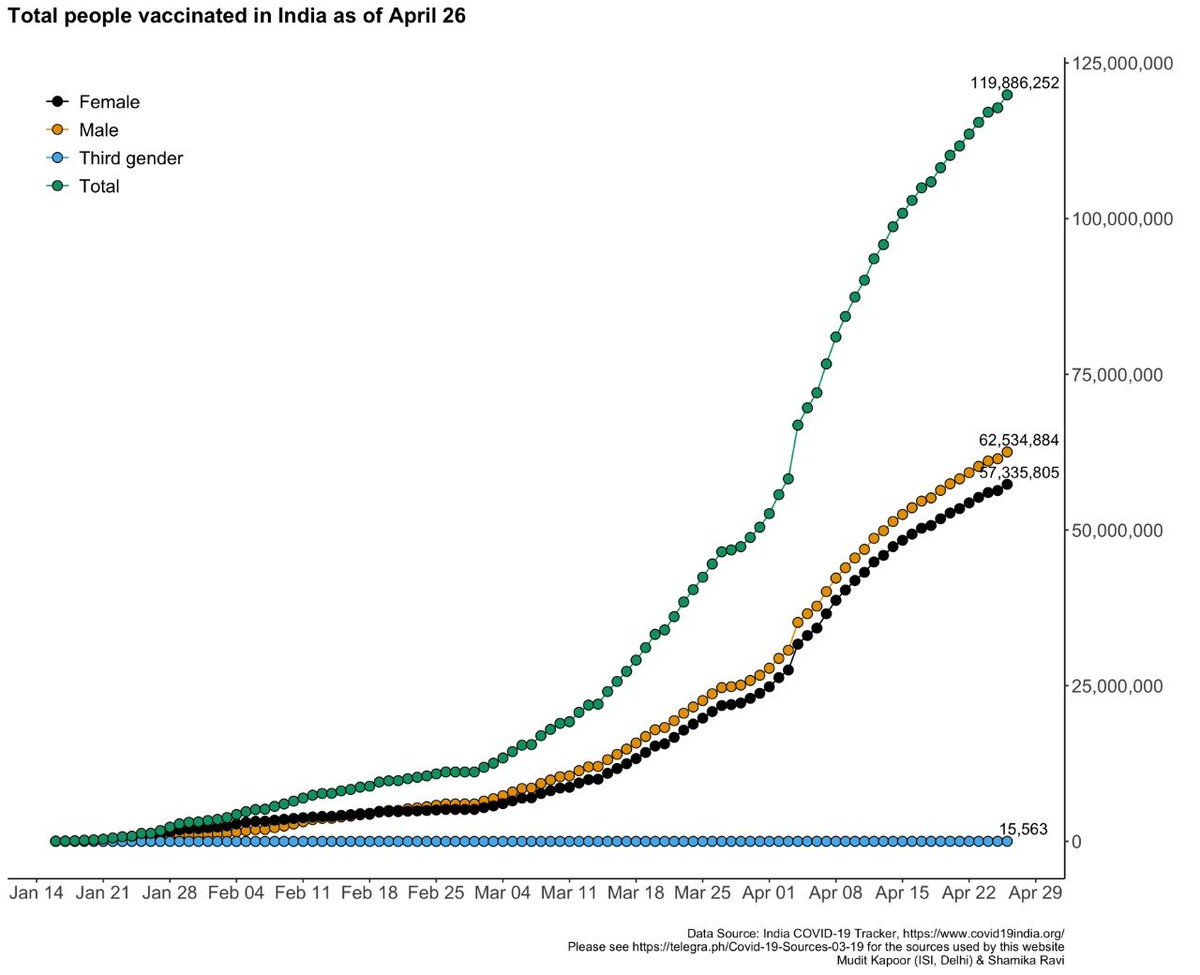
Total number of people vaccinated: 119,886,252
Male: 62,534,884
Female: 57,335,805
Third gender: 15,563
Male: 62,534,884
Female: 57,335,805
Third gender: 15,563
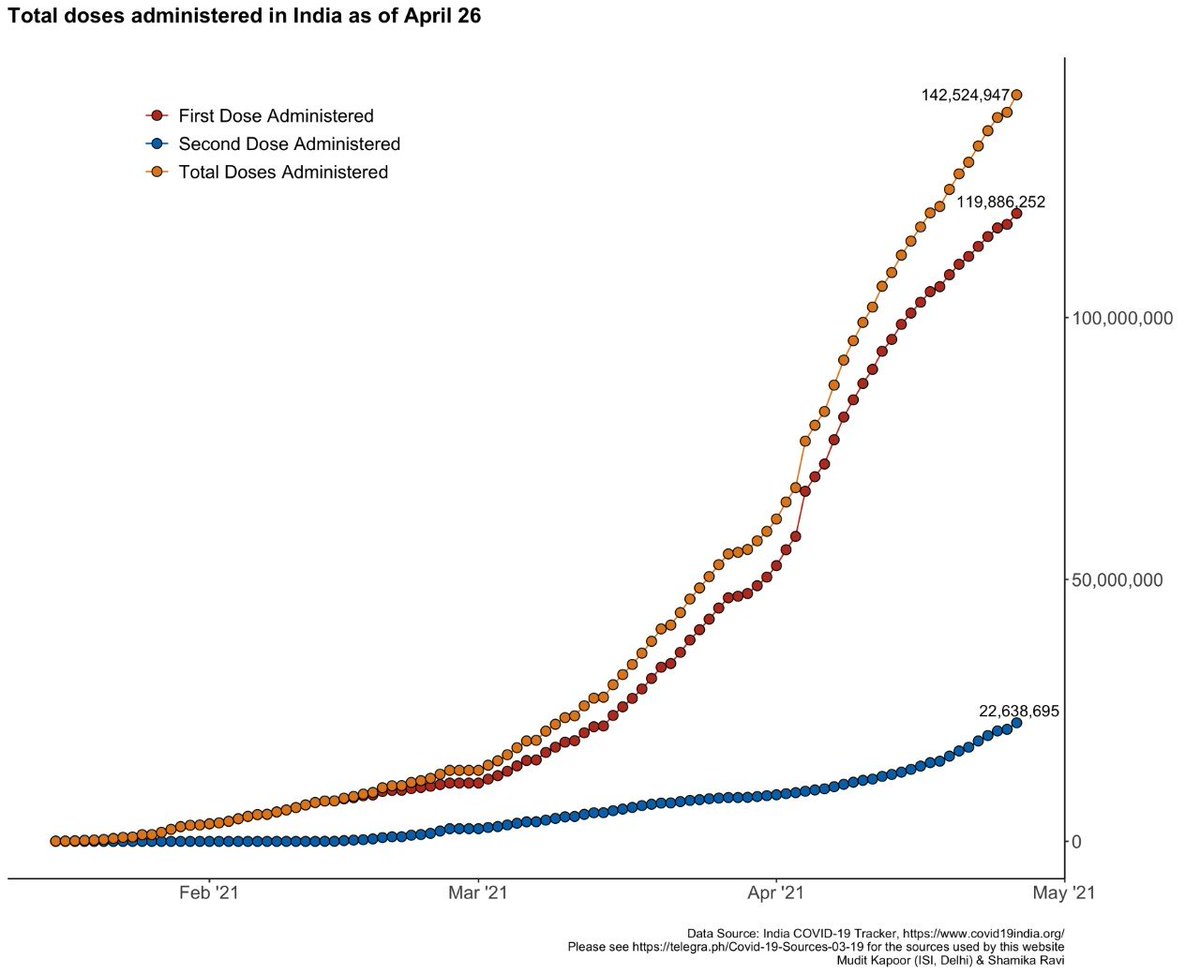
Eventually, the vaccination drive is not only a race against the virus (which is spreading fast right now) but also a protection from future waves of infection.
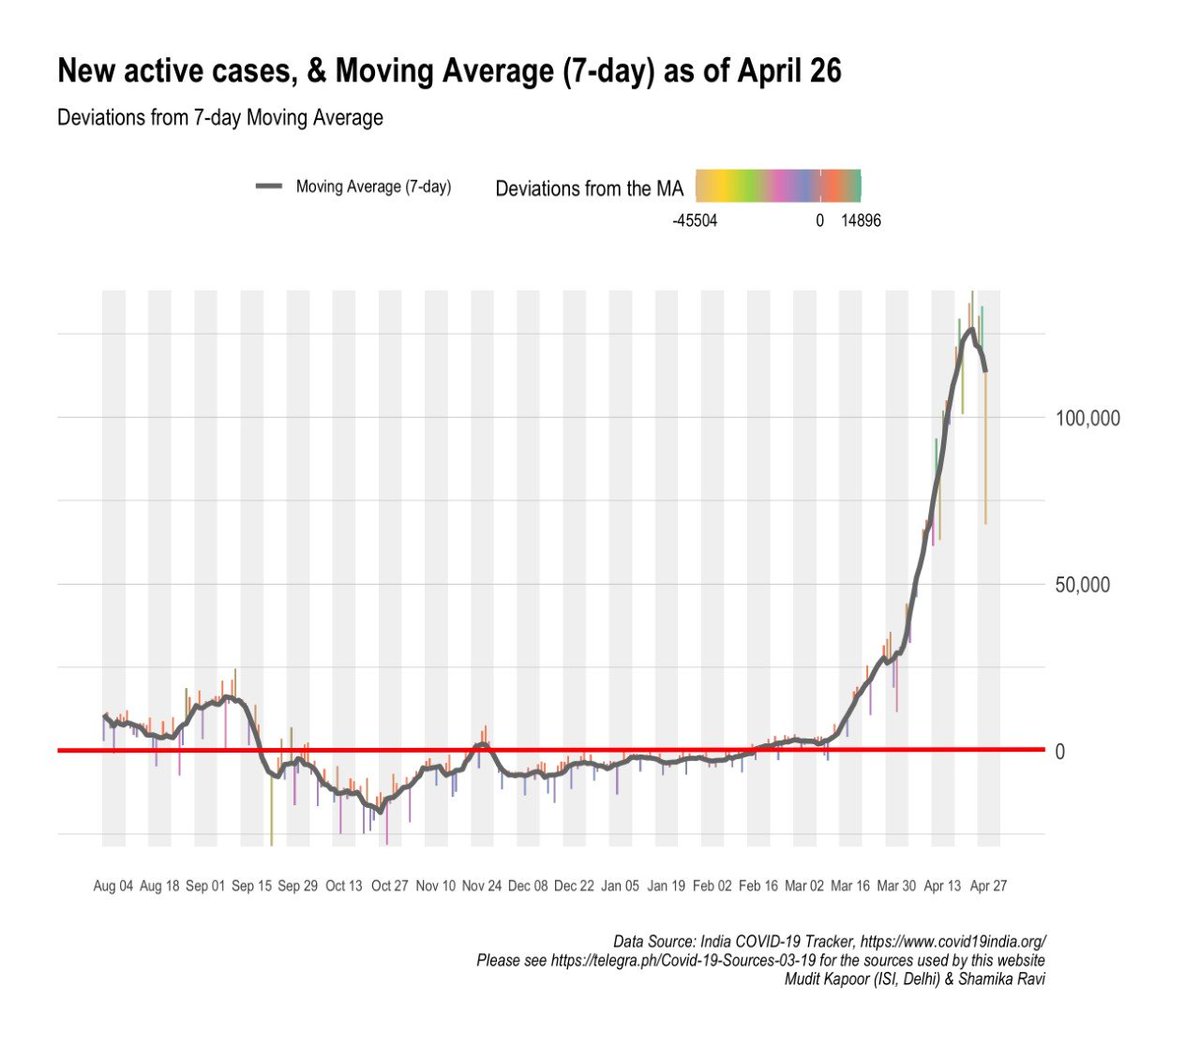
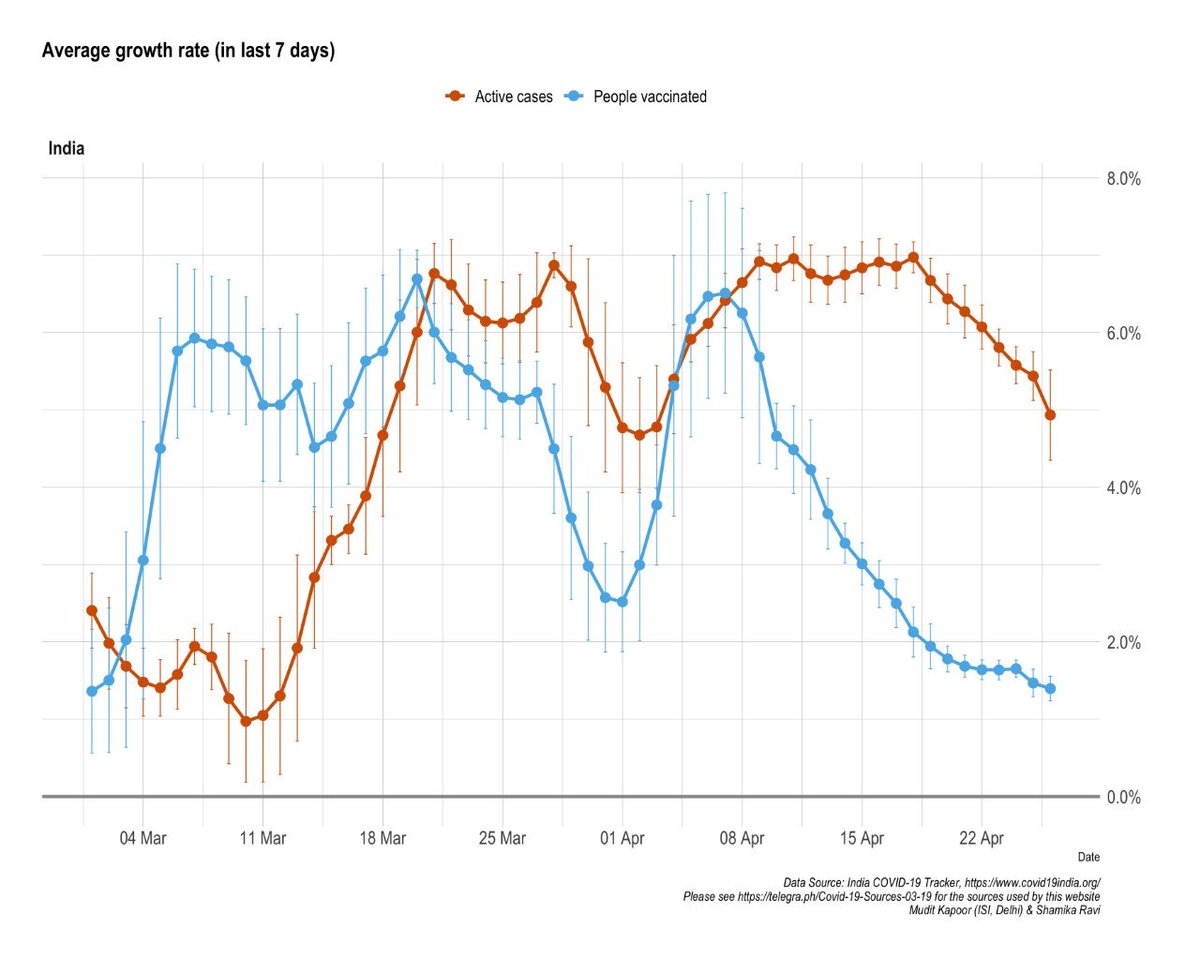
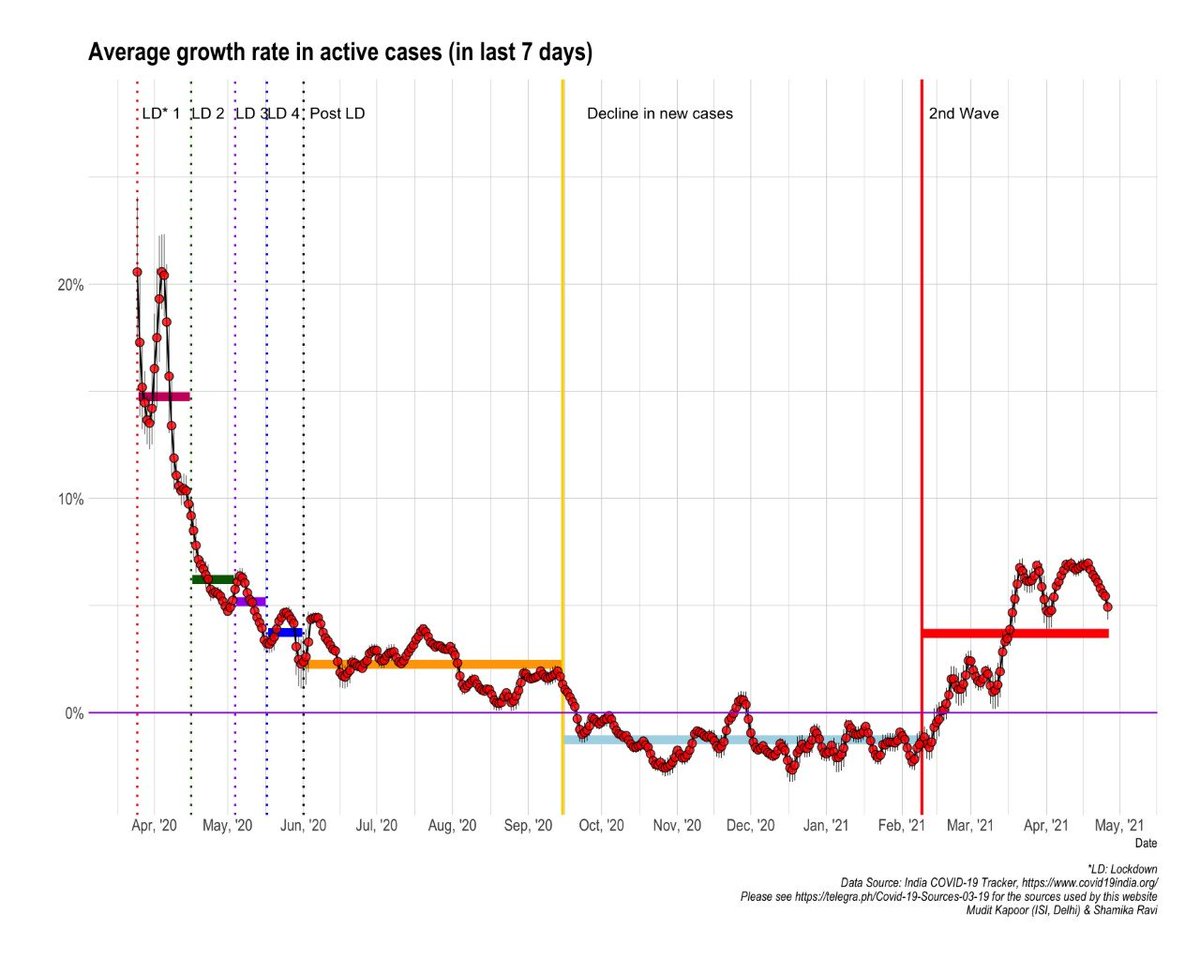
Growth rate of active cases: 4.9%
Growth rate of vaccinated people: 1.4%
Growth rate of active cases: 4.9%
Growth rate of vaccinated people: 1.4%
Growth rate of active cases: 4.9%
(9 consecutive days of decline https://abs.twimg.com/emoji/v2/... draggable="false" alt="🤞" title="Gekreuzte Finger" aria-label="Emoji: Gekreuzte Finger">)
(9 consecutive days of decline
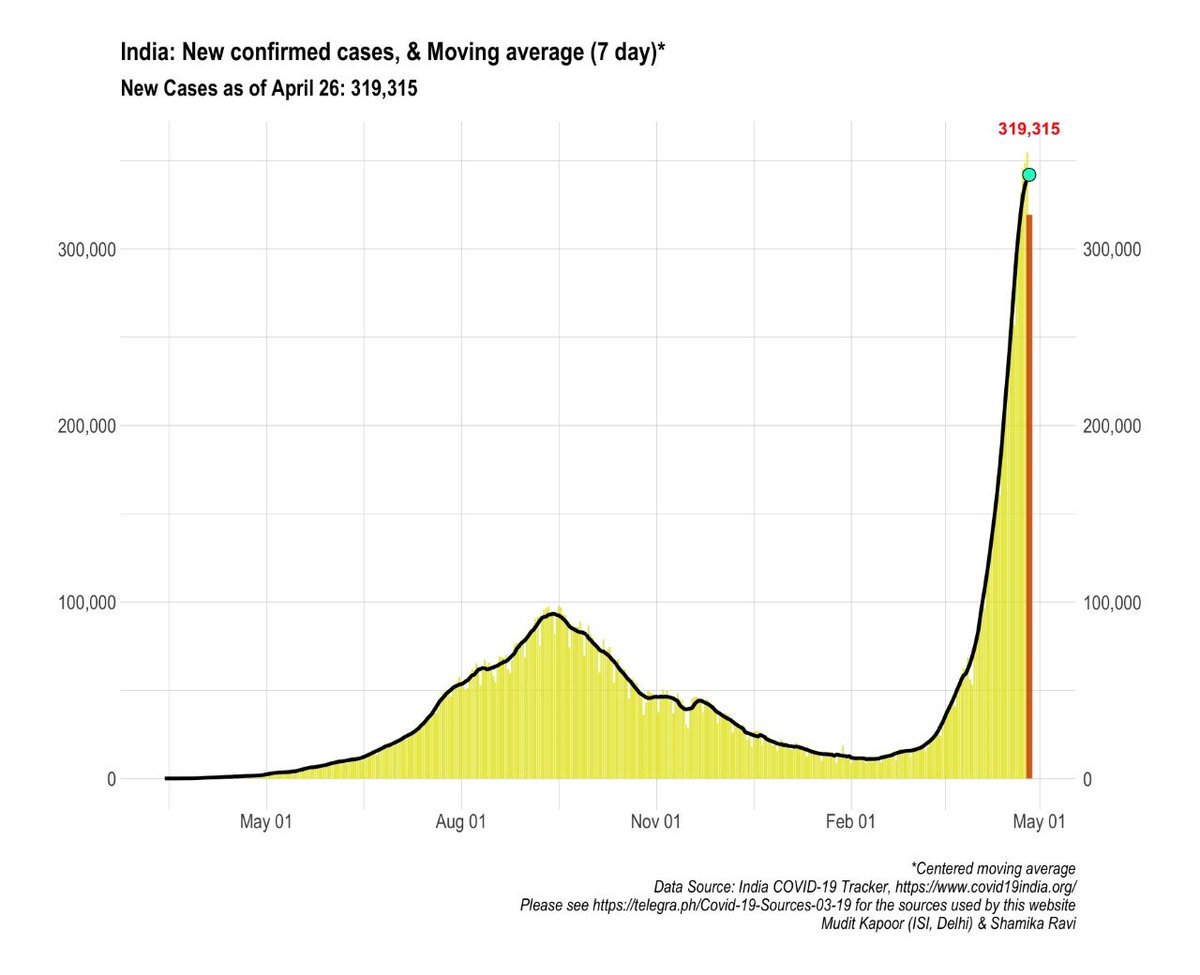
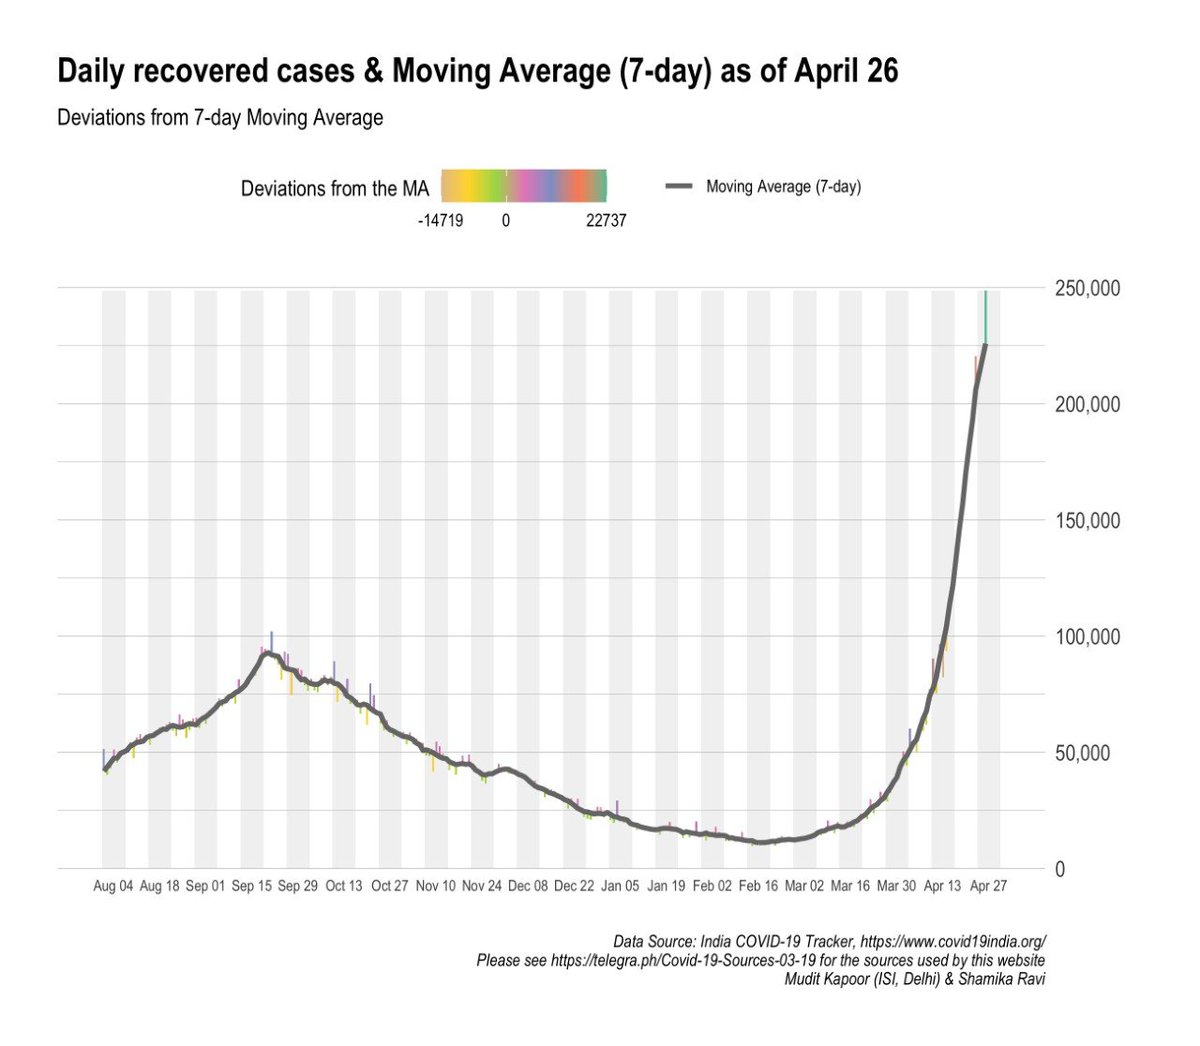
While we only focus on daily new cases (through new media etc.), it is important to monitor daily recovered cases too & deaths - to get a better sense of what is the net burden on the healthcare infrastructure. That is why we put so much emphasis on active cases.
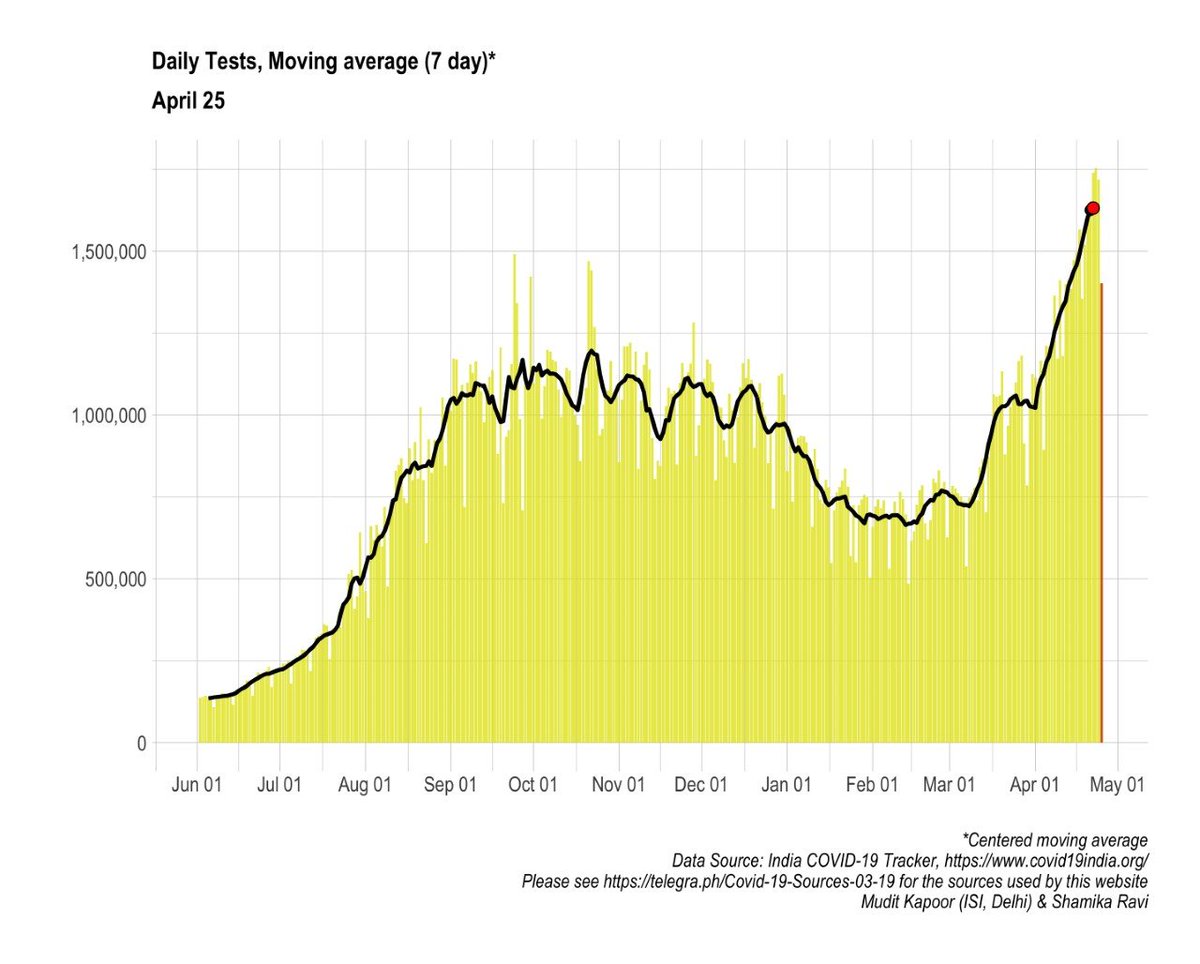
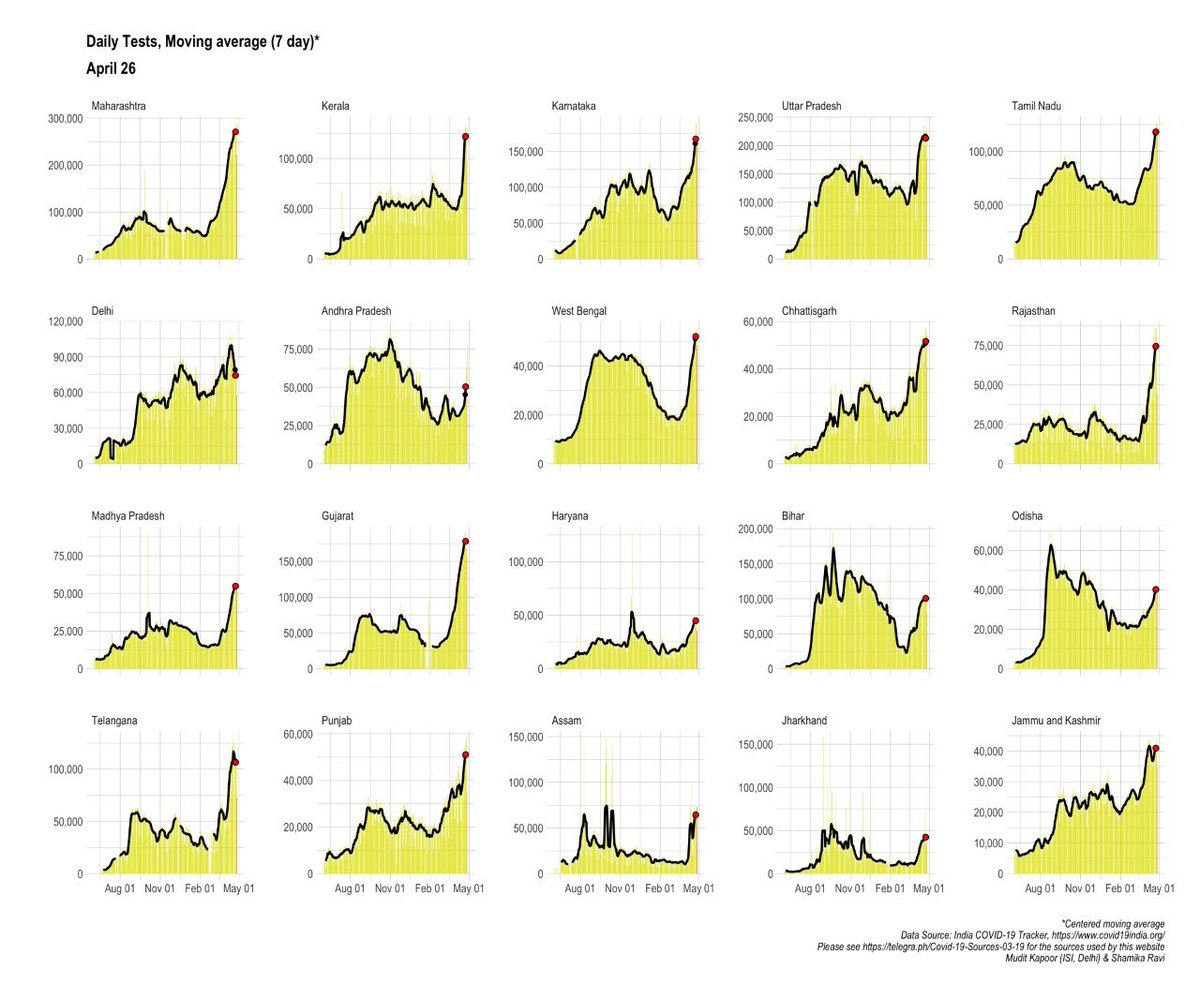
Another factor to scrutinise closely is the daily testing: which is rising sharply overall (7 day moving average)

 Read on Twitter
 )" title="Growth rate of active cases: 4.9%(9 consecutive days of declinehttps://abs.twimg.com/emoji/v2/... draggable="false" alt="🤞" title="Gekreuzte Finger" aria-label="Emoji: Gekreuzte Finger">)" class="img-responsive" style="max-width:100%;"/>
