4/25 COVID-19 thread in Illinois begins here.
Vaccine doses administered on Saturday: 74,461
Bridge metrics: 78.23% of residents 65+ have received 1 dose.
52.36% of residents 16+ have received 1 dose.
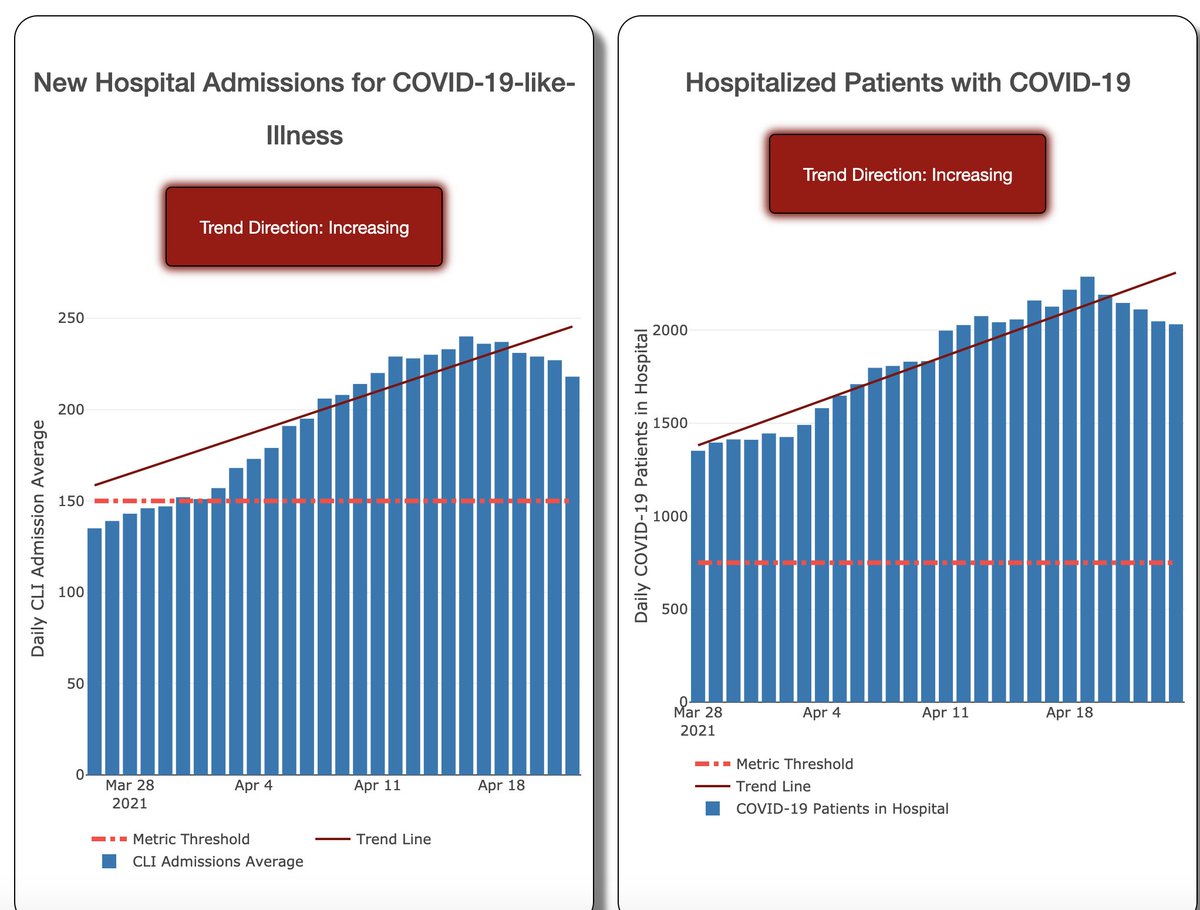
New hospital admissions improving:
Vaccine doses administered on Saturday: 74,461
Bridge metrics: 78.23% of residents 65+ have received 1 dose.
52.36% of residents 16+ have received 1 dose.
New hospital admissions improving:
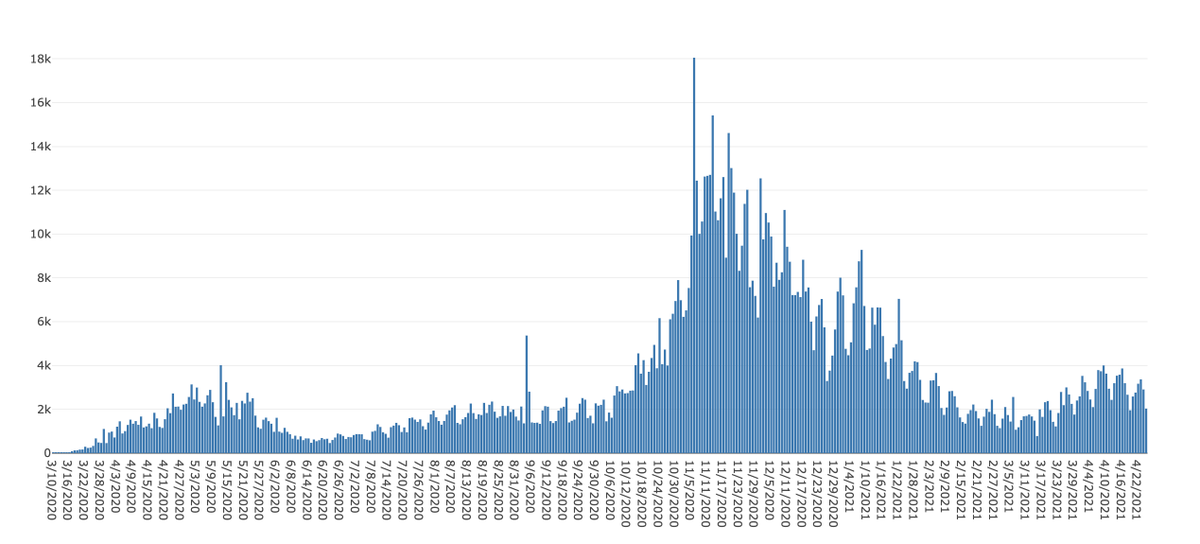
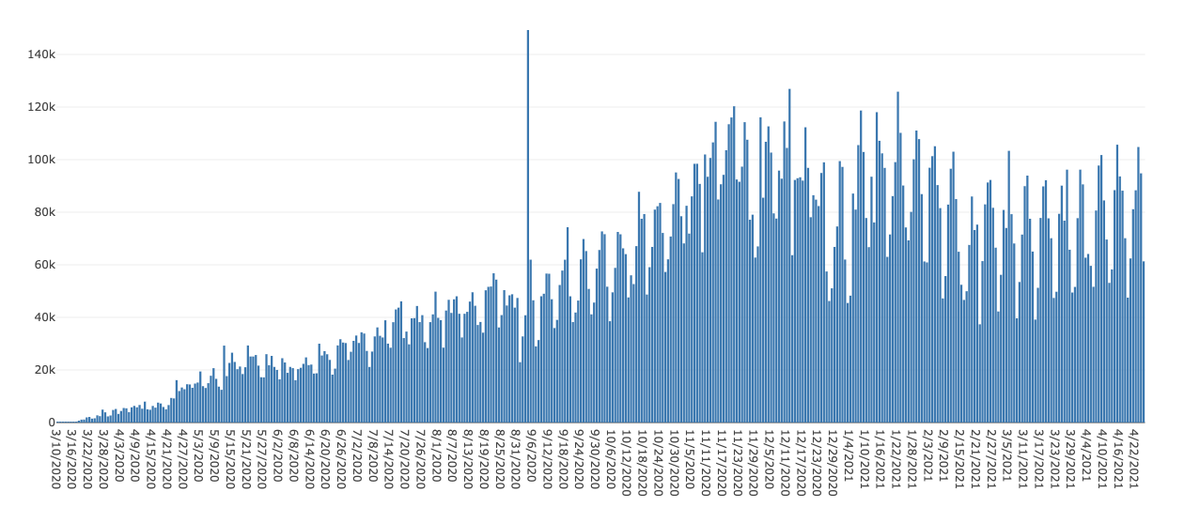
2,035 new confirmed + probable cases, 61,299 tests run.
3.31% positivity rate for this batch. (was 3.06% yesterday)
State& #39;s 7-day rolling avg. positivity rate stays flat at: 3.5%
3.31% positivity rate for this batch. (was 3.06% yesterday)
State& #39;s 7-day rolling avg. positivity rate stays flat at: 3.5%
Variant update:
2,542 total cases ( https://abs.twimg.com/emoji/v2/... draggable="false" alt="⚠️" title="Warnsignal" aria-label="Emoji: Warnsignal"> +762 from Thursday)
1,705: B.1.1.7 (UK variant)
524: P.1 (Brazil)
285: B.1/427/429 (California)
28: B.1.351 (South Africa)
^^ Refusing to get a vaccine puts you at a greater risk for these.
2,542 total cases (
1,705: B.1.1.7 (UK variant)
524: P.1 (Brazil)
285: B.1/427/429 (California)
28: B.1.351 (South Africa)
^^ Refusing to get a vaccine puts you at a greater risk for these.
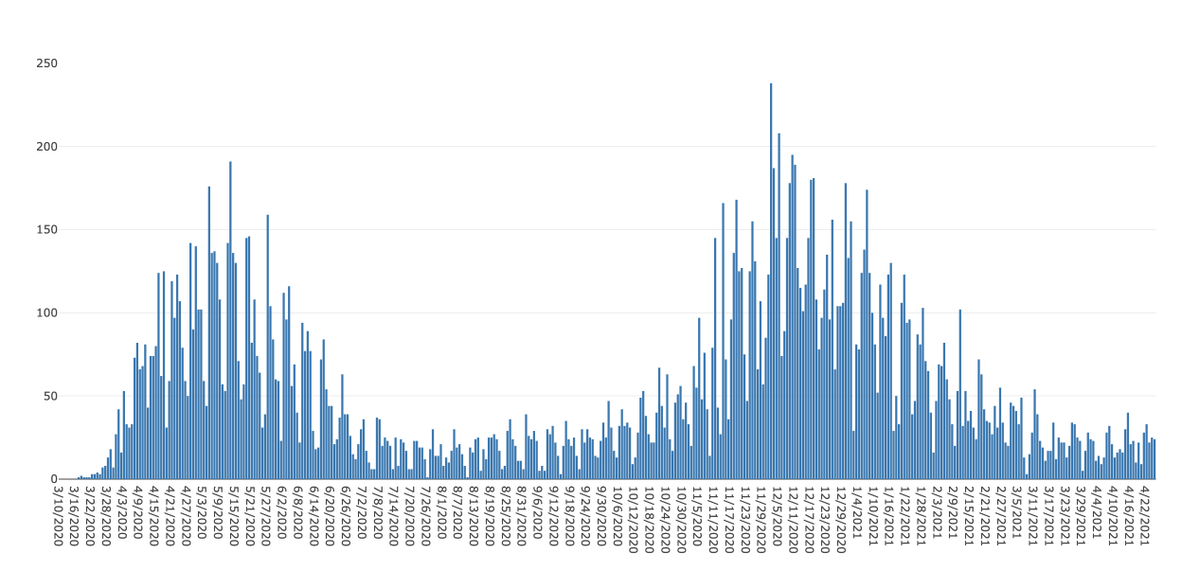
The pandemic in full view for Illinois.
This is confirmed (and as of Nov. 6) + probable cases.
As of Jan. 15: the UK variant is confirmed to be in Illinois.
Feb. 11: the South African variant is here.
March 5: the Brazilian variant is here.
March 25: California variant
This is confirmed (and as of Nov. 6) + probable cases.
As of Jan. 15: the UK variant is confirmed to be in Illinois.
Feb. 11: the South African variant is here.
March 5: the Brazilian variant is here.
March 25: California variant
Vaccine data:
7-day rolling average for administration: 107,976 doses per day (-5,838)
# of people fully vaccinated: 3,769,787 (+48,040)
% of state population fully vaccinated: 29.59% (+0.38 percentage points).
7-day rolling average for administration: 107,976 doses per day (-5,838)
# of people fully vaccinated: 3,769,787 (+48,040)
% of state population fully vaccinated: 29.59% (+0.38 percentage points).
Counties 15% or greater fully vaccinated: 101/102 (+0 from yesterday)
Counties 20% or greater fully vaccinated: 97/102 (+0 from yesterday)
Counties 30% or greater fully vaccinated: 25/102 (+1 from yesterday)
Counties 20% or greater fully vaccinated: 97/102 (+0 from yesterday)
Counties 30% or greater fully vaccinated: 25/102 (+1 from yesterday)
Highest:
Sangamon County: 35.55% fully vaccinated
Monroe County: 35.28%
Also, DuPage County (population 928K): 32.81%
Champaign County (population 209K): 32.41%
Peoria County (population 179K): 30.88%
Lowest:
Alexander County: 10.61%
Henderson County: 16.46%
Sangamon County: 35.55% fully vaccinated
Monroe County: 35.28%
Also, DuPage County (population 928K): 32.81%
Champaign County (population 209K): 32.41%
Peoria County (population 179K): 30.88%
Lowest:
Alexander County: 10.61%
Henderson County: 16.46%
Region 1 (DeKalb and west to Whiteside):
Positivity rate: 5.9% (-0.3)
15% of ICU beds available
 https://abs.twimg.com/emoji/v2/... draggable="false" alt="⚠️" title="Warnsignal" aria-label="Emoji: Warnsignal"> 13th straight day below 20% ICU capacity
6 days of hospitalization increases (-1)
Positivity rate: 5.9% (-0.3)
15% of ICU beds available
6 days of hospitalization increases (-1)
Within Region 1:
7-day average of COVID-19 patients in the hospital: 125 (-1 from yesterday)
DeKalb County& #39;s positivity down to: 6.6%
Whiteside down to 4.7%
Lee flat at: 1.9%
7-day average of COVID-19 patients in the hospital: 125 (-1 from yesterday)
DeKalb County& #39;s positivity down to: 6.6%
Whiteside down to 4.7%
Lee flat at: 1.9%
Region 2 (Kendall, La Salle to Bureau):
Positivity rate: 5.8% (-0.2)
16% of ICU beds available
6 days of hospitalization increases (-1)
 https://abs.twimg.com/emoji/v2/... draggable="false" alt="⚠️" title="Warnsignal" aria-label="Emoji: Warnsignal"> 16 days in a row below 20% ICU capacity for Region 2.
Positivity rate: 5.8% (-0.2)
16% of ICU beds available
6 days of hospitalization increases (-1)
Within Region 2:
7-day rolling average of 290 COVID-19 patients in the hospital (-1 from yesterday)
La Salle County& #39;s positivity flat at: 4.8%
Kendall down to: 7.6%
Bureau: down to: 4.3%
7-day rolling average of 290 COVID-19 patients in the hospital (-1 from yesterday)
La Salle County& #39;s positivity flat at: 4.8%
Kendall down to: 7.6%
Bureau: down to: 4.3%
Region 3 (Springfield area):
Positivity rate: 2.9%
24% of ICU beds available
6 days of hospitalization increases
Up to 65 COVID patients in the hospital
Positivity rate: 2.9%
24% of ICU beds available
6 days of hospitalization increases
Up to 65 COVID patients in the hospital
Region 4 (St. Louis area):
Positivity rate: 3.0% (-0.1)
35% of ICU beds available
6 days of hospitalization decreases/stable
Down to 47 COVID patients in the hospital
Positivity rate: 3.0% (-0.1)
35% of ICU beds available
6 days of hospitalization decreases/stable
Down to 47 COVID patients in the hospital
Region 5 (southern):
Positivity rate: 1.7% (+0.1)
21% of ICU beds available.
5 days of hospitalization decreases/stable
Up to 22 COVID patients in the hospital
Positivity rate: 1.7% (+0.1)
21% of ICU beds available.
5 days of hospitalization decreases/stable
Up to 22 COVID patients in the hospital
Region 6 (Champaign area):
Positivity rate: 3.0%
40% of ICU beds available
7 days of hospitalization increases
Down to 69 COVID patients in the hospital
Positivity rate: 3.0%
40% of ICU beds available
7 days of hospitalization increases
Down to 69 COVID patients in the hospital
Region 7 (Will/Kankakee):
Positivity rate: 5.4% (-0.1)
21% of ICU beds available
6 days of hospitalization increases (-1)
Down to 102 COVID patients in the hospital
Positivity rate: 5.4% (-0.1)
21% of ICU beds available
6 days of hospitalization increases (-1)
Down to 102 COVID patients in the hospital
Region 8 (Kane/DuPage):
Positivity rate: 5.7% (-0.2)
23% of ICU beds available
8 days of hospitalization increases (-1)
Down to 225 COVID patients in the hospital.
Positivity rate: 5.7% (-0.2)
23% of ICU beds available
8 days of hospitalization increases (-1)
Down to 225 COVID patients in the hospital.
Region 9 (Lake/McHenry):
Positivity rate: 4.1% (-0.1)
30% of ICU beds available
6 days of hospitalization increases (+1)
Up to 88 COVID patients in the hospital.
Positivity rate: 4.1% (-0.1)
30% of ICU beds available
6 days of hospitalization increases (+1)
Up to 88 COVID patients in the hospital.
Region 10 (suburban Cook):
Positivity rate: 4.9% (-0.2)
20% of ICU beds available
6 days of hospitalization increases (-1)
Down to 598 COVID patients in the hospital.
Positivity rate: 4.9% (-0.2)
20% of ICU beds available
6 days of hospitalization increases (-1)
Down to 598 COVID patients in the hospital.
Region 11 (Chicago):
Positivity rate: 5.0% (-0.1)
20% of ICU beds available
10 days of hospitalization increases
Up to 517 COVID patients in the hospital
Positivity rate: 5.0% (-0.1)
20% of ICU beds available
10 days of hospitalization increases
Up to 517 COVID patients in the hospital
4/25 summary, Part I:
OK, the good first. Hospitalizations continue to gradually fall. New COVID-like illness cases showing up in the hospital continue to fall.
Either today or Monday we& #39;ll hit 30% fully vaccinated in Illinois.
OK, the good first. Hospitalizations continue to gradually fall. New COVID-like illness cases showing up in the hospital continue to fall.
Either today or Monday we& #39;ll hit 30% fully vaccinated in Illinois.

 Read on Twitter


