I am telling you man, people can& #39;t let go of the cash-out data because it& #39;s a the hope and the dream of another housing crash https://twitter.com/WinfieldSmart/status/1385545981287190530">https://twitter.com/WinfieldS...
It& #39;s so different this time around, but the blood lust for something negative on Twitter is too good to pass up. Since I knew people would use the cash-out data this way, I already got ahead of that https://www.housingwire.com/articles/are-we-seeing-a-cash-out-loan-crisis/">https://www.housingwire.com/articles/...
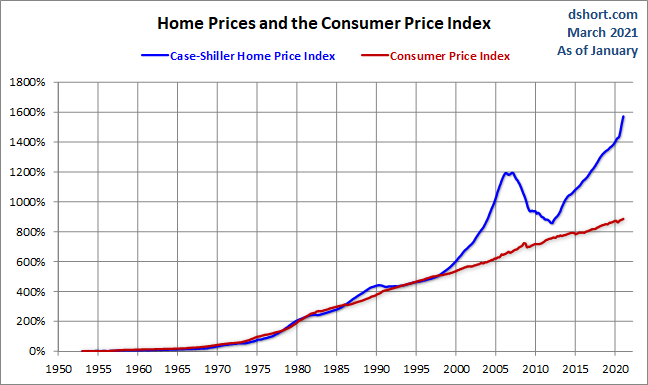
To be very fair to everyone. They don& #39;t have the financial background to know how different it is. This is basically a 2.0 version of people using nominal home prices getting back to 2006 levels and calling for the crash, which was a favorite of crash cult twitter.
3 simple things to remember
1. Cash flow of owners now is excellent, especially the recent data.
2. (Most important) No exotic loan debt structures, very vanilla
3. Fixed low debt cost vs. rising wages + nested equity.
1. Cash flow of owners now is excellent, especially the recent data.
2. (Most important) No exotic loan debt structures, very vanilla
3. Fixed low debt cost vs. rising wages + nested equity.
We have other things to worry about with housing, but cash-out data isn& #39;t it. https://www.bloomberg.com/news/audio/2021-04-23/unhealthy-housing-market-prices-rise-despite-demand-radio?">https://www.bloomberg.com/news/audi...
3 More charts.
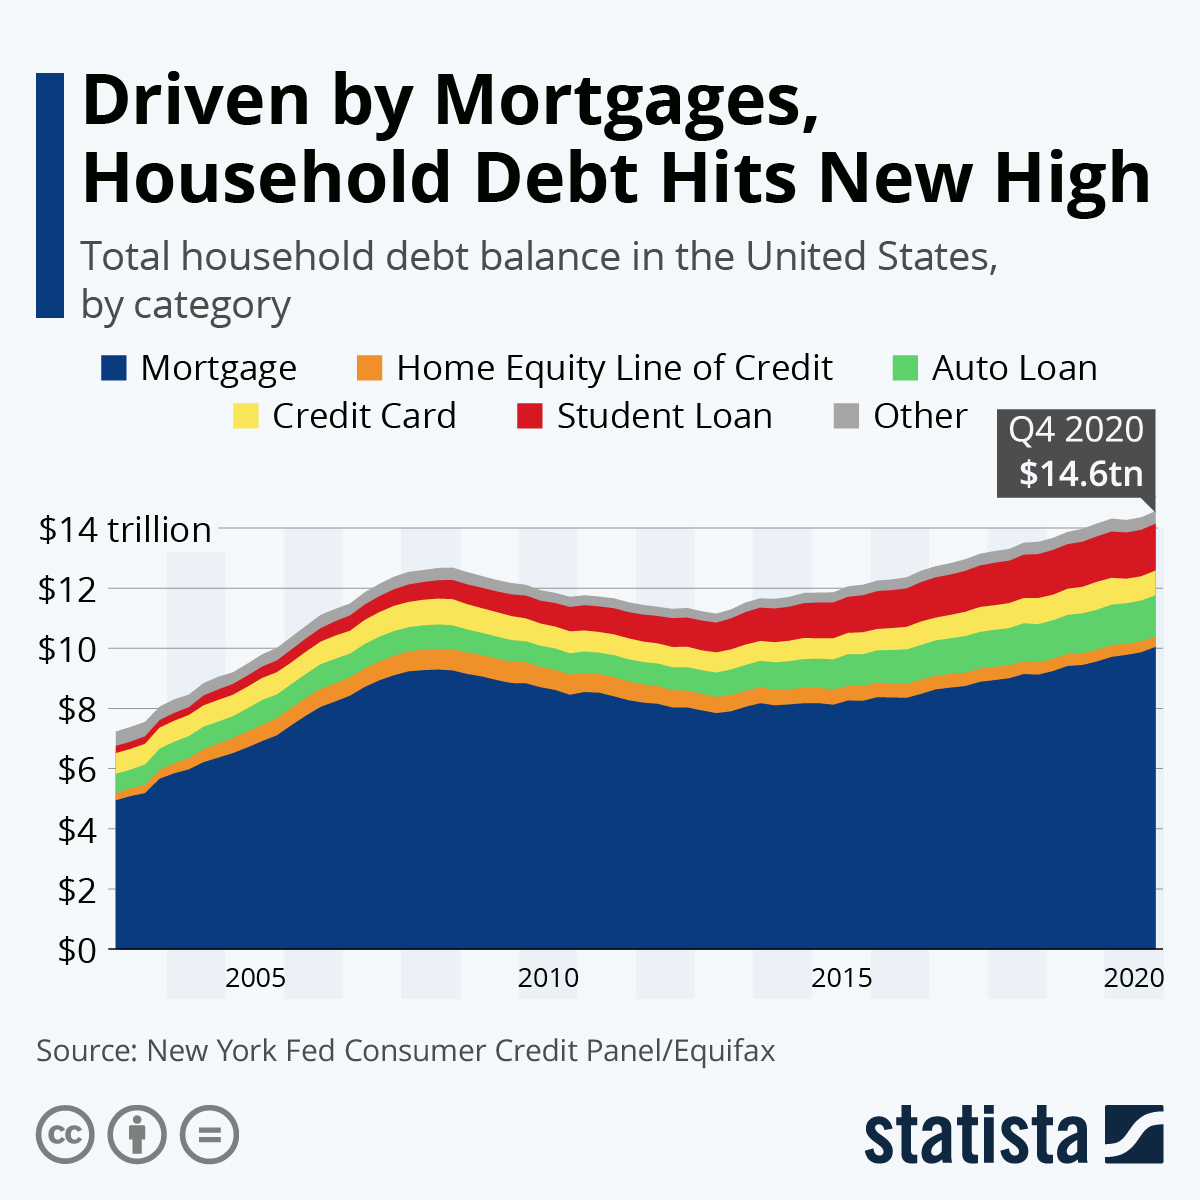
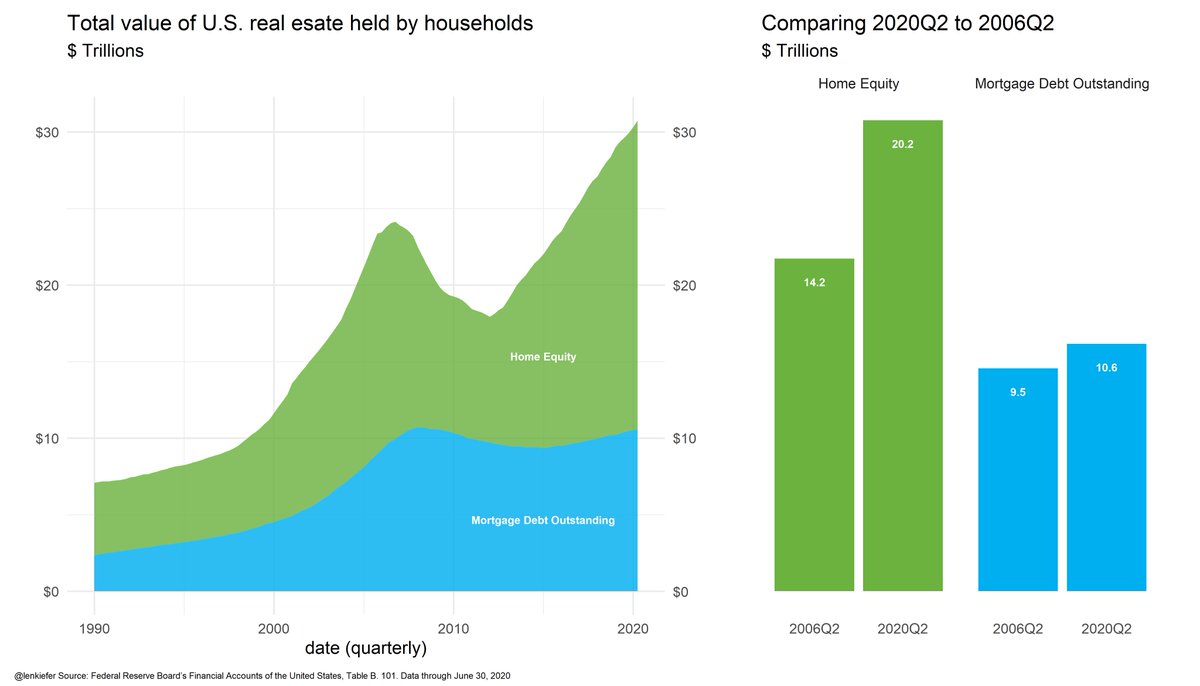
1. Mortgage debt hasn& #39;t had much growth from the previous peak. This runs in line with my weakest housing recovery thesis from 2008-2019. We don& #39;t have a speculative credit bubble.
1. Mortgage debt hasn& #39;t had much growth from the previous peak. This runs in line with my weakest housing recovery thesis from 2008-2019. We don& #39;t have a speculative credit bubble.
2. This is very key; 2018-2021 data looks nothing like 2002-2005. This is a good thing, not a bad thing. Demand is legit, and these owners have good financial profiles.
"To paraphrase Rutherford for economics models, if models don’t include demographics and productivity, they might as well be stamp collecting. As it turns out, we have a lot of philatelists in housing economics – I call them the housing bubble boys."

 Read on Twitter


