. @Schroders research:
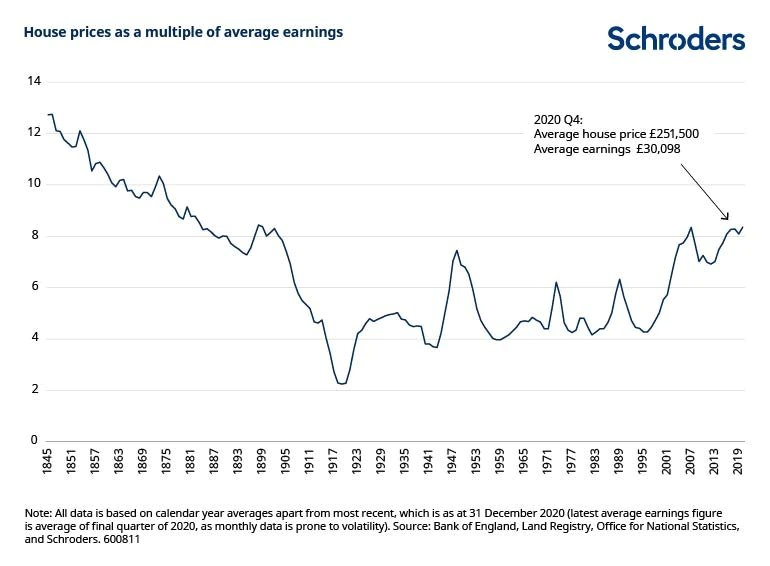
"The average house in the UK currently costs more than eight-times average earnings (data at Dec 2020).
Before the current episode, this 8X earnings level has only been breached twice previously in the past 120 years."
"The average house in the UK currently costs more than eight-times average earnings (data at Dec 2020).
Before the current episode, this 8X earnings level has only been breached twice previously in the past 120 years."
"It may only be of historic curiosity, but it is interesting that house prices were even more expensive in the latter half of the nineteenth century.
They then went on a multi-decade downtrend relative to earnings. This only bottomed out after World War I."
They then went on a multi-decade downtrend relative to earnings. This only bottomed out after World War I."
"Three important drivers of this: more houses, smaller houses & rising incomes.
More houses: doubling in the stock of housing in the UK between 1851 and 1911. It rose from 3.8 million to 8.9 million houses – for reference, today it stands at more than 28 million."
More houses: doubling in the stock of housing in the UK between 1851 and 1911. It rose from 3.8 million to 8.9 million houses – for reference, today it stands at more than 28 million."
"Smaller houses: Houses built before 1850 were significantly larger than those built after. Prior to 1850, the average house in the UK had a plot size of 913m2 but houses built in the next 50 years had an average plot size of only 268m2."
"Higher incomes: While average house prices fell by 23% between 1845 and 1911 (-0.4% a year), due in part to the two factors above, earnings rose by 90% over the same period (+1.1% a year)."
https://www.cityam.com/what-175-years-of-data-tell-us-about-house-price-affordability-in-the-uk/">https://www.cityam.com/what-175-...

 Read on Twitter


