1/ Think that the #Bitcoin  https://abs.twimg.com/hashflags... draggable="false" alt=""> bull market is over?
  https://abs.twimg.com/emoji/v2/... draggable="false" alt="😱" title="Vor Angst schreiendes Gesicht" aria-label="Emoji: Vor Angst schreiendes Gesicht">
Think again! https://abs.twimg.com/emoji/v2/... draggable="false" alt="🤔" title="Denkendes Gesicht" aria-label="Emoji: Denkendes Gesicht"> Let& #39;s take a look at the raw data
  https://abs.twimg.com/emoji/v2/... draggable="false" alt="🧐" title="Gesicht mit Monokel" aria-label="Emoji: Gesicht mit Monokel">
A thread https://abs.twimg.com/emoji/v2/... draggable="false" alt="👇" title="Rückhand Zeigefinger nach unten" aria-label="Emoji: Rückhand Zeigefinger nach unten">
Think again!
A thread
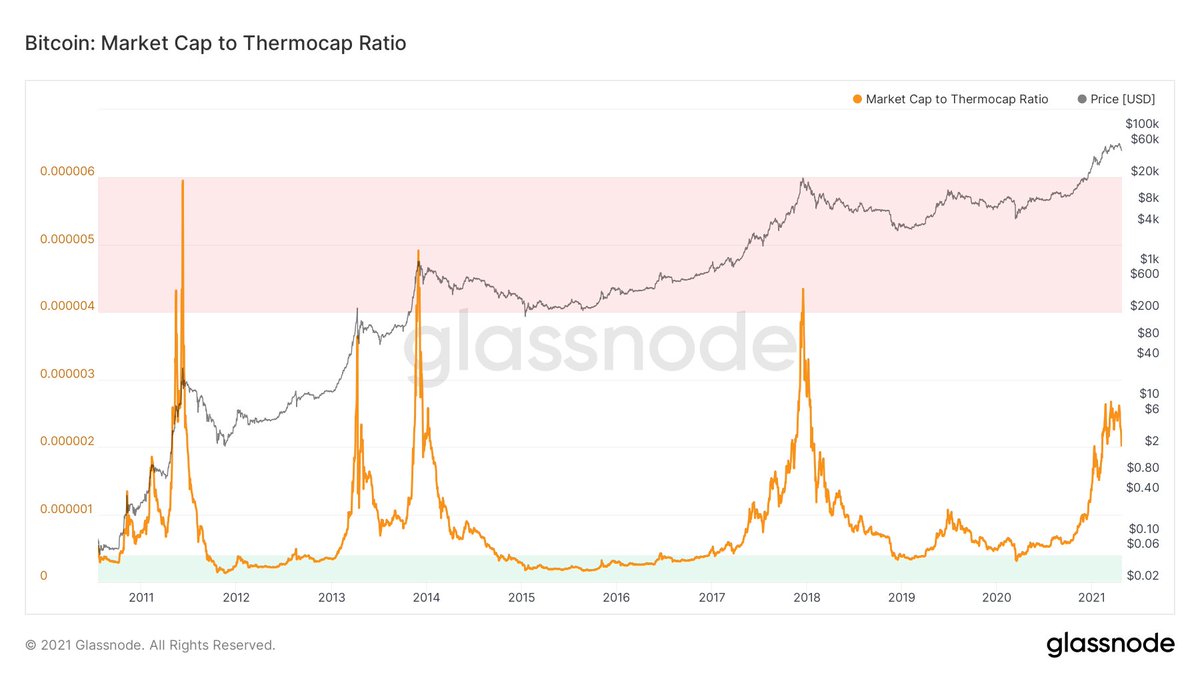
2/ Market Cap to Thermocap ratio shows whether the price is trading at a premium or not in regards to the resources spent by miners. Nowhere near a top.
3/ Puell Multiple is a measure of daily issuance of BTC and divides this value by the 365D MA of the daily issuance value. It& #39;s currently in a consolidation period similar to 2017, still far from a peak.
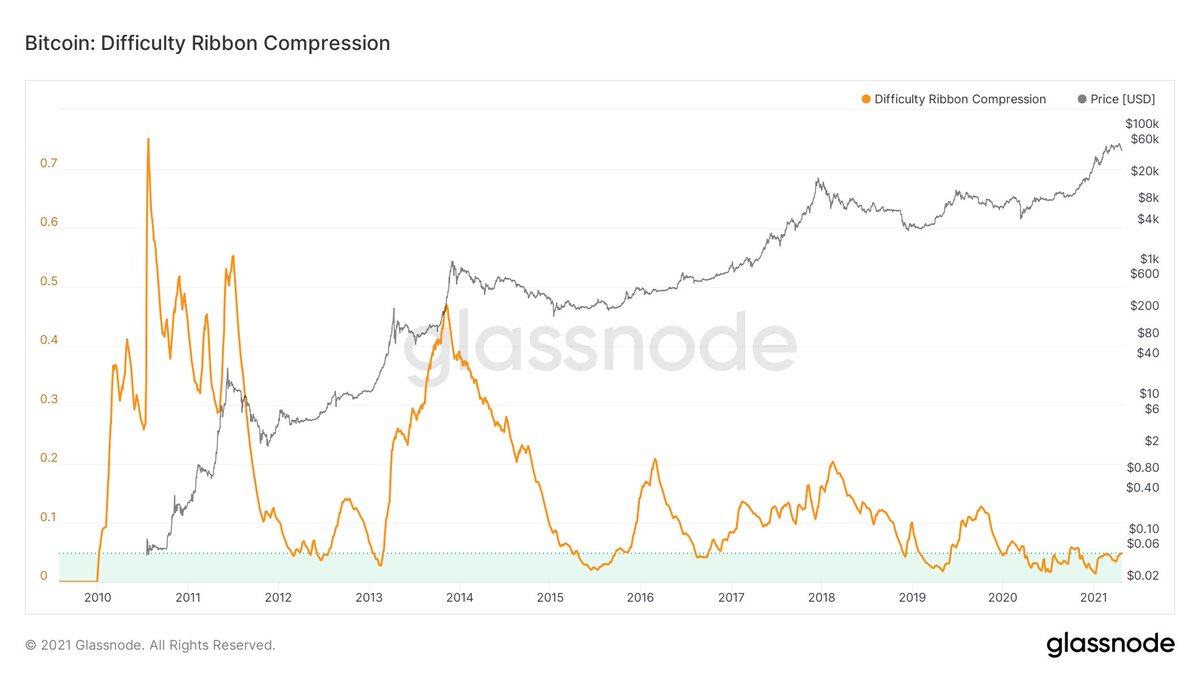
4/ Difficulty Ribbon Compression quantifies the compression of the Difficulty Ribbon which is a measure of the selling pressure by miners. Currently, it sits in the green area, which historically has been a great time to buy.
5/ Enough about miners, let& #39;s talk about hodlers. Starting with the percentage of circulating supply of coins being in profit. Similar to the 2017 cycle, it dropped under the red zone, showing that not everyone is in profit like during major cycle tops.
6/ Moreover, the Net Unrealized Profit/Loss (NUPL) hasn& #39;t yet reached the euphoria phase, which historically has pointed out blow-off tops. Again, the current graph shows a consolidation in the green zone, similar to pre-top 2017 action.
7/ The Realized Cap HODL Waves, which is a weighted value of HODL Waves/Realized Price, shows the percent of BTC that was last moved in various periods of time. Spending of old coins has increased, which is to be expected during a strong bull market, however it& #39;s far from a top.
8/ The RHODL Ratio, a ratio of the Realized Cap HODL Waves, is even more indicative of a clear uptrend that hasn& #39;t reached a major top yet, as shown below.
9/ How overvalued is Bitcoin in its current posture? Well, the MVRV Z-Score is a ratio between (Market Cap - Realized Cap) and the standard deviation of the Market Cap. Do we see a similar pattern as with the previous cycle tops? You tell me.
10/ The Reserve Risk is used to evaluate the confidence that OG hodlers have, relative to where the current price sits. More specifically, it can be viewed as a Risk:Reward tool, and it has called cycle tops and deep bear markets very accurately over time. Nowhere near a new top.
11/ The Stablecoin Supply Ratio is a good indication of potential buying power in regards to the supply of stablecoins. Basically, the lower the indicator, the more purchasing power to stack BTC by market participants. Currently at a level close to October 2020.
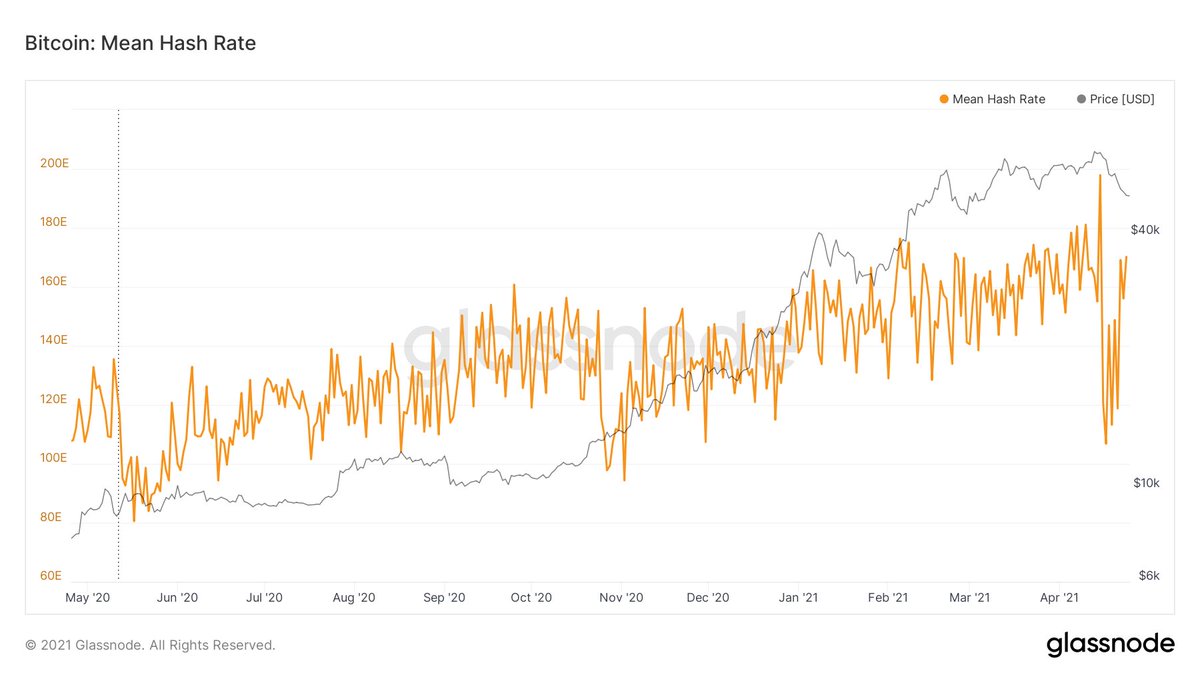
12/ Bitcoin network& #39;s Hash Rate still very strong, quickly recovered after last week& #39;s "catastrophic" drop  https://abs.twimg.com/emoji/v2/... draggable="false" alt="🤦♂️" title="Mann schlägt sich die Hand vors Gesicht" aria-label="Emoji: Mann schlägt sich die Hand vors Gesicht"> Also, in a steady uptrend over the past year.
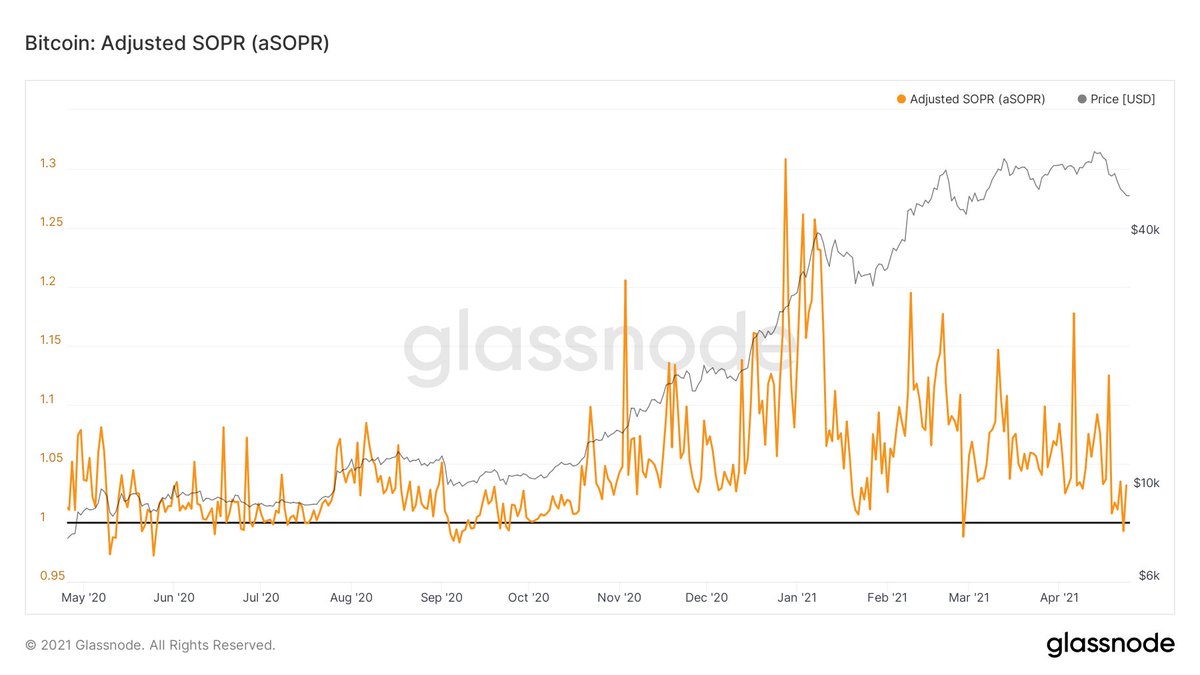
13/ aSOPR (Adjusted SOPR) values close to 1 have been great buying opportunities during this bull market, indicating local bottoms before further upside. Currently, aSOPR just bounced from the black line once again.
14/ After the past week when we& #39;ve seen BTC inflows into exchanges and some consistent selling, the Net Transfer Volume, which is the difference between BTC inflow volume and outflow volume, becomes negative once again, meaning BTC is mostly taken off exchanges.
15/ Number of new BTC addresses in a steady uptrend, showing more participants joining the network as the bull market progresses. These can be retail or institutional, nevertheless it is a partial measure of more entities getting on board and growing interest in the space.
16/ Now, let& #39; have a look at some price action TA as well. On the monthly time frame, BTC is definitely in a clear uptrend, with no break of structure just yet. Perhaps it will come as a shock to many, but not all M candles in a bull market have to be green. See 2017 for example.
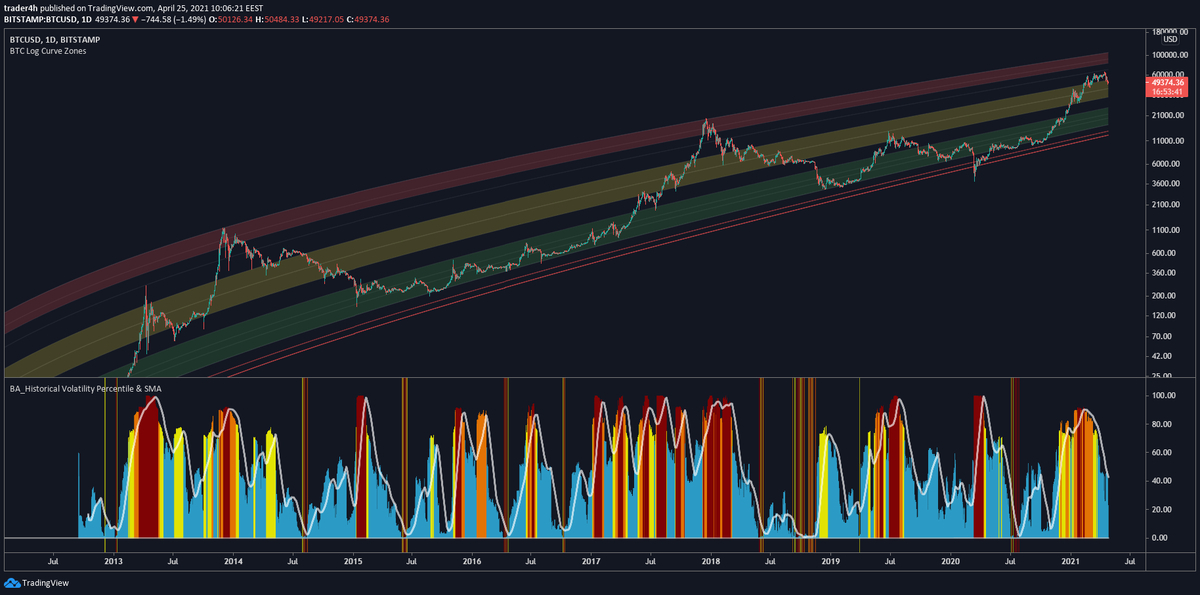
17/ Going down to the weekly, we don& #39;t yet have a trend reversal, only a confirmed local top. Still far from the red zone on the Log Curves. RSI got out of the so-called "overbought" zone, but it did that several times during 2017 as well, before the cycle top. Please zoom out.
18/ Also on the weekly, the ADX was massively overheated and still remains very strong, with a dominant DMI+, although with a negative slope. Remains to be seen how this will continue to play out.
19/ Correction of 20-40% have been usual in the 2017 bull market as well and they& #39;re very healthy and necessary for a sustainable uptrend, to shake out weak hands and liquidate overleveraged noobies thinking they& #39;ll become millionaires overnight. Also called liquidity grabs.
20/ Usually, macro tops have been put in along with Historical Volatility Percentile being overheated (red zone). Not the case for this last local top.
21/ Final considerations:
- Big brains and developments at ATH
- Public companies investments ATH
- Payment processors getting involved
- Investment banks getting involved
- ETFs launched in Canada & UAE
- Good chance for an US ETF this year
Not financial advice though, DYOR https://abs.twimg.com/emoji/v2/... draggable="false" alt="🤷♂️" title="Achselzuckender Mann" aria-label="Emoji: Achselzuckender Mann">
- Big brains and developments at ATH
- Public companies investments ATH
- Payment processors getting involved
- Investment banks getting involved
- ETFs launched in Canada & UAE
- Good chance for an US ETF this year
Not financial advice though, DYOR
22/ Do you have any data to counter any or all of the arguments in this thread?
Please share, it& #39;s more than welcome!
Also, don& #39;t forget to check out the BMCI - Bitcoin Market Cycle Index at http://bitcoinmarketcycle.com"> http://bitcoinmarketcycle.com https://abs.twimg.com/emoji/v2/... draggable="false" alt="💪" title="Angespannter Bizeps" aria-label="Emoji: Angespannter Bizeps">
$BTC $ETH #Crypto
Please share, it& #39;s more than welcome!
Also, don& #39;t forget to check out the BMCI - Bitcoin Market Cycle Index at http://bitcoinmarketcycle.com"> http://bitcoinmarketcycle.com
$BTC $ETH #Crypto

 Read on Twitter



 Also, in a steady uptrend over the past year." title="12/ Bitcoin network& #39;s Hash Rate still very strong, quickly recovered after last week& #39;s "catastrophic" drop https://abs.twimg.com/emoji/v2/... draggable="false" alt="🤦♂️" title="Mann schlägt sich die Hand vors Gesicht" aria-label="Emoji: Mann schlägt sich die Hand vors Gesicht"> Also, in a steady uptrend over the past year." class="img-responsive" style="max-width:100%;"/>
