In this tweet, I will post charts on some of the companies that are reporting earnings this week
Not all but only a few that I am most interested in
But earnings being earnings, the charts are only to see where the stock is currently, shouldn& #39;t be taken as an advice to buy/sell
Not all but only a few that I am most interested in
But earnings being earnings, the charts are only to see where the stock is currently, shouldn& #39;t be taken as an advice to buy/sell
$TSLA Breakout of resistance or breakdown from support can always happen but it& #39;s good to know which are the next immediate points where the price can hit those points. They are marked on the chart https://chrt.biz/TSLA/6710w8pu9m/chart/">https://chrt.biz/TSLA/6710...
$GE The volume shelf built around the current price range seems to be too strong
Support on 34,50 ema seems to be strong and the price never broke below this since Oct 8 2020
Things are looking good overall so far https://chrt.biz/GE/6710w8xjv0/chart/">https://chrt.biz/GE/6710w8...
Support on 34,50 ema seems to be strong and the price never broke below this since Oct 8 2020
Things are looking good overall so far https://chrt.biz/GE/6710w8xjv0/chart/">https://chrt.biz/GE/6710w8...
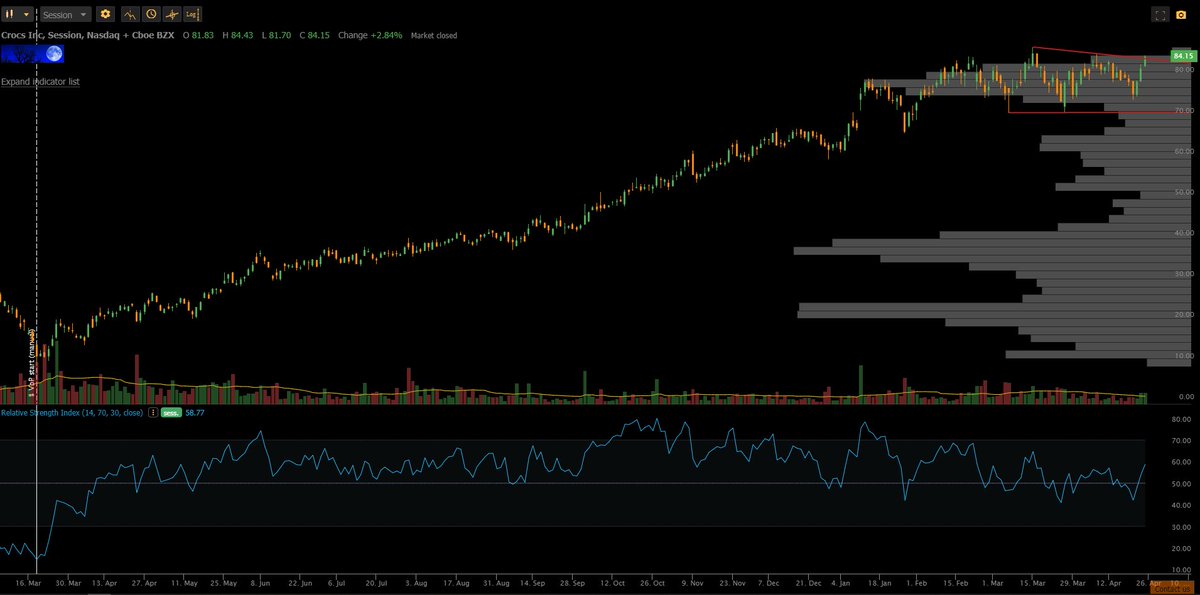
$CROX Nice small breakout Friday, looking good before earnings
Volume shelf built around the current price range acting as good support
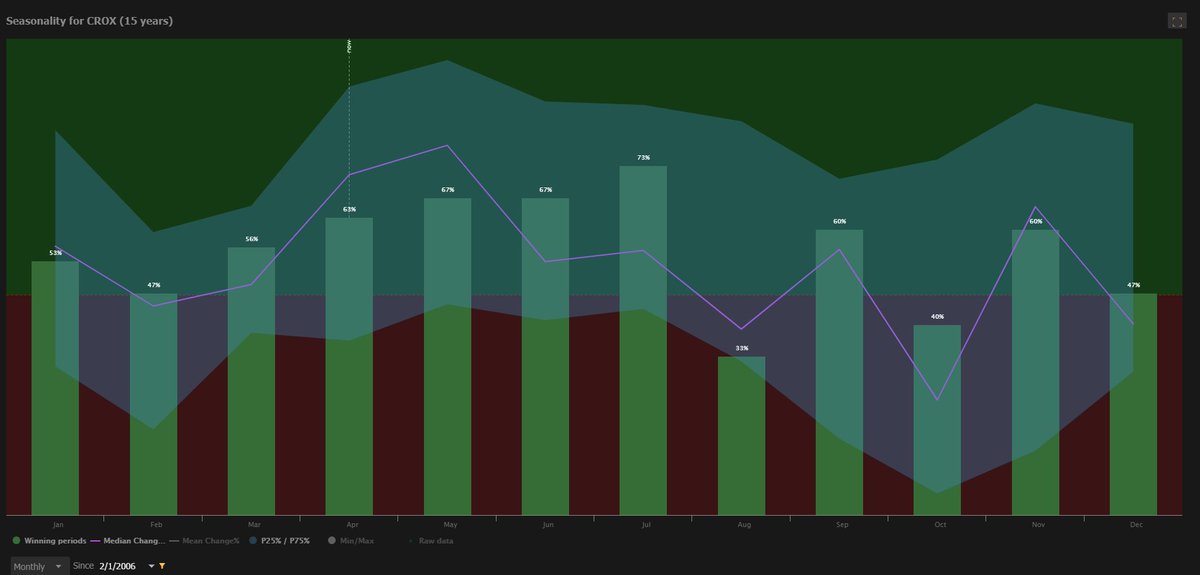
April is the 3rd best month for the stock while the price kept going up until July when it generated highest returns before dropping in August
Volume shelf built around the current price range acting as good support
April is the 3rd best month for the stock while the price kept going up until July when it generated highest returns before dropping in August
$AMD has very strong support at the price range marked on the chart https://chrt.biz/AMD/6710w9ak46/chart/">https://chrt.biz/AMD/6710w...
$MSFT Was considered a safe stock to hold into earnings long time ago, may not be valid today
The support and resistance both seem equally strong at this point. In any case, if you are trading this into earnings, cut it if it breaks support on 5,12 ema https://chrt.biz/MSFT/6710w9ej1k/chart/">https://chrt.biz/MSFT/6710...
The support and resistance both seem equally strong at this point. In any case, if you are trading this into earnings, cut it if it breaks support on 5,12 ema https://chrt.biz/MSFT/6710w9ej1k/chart/">https://chrt.biz/MSFT/6710...
Long in $PINS shares. If you are trading this into earnings, area of strong support marked on the chart https://chrt.biz/PINS/6710w9juem/chart/">https://chrt.biz/PINS/6710...
$BA 72,89 ema acted as a pretty strong resistance for a long time until the price broke that point. Now the same ema acting as good support
Trading pretty tight into earnings
It has also recently formed quite a bit of resistance between $245 - $255 https://chrt.biz/BA/6710w9ocpi/chart/">https://chrt.biz/BA/6710w9...
Trading pretty tight into earnings
It has also recently formed quite a bit of resistance between $245 - $255 https://chrt.biz/BA/6710w9ocpi/chart/">https://chrt.biz/BA/6710w9...
$SHOP Trading inside a Descending wedge and can go in any direction post earnings
Area of support where the stock bounced a few times before has been marked on the chart https://chrt.biz/SHOP/6710wgjuhd/chart/">https://chrt.biz/SHOP/6710...
Area of support where the stock bounced a few times before has been marked on the chart https://chrt.biz/SHOP/6710wgjuhd/chart/">https://chrt.biz/SHOP/6710...
$SPOT Getting tight, close to breakout, big volume shelf around the current price, broke resistance at 5,12 ema on Friday https://chrt.biz/SPOT/6710wgnoi9/chart/">https://chrt.biz/SPOT/6710...
$AAPL Holding onto 5,12 ema support pretty well going into earnings
Marked the area of resistance https://chrt.biz/AAPL/6710whakc3/chart/">https://chrt.biz/AAPL/6710...
Marked the area of resistance https://chrt.biz/AAPL/6710whakc3/chart/">https://chrt.biz/AAPL/6710...
$FB Watch for the support at 34,50 ema
April, May, June and July are the months that returned high returns considering 9 years of history https://chrt.biz/FB/6710whj0wv/chart/">https://chrt.biz/FB/6710wh...
April, May, June and July are the months that returned high returns considering 9 years of history https://chrt.biz/FB/6710whj0wv/chart/">https://chrt.biz/FB/6710wh...
$QCOM Marked the area of next resistance. Getting tight for a breakout or a breakdown https://chrt.biz/QCOM/6710whok7v/chart/">https://chrt.biz/QCOM/6710...
$TDOC Trading in a descending channel. A breakout can bring good upside.
But note the 2 resistance points marked on the chart where it may have some trouble breaking them https://chrt.biz/TDOC/6710wiatks/chart/">https://chrt.biz/TDOC/6710...
But note the 2 resistance points marked on the chart where it may have some trouble breaking them https://chrt.biz/TDOC/6710wiatks/chart/">https://chrt.biz/TDOC/6710...
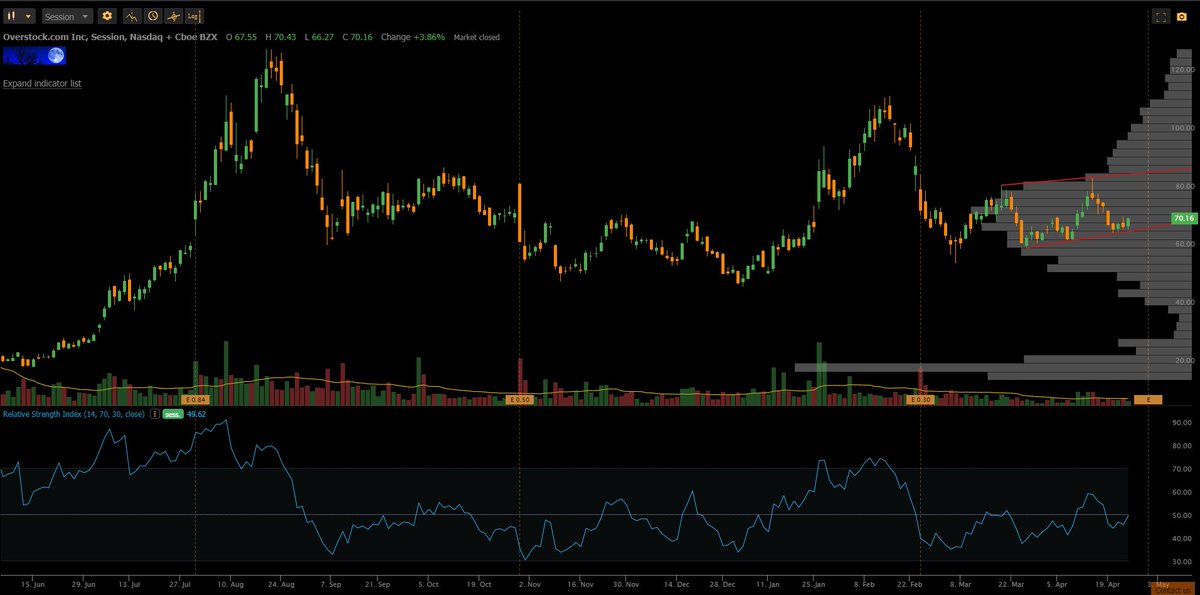
$OSTK Bounced nicely at the support on this Ascending channel
Quite possibly be somewhere close to testing the resistance before earnings.
But some support from market conditions needed for that to happen
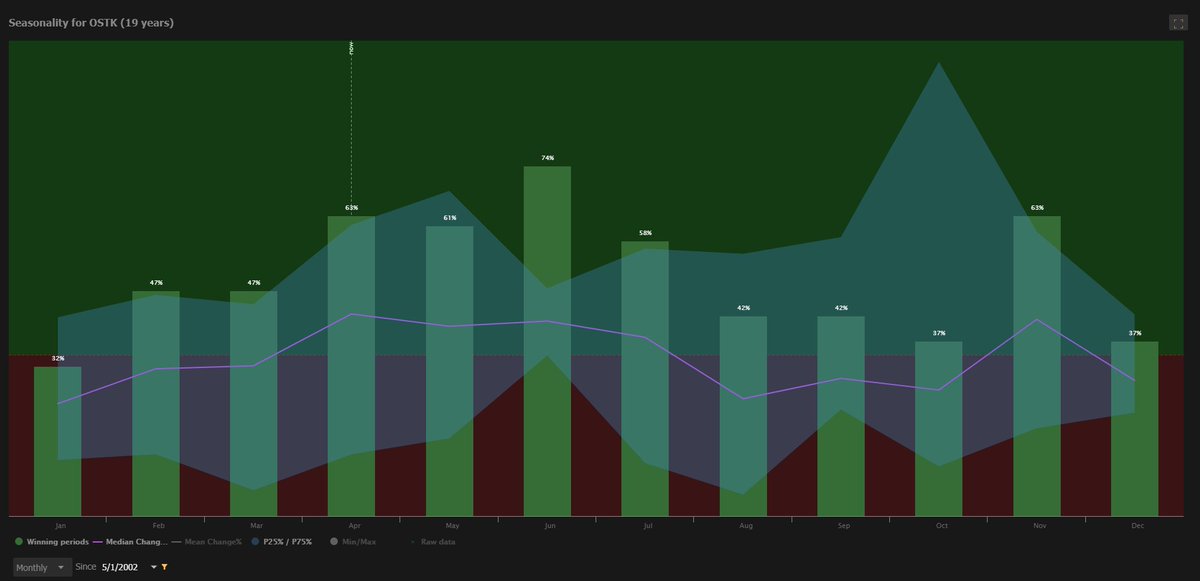
April, May & June had decent gains considering 19 years of history
Quite possibly be somewhere close to testing the resistance before earnings.
But some support from market conditions needed for that to happen
April, May & June had decent gains considering 19 years of history
$AMZN Liking the fact that the stock is testing the support on SuperTrend and trying to bounce (This is your stop loss if you are in this for earnings)
But worth noting the resistance that it may hit. Earnings may change this picture completely https://chrt.biz/AMZN/6710wiqi7l/chart/">https://chrt.biz/AMZN/6710...
But worth noting the resistance that it may hit. Earnings may change this picture completely https://chrt.biz/AMZN/6710wiqi7l/chart/">https://chrt.biz/AMZN/6710...
$NIO Nice breakout on Symmetric Triangle recently. 5,12 ema turned positive
Everything looks good for more upside. But note one of the immediate resistance points where it may have some trouble moving up https://chrt.biz/NIO/6710wix444/chart/">https://chrt.biz/NIO/6710w...
Everything looks good for more upside. But note one of the immediate resistance points where it may have some trouble moving up https://chrt.biz/NIO/6710wix444/chart/">https://chrt.biz/NIO/6710w...
$TWTR Marked the area of support which it may try and hold going into earnings
But it has to break the resistance on 5,12 ema for it to have upside
Slight divergence of 5,12 ema to the upside showing signs that it happen https://chrt.biz/TWTR/6710wj32be/chart/">https://chrt.biz/TWTR/6710...
But it has to break the resistance on 5,12 ema for it to have upside
Slight divergence of 5,12 ema to the upside showing signs that it happen https://chrt.biz/TWTR/6710wj32be/chart/">https://chrt.biz/TWTR/6710...

 Read on Twitter
