1/n With Media is busy inciting hysteria in India wrt #COVID19 , I thought to compile data showing where exactly India stands.
I have used https://ourworldindata.org/coronavirus ">https://ourworldindata.org/coronavir... as the my source & data have been collected today at 3:00 PM IST.
The thread will keep growing.
I have used https://ourworldindata.org/coronavirus ">https://ourworldindata.org/coronavir... as the my source & data have been collected today at 3:00 PM IST.
The thread will keep growing.
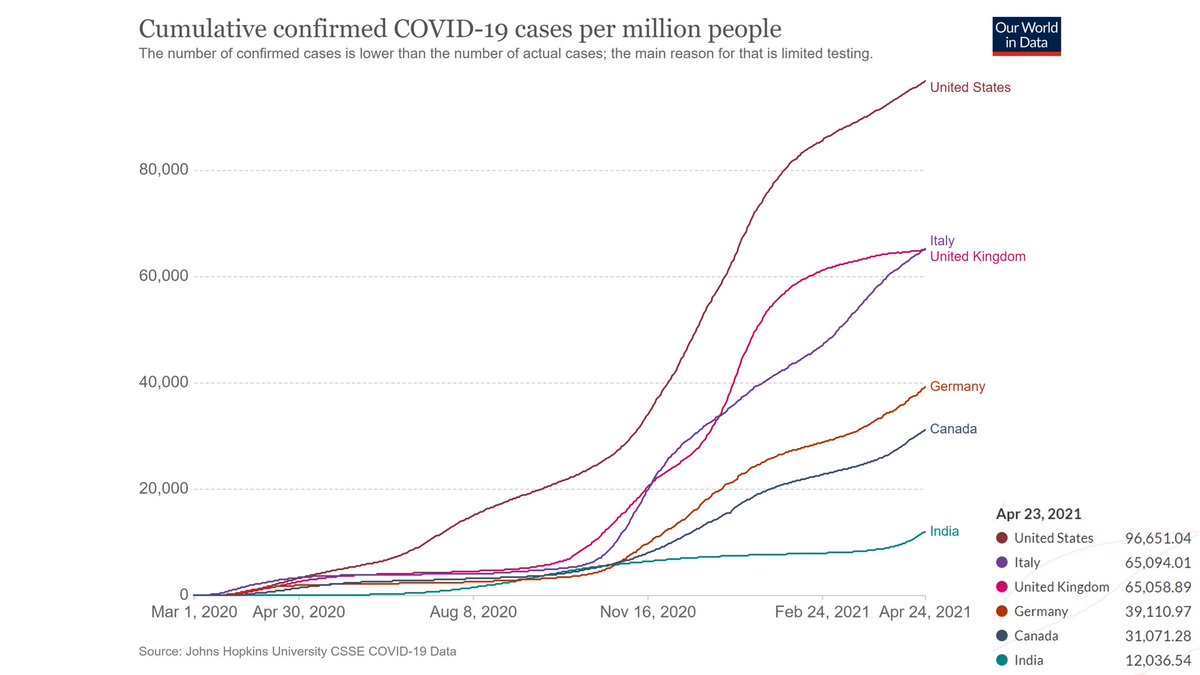
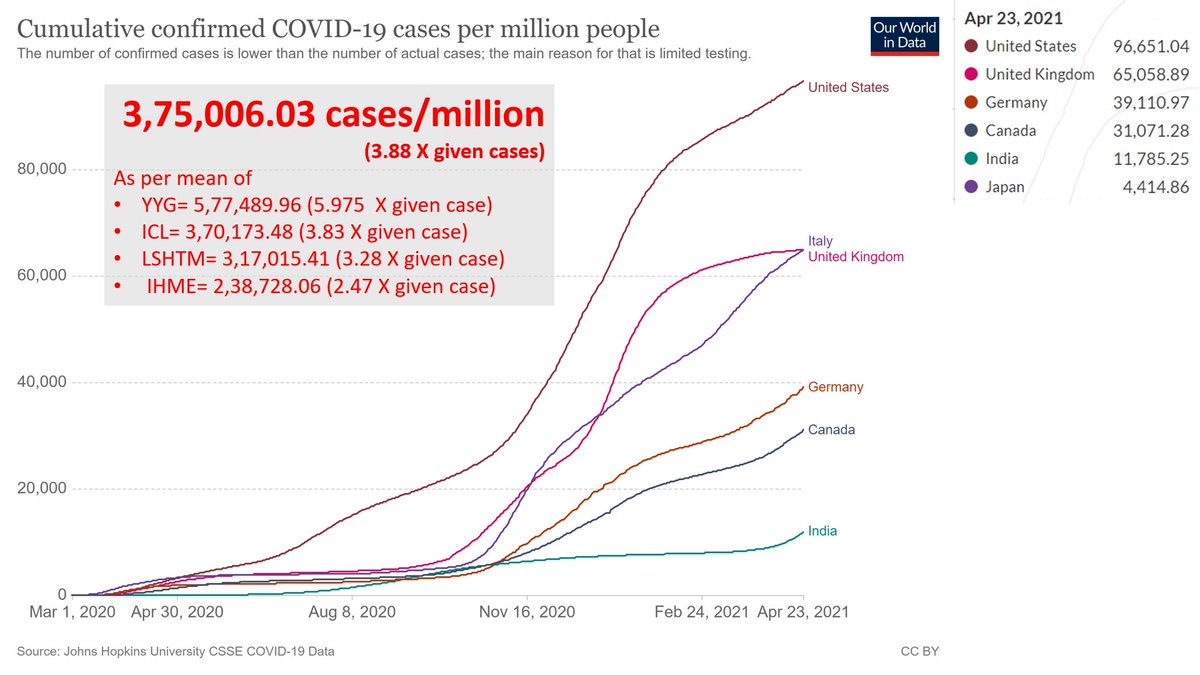
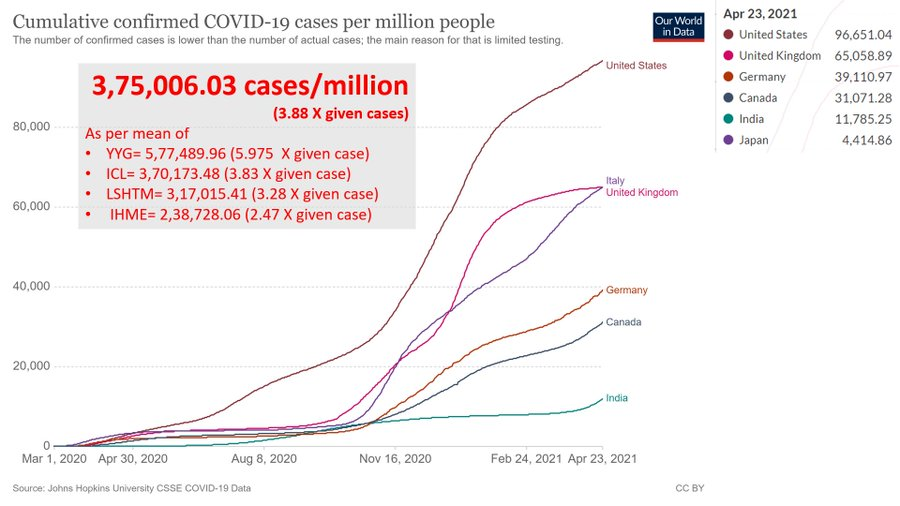
2/n The first important thing to analyse was Confirmed Cases/ Millions based on Cumulative calculations relative to the country& #39;s population.
The crux with major countries is captured in this graph.
USA has 8.20 X, UK has 5.52 X, Germany has 3.31 X /million cases than India.
The crux with major countries is captured in this graph.
USA has 8.20 X, UK has 5.52 X, Germany has 3.31 X /million cases than India.
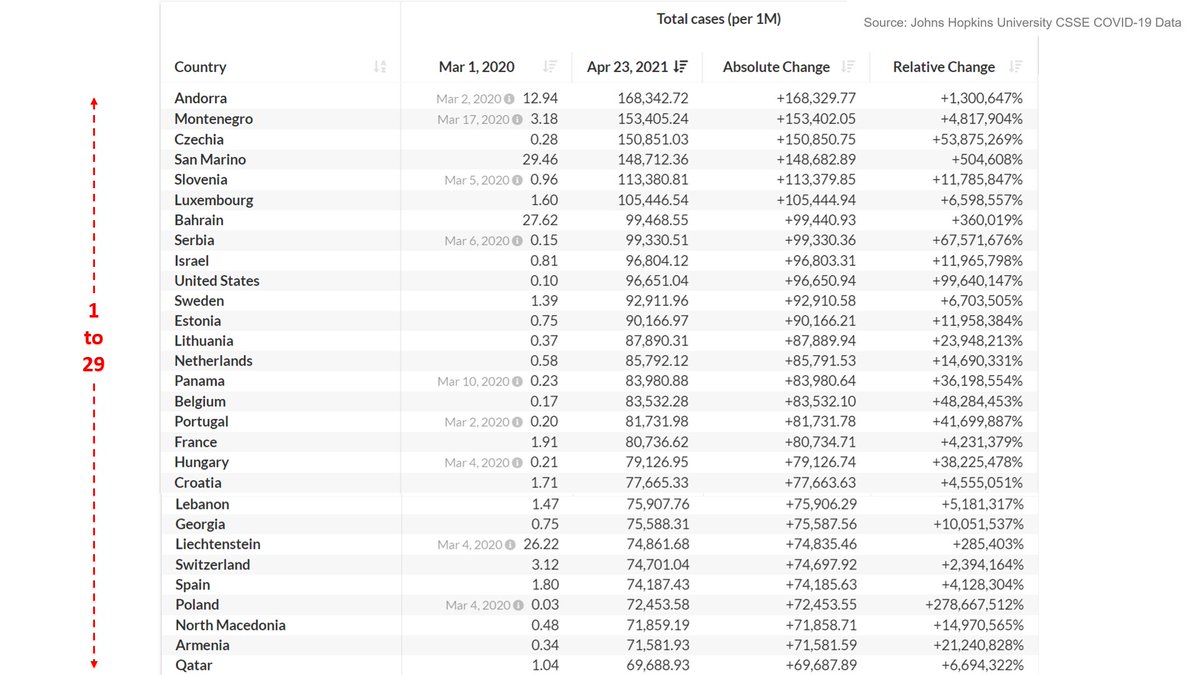
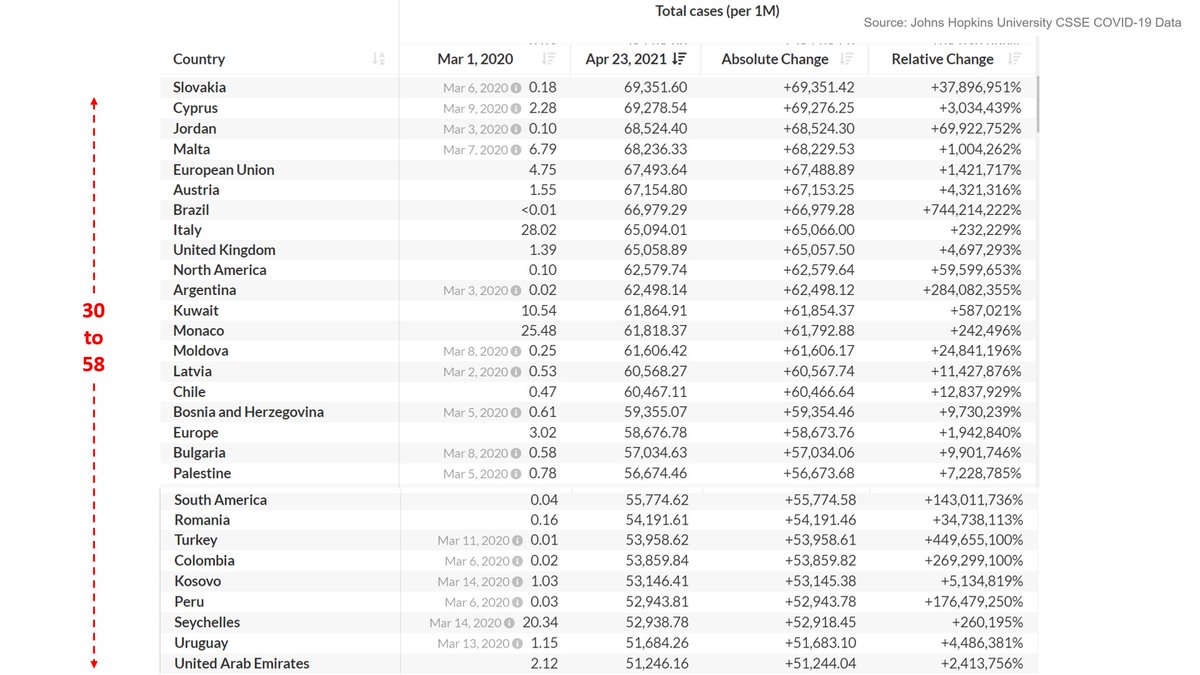
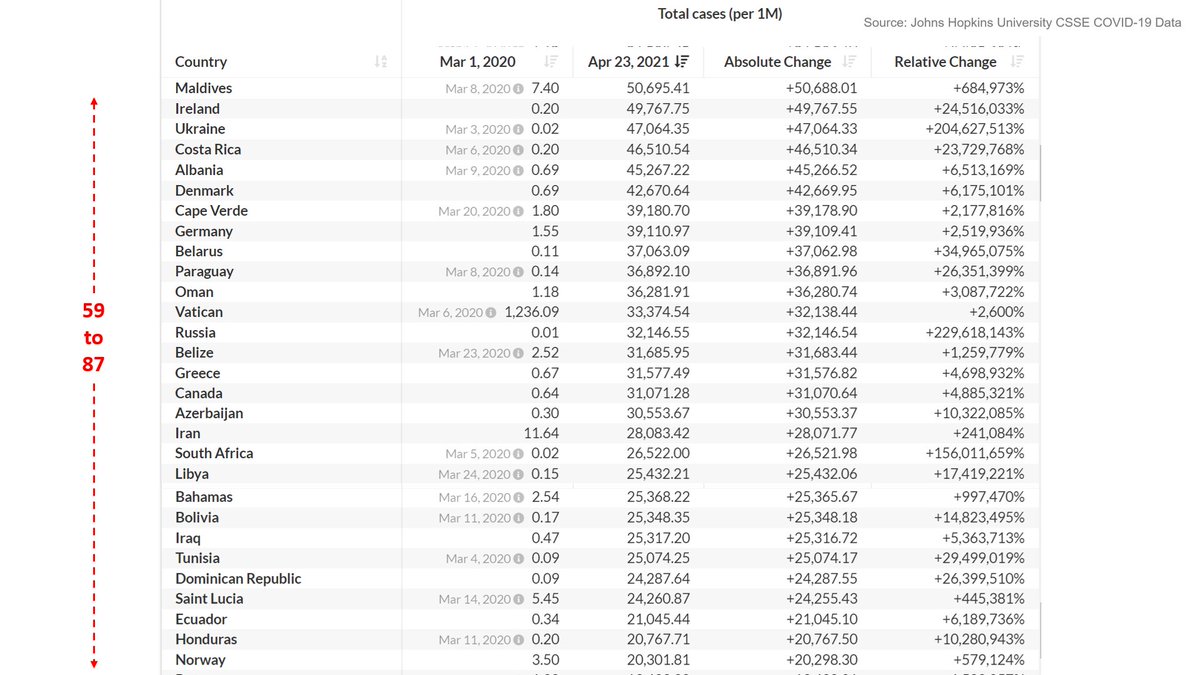
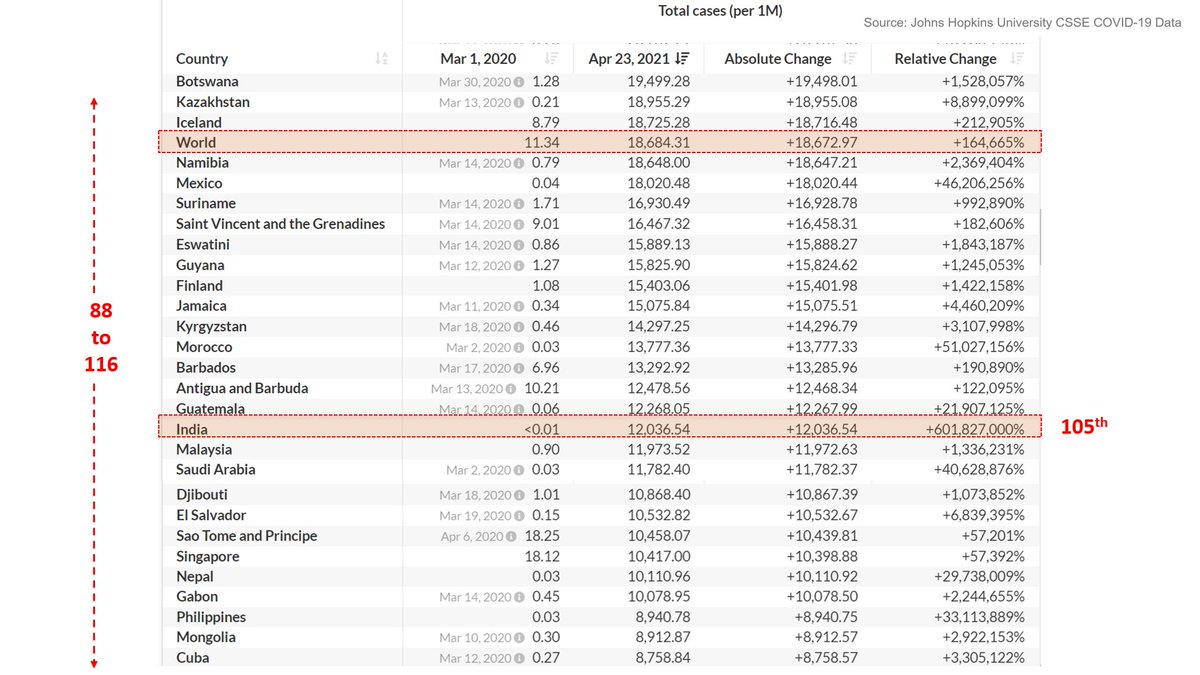
3/n Here the countries are arranged in order of /million & it also shows relative, absolute change % from March 1, 2020 to Apr 23, 2021
India is at 105th position.
The country whose media celebrated pyre in India is way way top.
India is at 105th position.
The country whose media celebrated pyre in India is way way top.
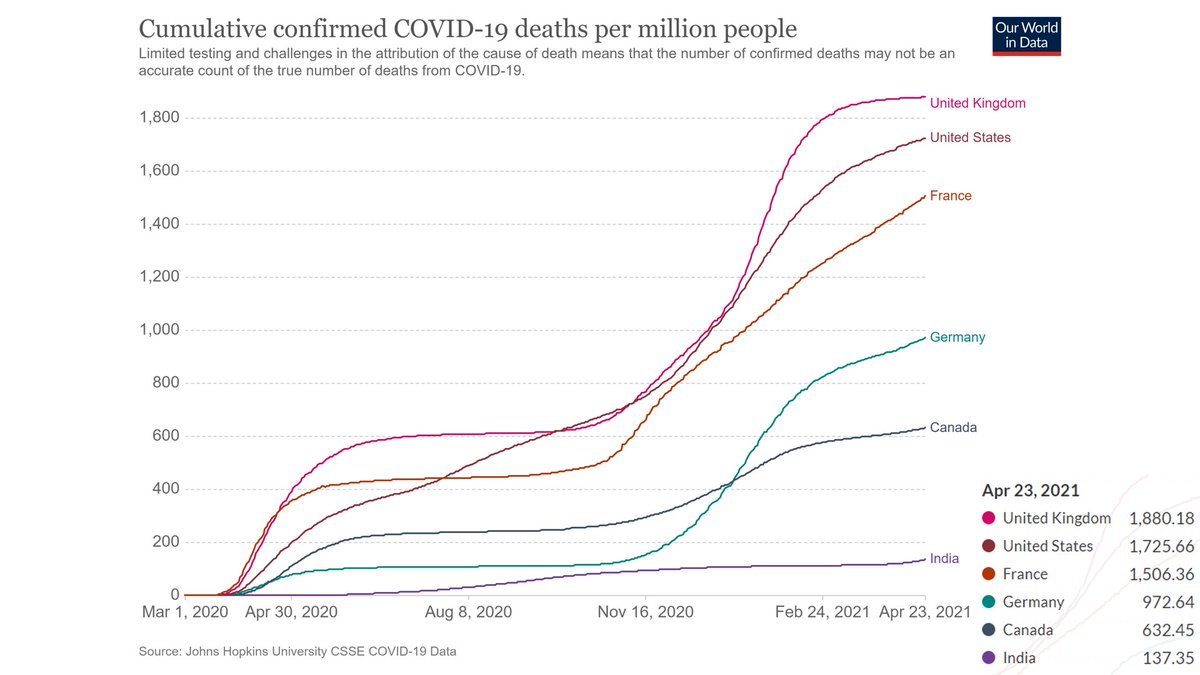
While @BDUTT sees India "broken", @anniegowen puts an "astonishing" image captured by @dansiddiqui , USA seems to be actually broken.
Though "Stunning" pictures have not been captured, Statistics speaks for it.
USA death/million is 12.56X that of India.
https://twitter.com/anniegowen/status/1385276676616069123?s=20">https://twitter.com/anniegowe...
Though "Stunning" pictures have not been captured, Statistics speaks for it.
USA death/million is 12.56X that of India.
https://twitter.com/anniegowen/status/1385276676616069123?s=20">https://twitter.com/anniegowe...
6/n Well as per the detailed Table, India stands at 107th position against 15th of USA for deaths/million.
Interestingly, despite large population footprint, India is even lower than the world average, death tally.
The average of top 15 nations for death rate is around 2300.
Interestingly, despite large population footprint, India is even lower than the world average, death tally.
The average of top 15 nations for death rate is around 2300.
7/n Now we saw that a lots of people are questioning that if India is testing enough.
Ideally speaking, until you have tested all, Testing would never be enough but the realities are much more different.
Let us run an analysis.
Given Fact: Ind 12036 cases/million on 23/4/21
Ideally speaking, until you have tested all, Testing would never be enough but the realities are much more different.
Let us run an analysis.
Given Fact: Ind 12036 cases/million on 23/4/21
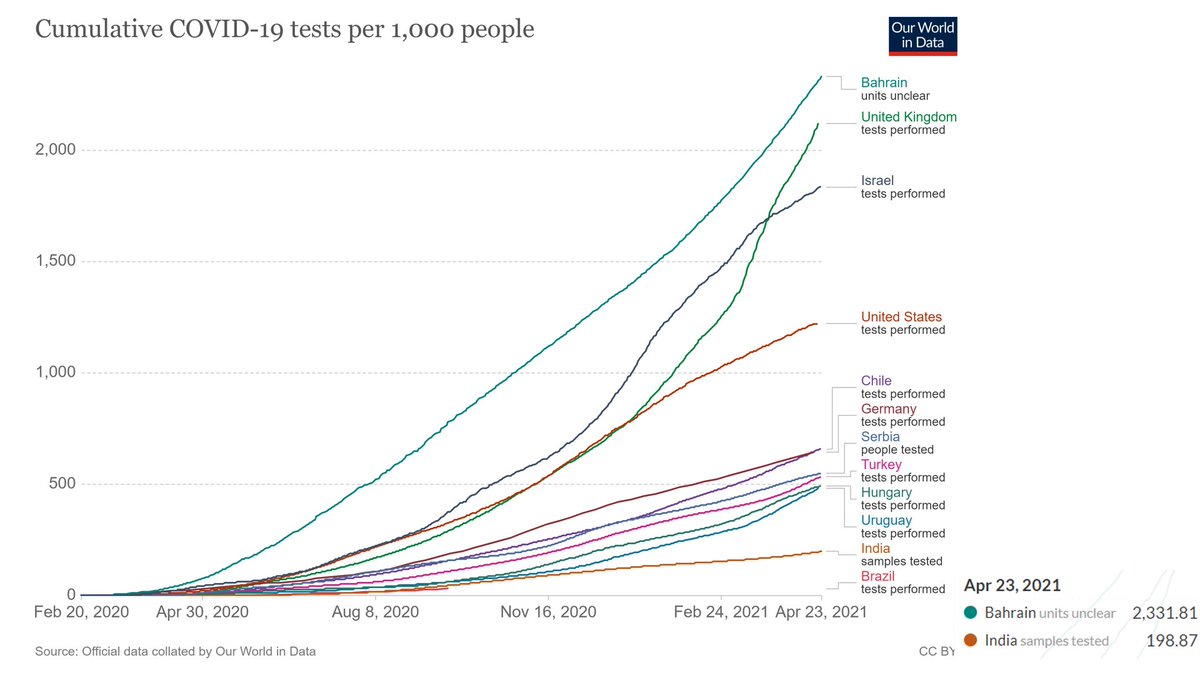
8/n How many tests are we doing right now/ 1000s?
India is testing 198.87/ 1000 when 12036/million cases exist.
Most of the people are comparing our tests with USA where today USA has 8.20 X, UK has 5.52 X, Germany has 3.31 X /million cases than India.
India is testing 198.87/ 1000 when 12036/million cases exist.
Most of the people are comparing our tests with USA where today USA has 8.20 X, UK has 5.52 X, Germany has 3.31 X /million cases than India.
9/n We now need to look at how much tests where major countries doing when the result/million was showing as that of India on April 23, 2021.
Let us pick USA.
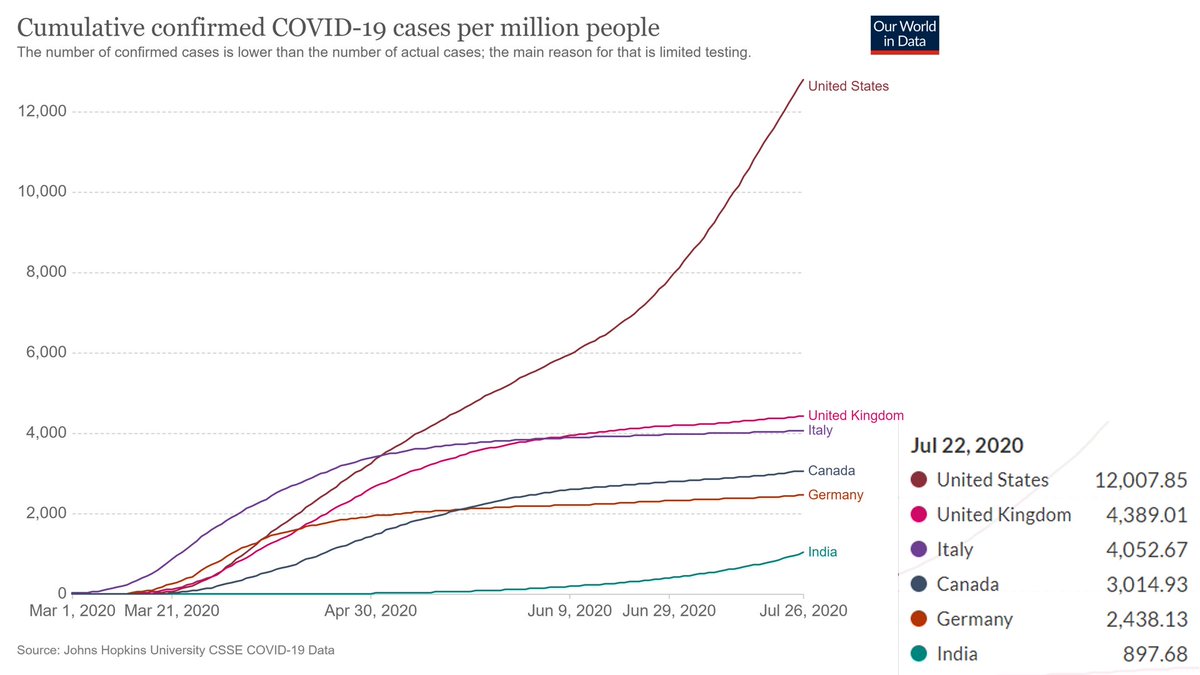
On July 22, 2020 it had 12007 cases/million which is almost similar to what India had on 23/4/2021
Let us pick USA.
On July 22, 2020 it had 12007 cases/million which is almost similar to what India had on 23/4/2021
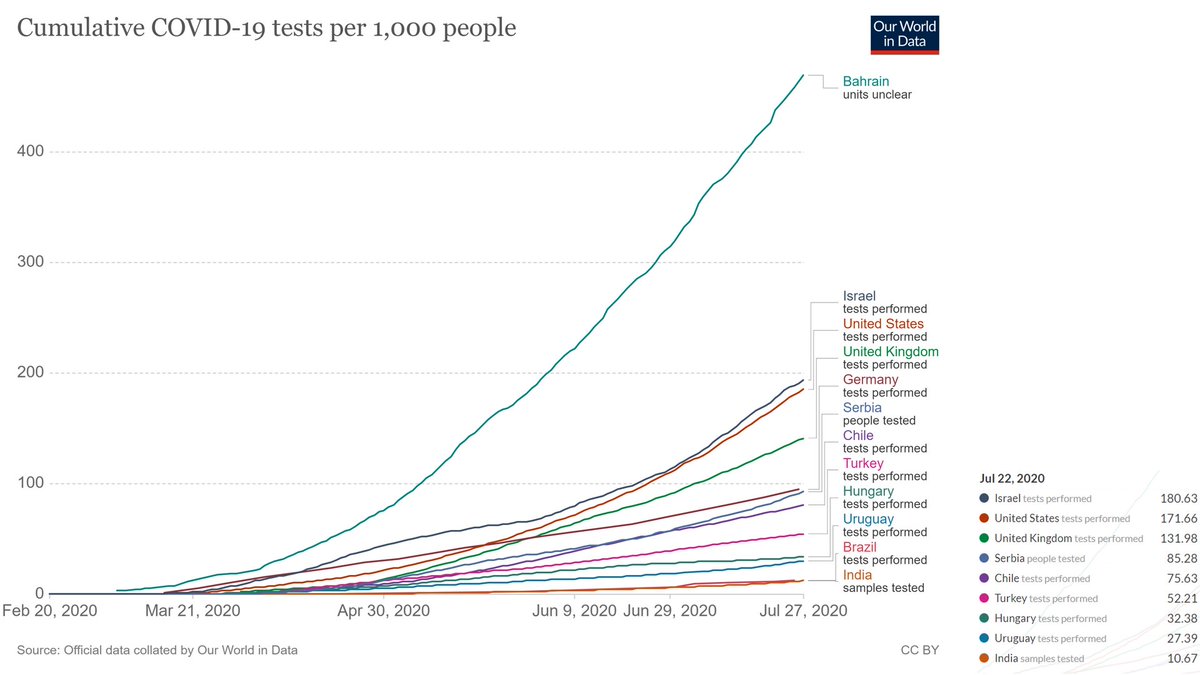
10/n How many tests/ 100 was USA doing as on 22/7/2021?
Well with stats stating 12007.85 cases/million in USA she was doing 171.66 tests/ 1000.
On the other hand as of 23/4/21 Ind with 12036/million cases is testing 198.87/ 1000 (Refer 7/n & 8/n)
So around 15% better than USA.
Well with stats stating 12007.85 cases/million in USA she was doing 171.66 tests/ 1000.
On the other hand as of 23/4/21 Ind with 12036/million cases is testing 198.87/ 1000 (Refer 7/n & 8/n)
So around 15% better than USA.
11/n How many reporters have India or USA have done apple to apple analysis before putting a blame that Indian Government is not active to enhance tests?
Well in 12/n I& #39;ll give more analysis about this concern.
Well in 12/n I& #39;ll give more analysis about this concern.
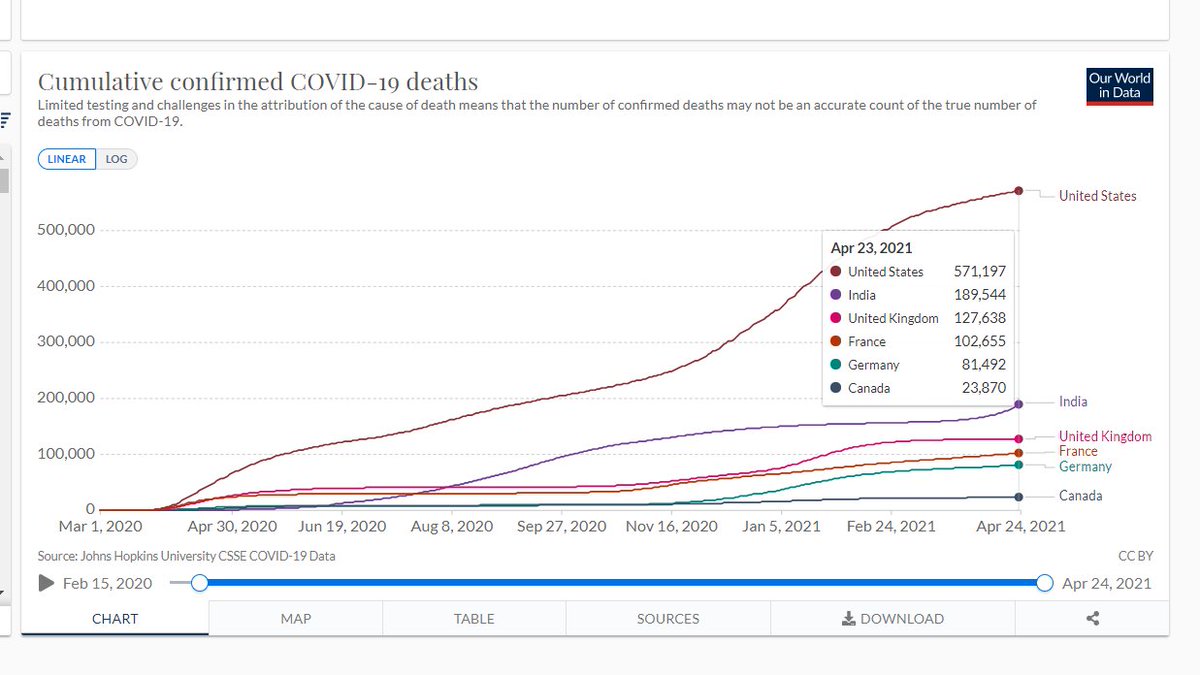
12/n Even if we take this assumption that India& #39;s data is fudged completely and that of USA is completely correct. Till 23/4/2021 confirmed deaths in USA were 3 X (India& #39;s given data/ refer image) then shouldn& #39;t USA also be in collapsed position? https://twitter.com/Aabhas24/status/1385961675874979841?s=20">https://twitter.com/Aabhas24/...
13/n For 12/n assume that India& #39;s actual death is 3X than reported, & is = given number of USA, then why no collapsing news from USA? @washingtonpost any clarification? @anniegowen ?
With 3X under reporting too Ind seems better for death /million https://twitter.com/Aabhas24/status/1385961675874979841?s=20">https://twitter.com/Aabhas24/...
With 3X under reporting too Ind seems better for death /million https://twitter.com/Aabhas24/status/1385961675874979841?s=20">https://twitter.com/Aabhas24/...
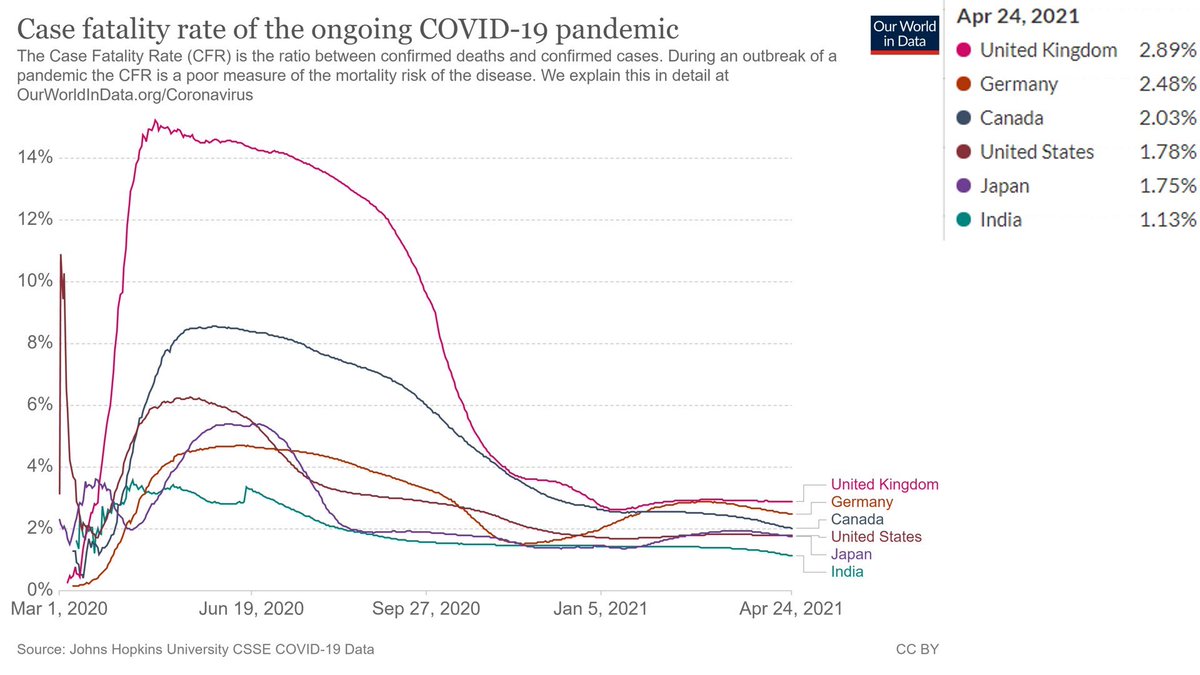
14/n If you ask to any expert, he would inform you that it is "Case fatality rate" that actually gives measure of vulnerability.
CFR=(confirmed deaths /confirmed cases)
So even if we assume claim of under-reporting, this will remain unaffected.
CFR=(confirmed deaths /confirmed cases)
So even if we assume claim of under-reporting, this will remain unaffected.
15/n As of April 24, India has 1.13% CFR, which means following countries are doing:
UK(2.55 X)
Germany(2.19X)
USA (1.57X)
worse than India, but @washingtonpost is busy talking only of India.
UK(2.55 X)
Germany(2.19X)
USA (1.57X)
worse than India, but @washingtonpost is busy talking only of India.
16/n Now, there is speculation of under-reporting.
I run following models on few countries including IND:
1.Imperial College London(ICL)
2.The Institute for Health Metrics and Evaluation(IHME)
3.Youyang Gu(YYG)
4.The London School of Hygiene & Tropical Medicine (LSHTM)
I run following models on few countries including IND:
1.Imperial College London(ICL)
2.The Institute for Health Metrics and Evaluation(IHME)
3.Youyang Gu(YYG)
4.The London School of Hygiene & Tropical Medicine (LSHTM)
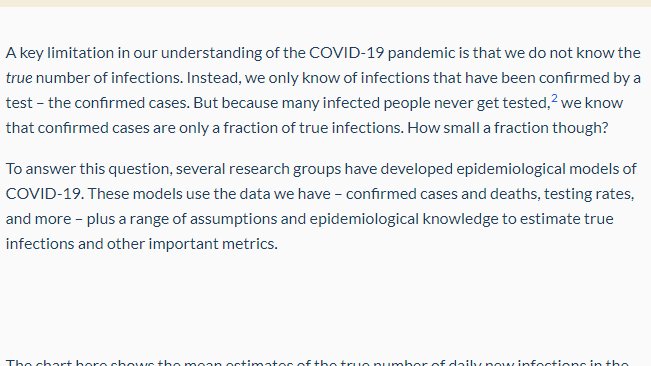
17/n https://ourworldindata.org/ ">https://ourworldindata.org/">... has explained the same concerns what most of the Journalists too have been showing.
But unfortunately Journalists aren& #39;t running the comparative of the models.
In this thread I pick data from the web, last updated on 20/4/2021
But unfortunately Journalists aren& #39;t running the comparative of the models.
In this thread I pick data from the web, last updated on 20/4/2021
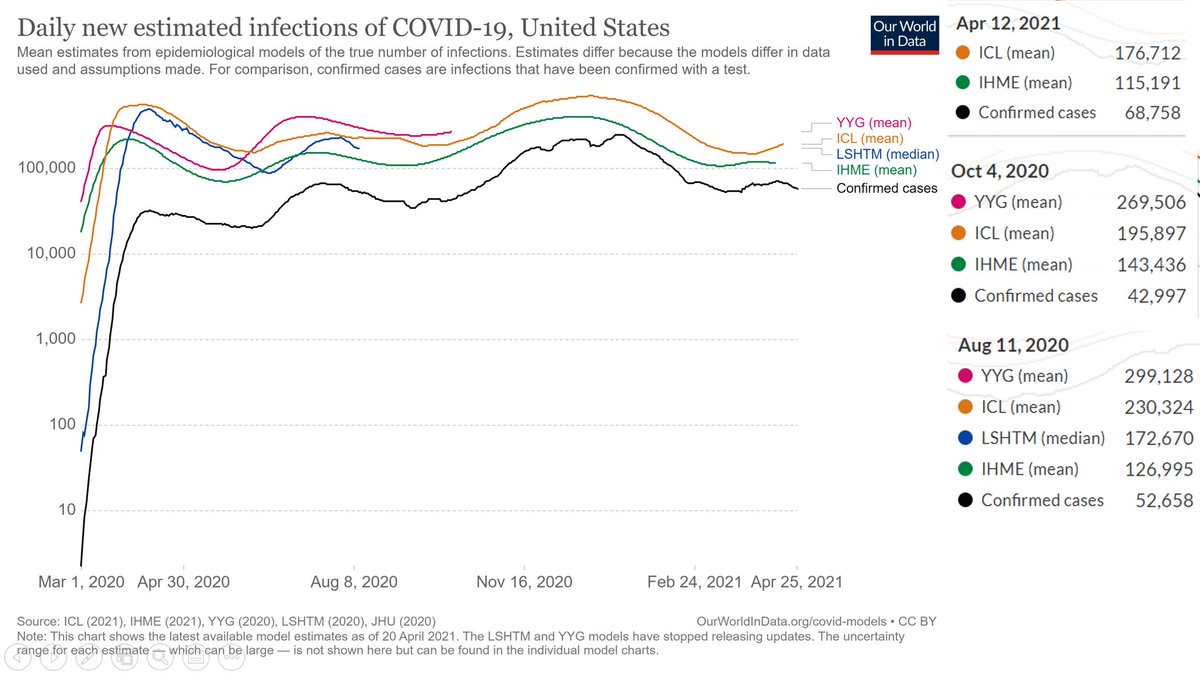
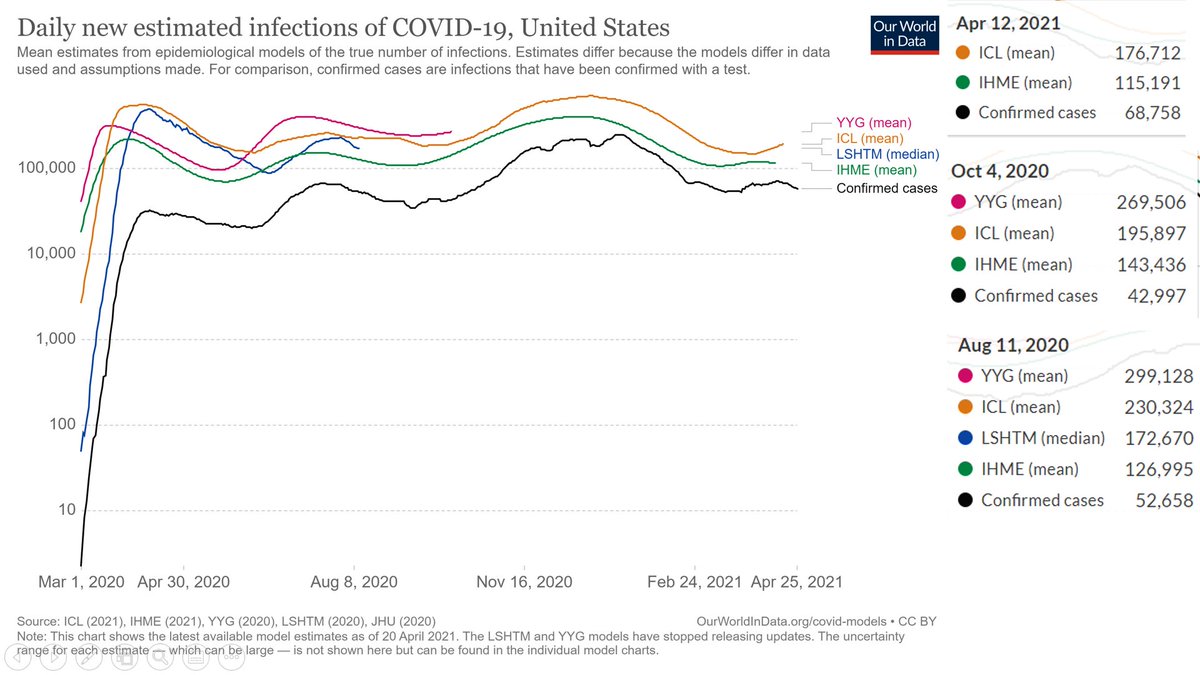
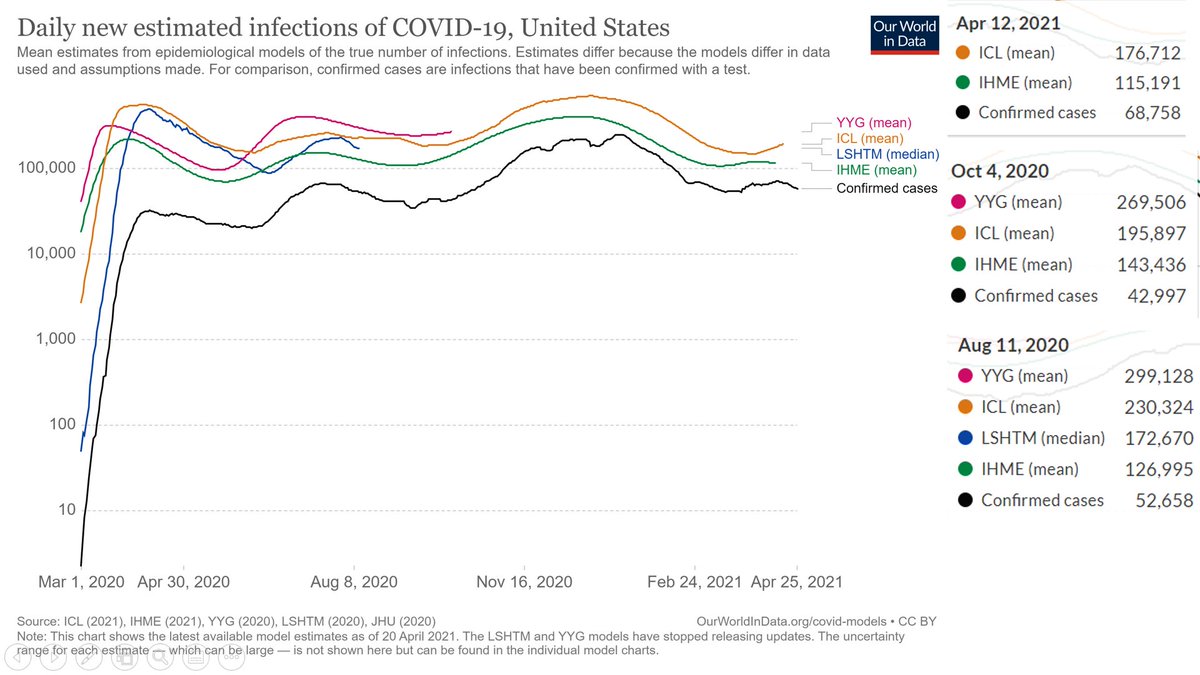
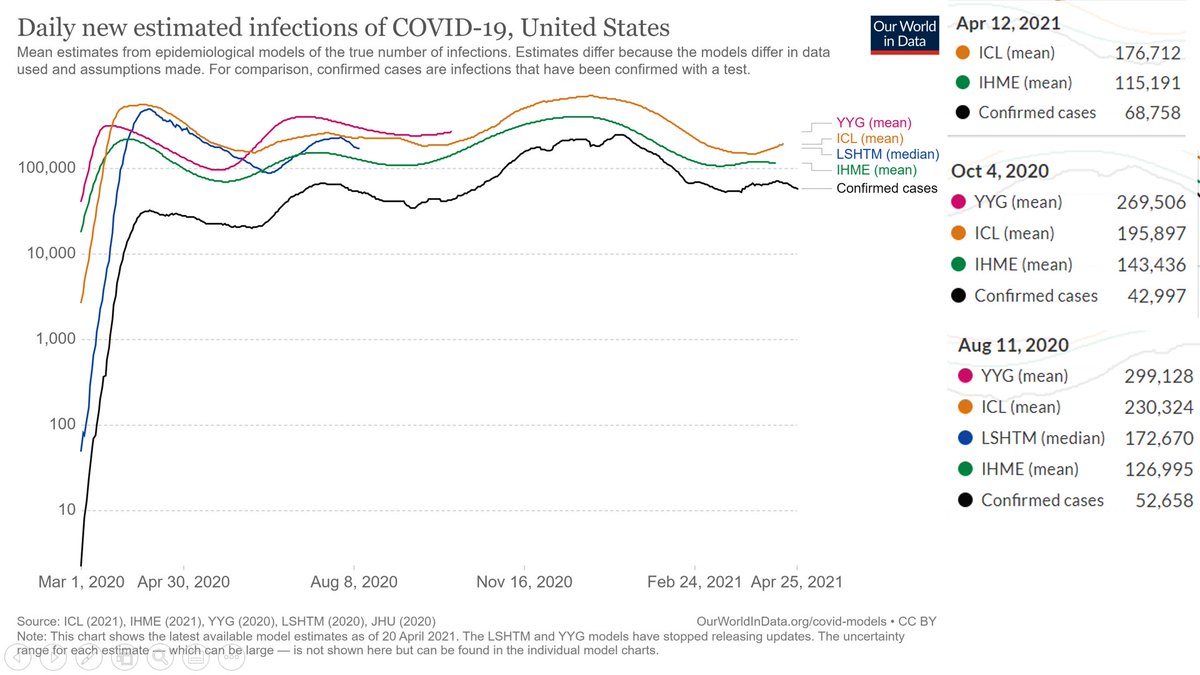
18/n First we will cover "Daily new estimated infections of COVID-19"
Estimates differ because the models differ in data used & assumptions made.
1st Case USA. One can Read the discrepancies in the given graph.
Estimates differ because the models differ in data used & assumptions made.
1st Case USA. One can Read the discrepancies in the given graph.
19/n So now, let us run ratio analysis. Let& #39;s use CC for "Confirmed Cases".
We will evaluate
a)YYG/CC
b)ICL/CC
c)LSHTM/CC
d)IHME/CC
We will evaluate
a)YYG/CC
b)ICL/CC
c)LSHTM/CC
d)IHME/CC
20/n Wrt data on 18/n we do homework for 12/4/2021, 4/10/2020 & 11/8/2020
For, 12/4/2021 (USA)
YYG/CC=NA
ICL/CC=2.57
LSHTM/CC=NA
IHME/CC=1.67
For, 12/4/2021 (USA)
YYG/CC=NA
ICL/CC=2.57
LSHTM/CC=NA
IHME/CC=1.67
23/n Now to establish some relation between these three dates, I do a mean of all. So mean ratio for USA based on the 4 models of fluctuations would be:
YYG/CC=5.975
ICL/CC=3.83
LSHTM/CC=3.28
IHME/CC=2.47
Next, I do mean of all these and call it M=3.88
YYG/CC=5.975
ICL/CC=3.83
LSHTM/CC=3.28
IHME/CC=2.47
Next, I do mean of all these and call it M=3.88
24/n Hence by my basic analysis USA has this much times more daily cases than shown per respective models:
YYG/CC=5.975
ICL/CC=3.83
LSHTM/CC=3.28
IHME/CC=2.47
& overall 3.88 times more than shown cases/day.
YYG/CC=5.975
ICL/CC=3.83
LSHTM/CC=3.28
IHME/CC=2.47
& overall 3.88 times more than shown cases/day.
25/n So what does these models (22/n-24n) do to the current scenario in USA?
Avg affect on Daily Case/ million=625.5 instead of 161.22 as given.
YYG= 963.28 (5.975 X given case)
ICL= 617.47 (3.83 X given case)
LSHTM= 528.80 (3.28 X given case)
IHME= 398.21 (2.47 X given case)
Avg affect on Daily Case/ million=625.5 instead of 161.22 as given.
YYG= 963.28 (5.975 X given case)
ICL= 617.47 (3.83 X given case)
LSHTM= 528.80 (3.28 X given case)
IHME= 398.21 (2.47 X given case)
26/n Cases/ Million in USA
The given number 96651 changes to 375006 based on avg effect of models & respective effects:
YYG= 5,77,489.96 (5.975 X given case)
ICL= 3,70,173.48 (3.83 X given case)
LSHTM= 3,17,015.41 (3.28 X given case)
IHME= 2,38,728.06 (2.47 X given case)
The given number 96651 changes to 375006 based on avg effect of models & respective effects:
YYG= 5,77,489.96 (5.975 X given case)
ICL= 3,70,173.48 (3.83 X given case)
LSHTM= 3,17,015.41 (3.28 X given case)
IHME= 2,38,728.06 (2.47 X given case)
27/n Before I run YYG, ICL, LSHTM, IHME models to analyse the probable errors in Indian Statistics.
I though to show how media has reported during worst days of USA, UK & now India (based SEO).
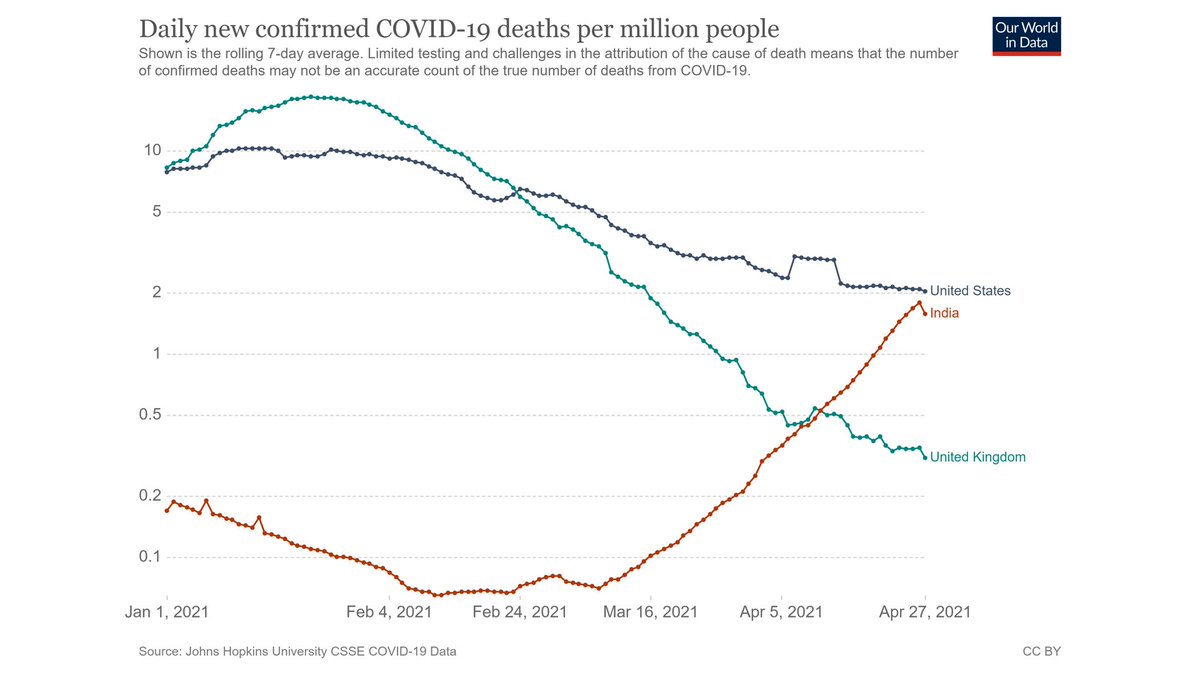
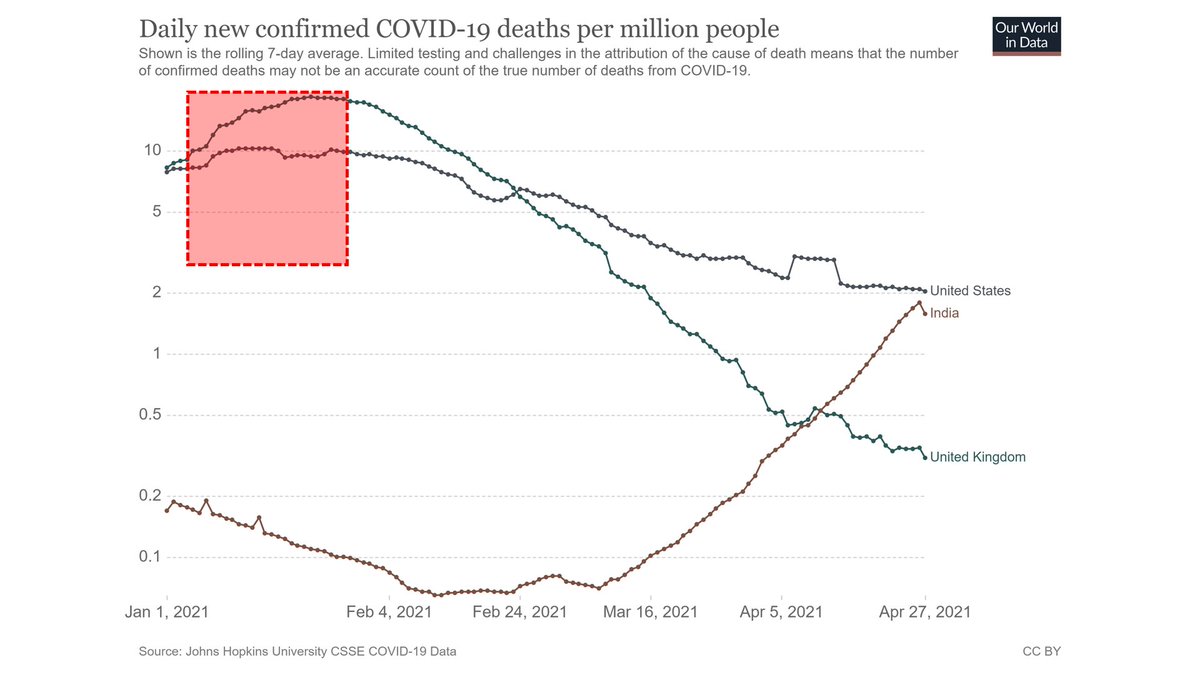
January 2021 was seeing massive death/millions in UK & USA. Check the graph.
I though to show how media has reported during worst days of USA, UK & now India (based SEO).
January 2021 was seeing massive death/millions in UK & USA. Check the graph.
28/n Note that India has still not that close, considering even USA, UK had error in stats (established in 22/n -26/n).
So what are most relevant news for USA in Jan 2021?
Watch the image showing relevant news as per SEO of @Google ?
So what are most relevant news for USA in Jan 2021?
Watch the image showing relevant news as per SEO of @Google ?
29/n Well, all the news of USA in that range are about:
"What gov, vaccine company and everyone else is doing for USA."
Although USA was facing worst crisis of death/million including Oxygen, Hospital Bed & Graveyard Crisis.
Also note the featured images. None negative.
"What gov, vaccine company and everyone else is doing for USA."
Although USA was facing worst crisis of death/million including Oxygen, Hospital Bed & Graveyard Crisis.
Also note the featured images. None negative.
30/n Even UK was witnessing way more deaths/million in Jan 2021 than what India witnessed last week.
Yet look what kind of news are coming as most relevant ones during that period?
All reporting what UK government is doing for the people. Though medical crisis was there too.
Yet look what kind of news are coming as most relevant ones during that period?
All reporting what UK government is doing for the people. Though medical crisis was there too.
31/n Now coming to India.
Look what death/million is compared to USA & UK (red marking) in first graphical image.
And now observe reporting of Indian News (7 April to today). Check relevant news (image 2)
Look what death/million is compared to USA & UK (red marking) in first graphical image.
And now observe reporting of Indian News (7 April to today). Check relevant news (image 2)
32/n What diff you observe?
In peak of USA & UK, relevant news were on how the govt are helping country though in case of India news was flooded with India is collapsing (with showing sacred Pyres) & how rest of the world (not Govt)is helping. (though our stats r better).
In peak of USA & UK, relevant news were on how the govt are helping country though in case of India news was flooded with India is collapsing (with showing sacred Pyres) & how rest of the world (not Govt)is helping. (though our stats r better).
33/n Let us now check the errors in Indian Stats based on four models& #39; data which I showed for USA (tweets 18/n-26/n). It gave us that US case/millions rising by an avg of 3.88X and max by 5.75X.
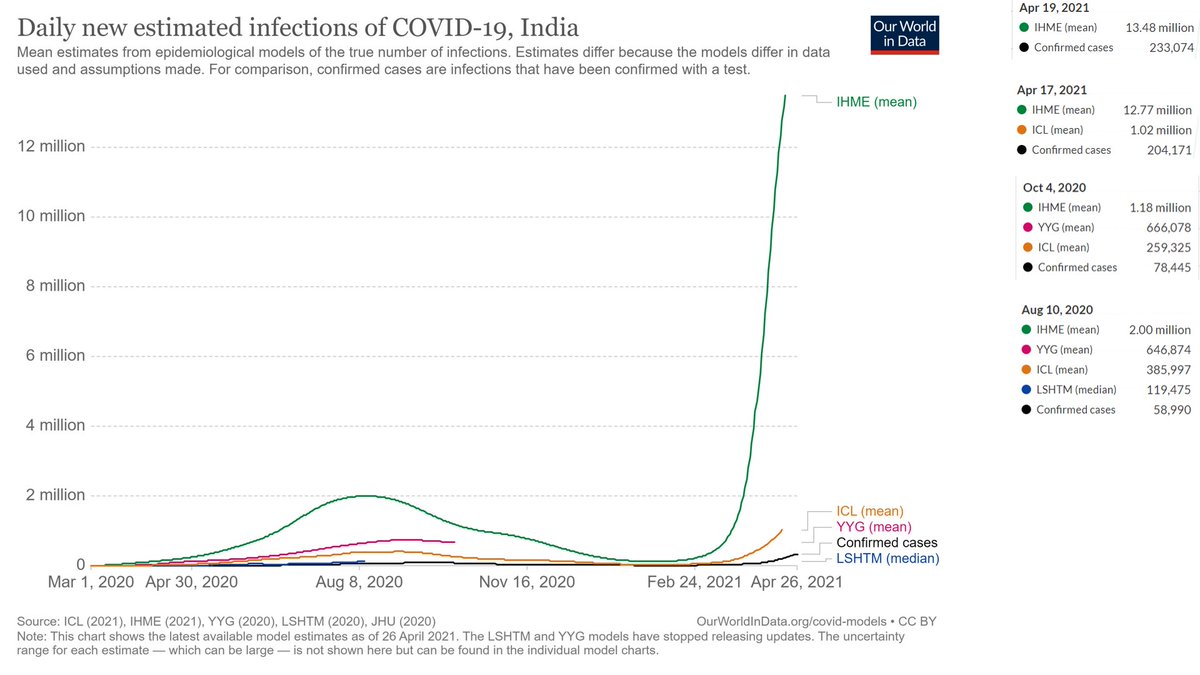
So refer this graph with nos of various models.
https://twitter.com/Aabhas24/status/1386632205951062017?s=20">https://twitter.com/Aabhas24/...
So refer this graph with nos of various models.
https://twitter.com/Aabhas24/status/1386632205951062017?s=20">https://twitter.com/Aabhas24/...
34/n We& #39;ll analyse "Daily new estimated infections of COVID-19"
Estimates differ because the models differ in data used & assumptions made.
So now, let us run ratio analysis. Let& #39;s use CC for "Confirmed Cases".
We will evaluate
a)YYG/CC
b)ICL/CC
c)LSHTM/CC
d)IHME/CC
Estimates differ because the models differ in data used & assumptions made.
So now, let us run ratio analysis. Let& #39;s use CC for "Confirmed Cases".
We will evaluate
a)YYG/CC
b)ICL/CC
c)LSHTM/CC
d)IHME/CC
35/n Wrt data on 33/n we do homework for 19/4/2021, 17/4/2021, 4/10/2020 & 10/8/2020
For, 19/4/2021 (Ind)
YYG/CC=NA
ICL/CC=NA
LSHTM/CC=NA
IHME/CC=57.83
For, 19/4/2021 (Ind)
YYG/CC=NA
ICL/CC=NA
LSHTM/CC=NA
IHME/CC=57.83
39/n Now to establish some relation between these 4 dates, I do a mean of all. So mean ratio for India based on the 4 models of fluctuations would be:
YYG/CC=9.725
ICL/CC=4.94
LSHTM/CC=2.02
IHME/CC=42.32
Mean of all these (say M2)=14.75
Mean of 3 (without IHME)say M3=5.56
YYG/CC=9.725
ICL/CC=4.94
LSHTM/CC=2.02
IHME/CC=42.32
Mean of all these (say M2)=14.75
Mean of 3 (without IHME)say M3=5.56
40/n Hence by my basic analysis India has this much times more daily cases than shown per respective models:
YYG/CC=9.725
ICL/CC=4.94
LSHTM/CC=2.02
IHME/CC=42.32
& overall 14.75 X & 5.56 X (without IHME) more than shown cases/day.
YYG/CC=9.725
ICL/CC=4.94
LSHTM/CC=2.02
IHME/CC=42.32
& overall 14.75 X & 5.56 X (without IHME) more than shown cases/day.
41/n So what does these models do to the current scenario in India?
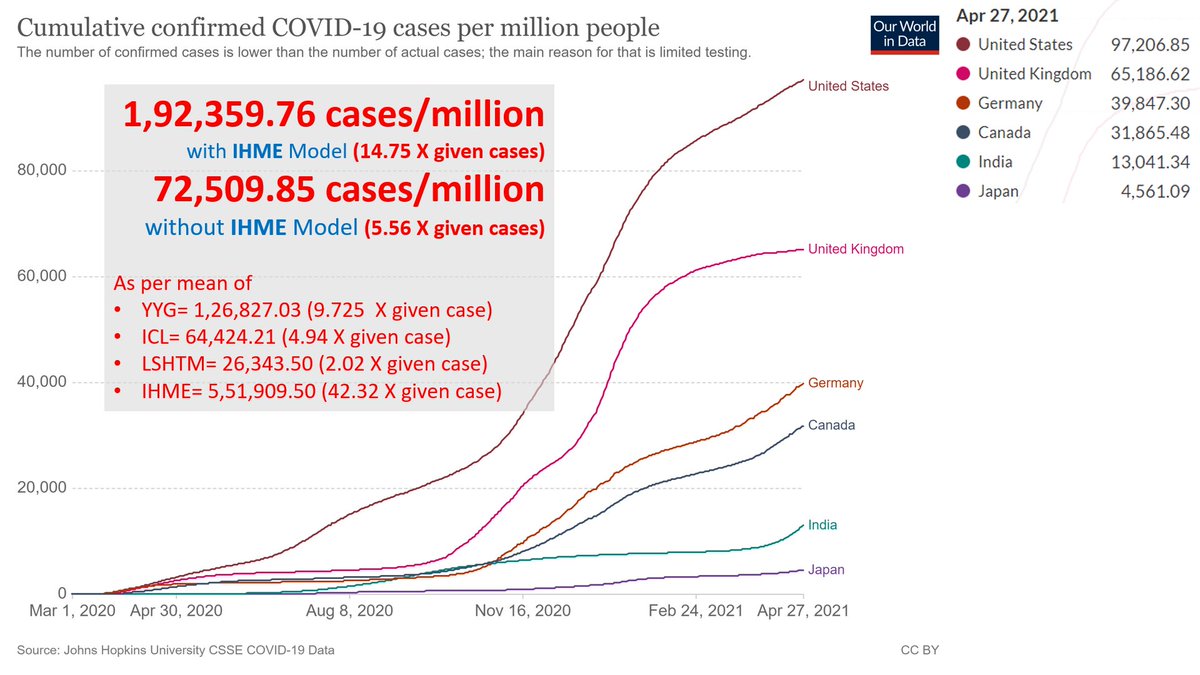
The given cases/million=13041, changes to 1,92,359 (with IHME) & 72,509(without IHME).
Well this is almost almost half of USA (cases/million on 23/4)despite India& #39;s error factor being 14.75 instead of 3.88(USA)
The given cases/million=13041, changes to 1,92,359 (with IHME) & 72,509(without IHME).
Well this is almost almost half of USA (cases/million on 23/4)despite India& #39;s error factor being 14.75 instead of 3.88(USA)
42/n The numbers based on avg effect of models & respective effects:
YYG= 1,26,827.03 (9.725 X)
ICL= 64,424.21 (4.94 X)
LSHTM= 26,343.50 (2.02 X)
IHME= 5,51,909.50 (42.32 X)
India& #39;s numbers are way lesser despite higher error factors.
YYG= 1,26,827.03 (9.725 X)
ICL= 64,424.21 (4.94 X)
LSHTM= 26,343.50 (2.02 X)
IHME= 5,51,909.50 (42.32 X)
India& #39;s numbers are way lesser despite higher error factors.

 Read on Twitter
