1. The @coinbase IPO last week was amazing to watch. From an options perspective, we now have a glimpse of how tradfi MMs (ie: Citadel/SIG) are pricing vol in crypto. Given $COIN options started trading on April 20, I spent some time looking into the first day of market data.
2. Disclaimer: this is not investment advice. Also, I’m using CBOE EOD options data as of April 20, 2021 to run this analysis in case anyone wants to replicate this modelling.
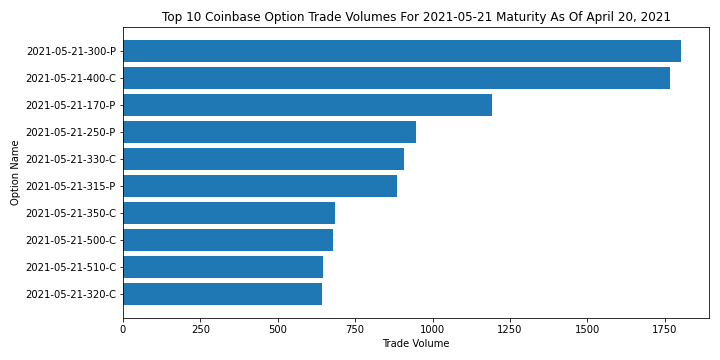
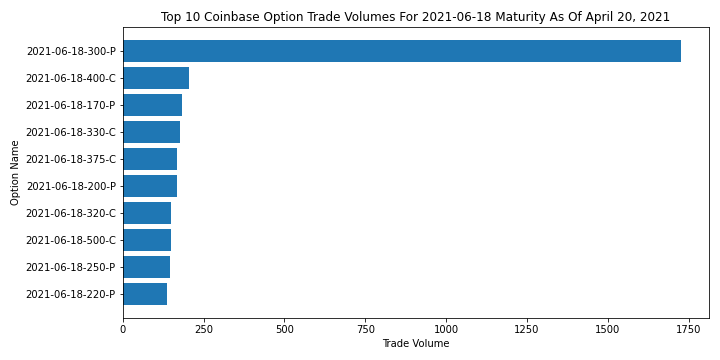
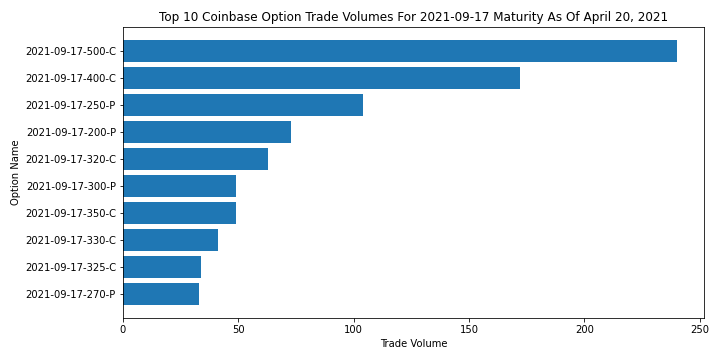
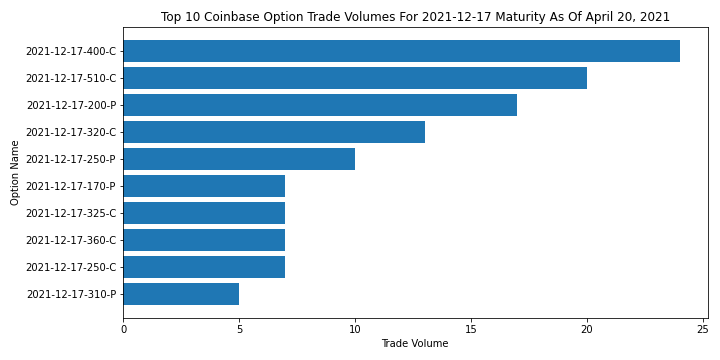
3. Let’s first start by looking at the top trading volume. While this metric in itself doesn’t tell us exactly what investors are doing, we can make reasonable guesses on what’s going on.
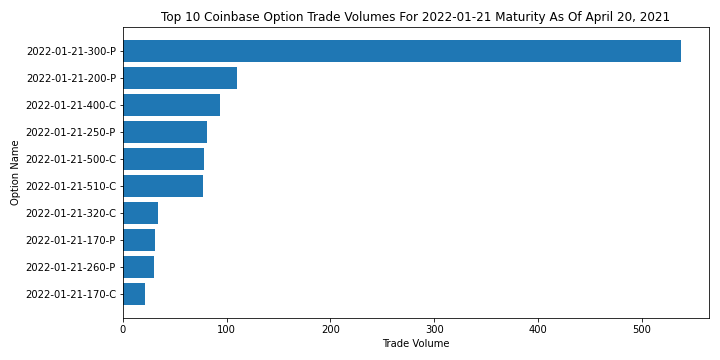
4. May/June maturities had a huge influx of $300 puts - I’m guessing insiders may want to hedge their shares or perhaps speculators are betting on a decline in price.
5. It could also be people wanting to lower their cost basis for $COIN shares by selling puts and eventually buying if the price breaches the lower strike. IMO the first scenario is most likely given the bearish price action over the past weekend.
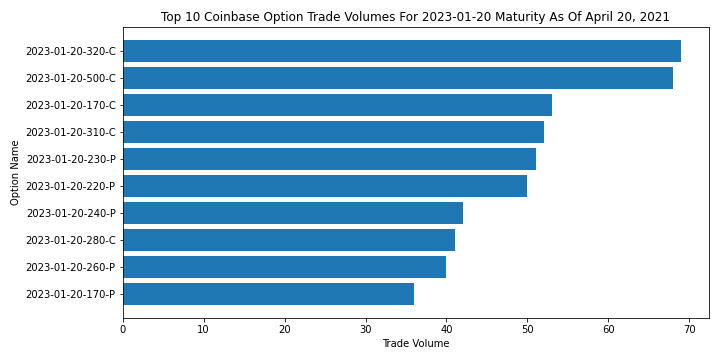
6. Sept/Dec saw large volumes of calls ranging from $400-$500. I think these flows are betting on a continuation of the bull market well into Q4/21. It’s less clear what the market is doing in Jan/23 but main flows were $320/$500 calls. Lastly, Jan/22 had heavy $300 put activity.
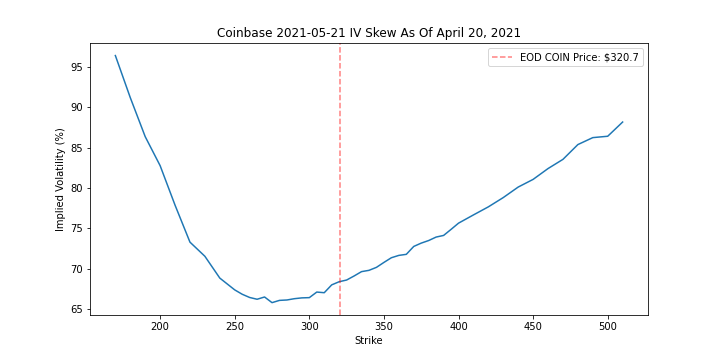
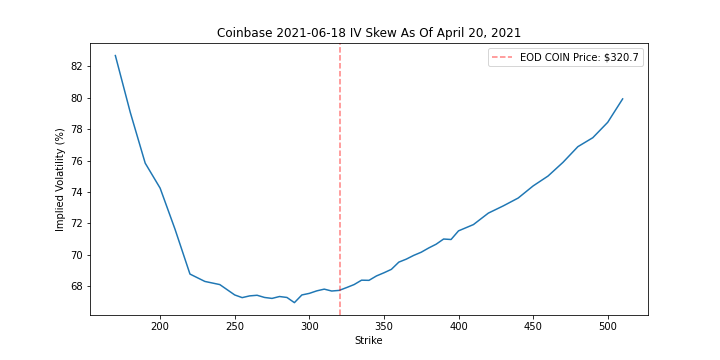
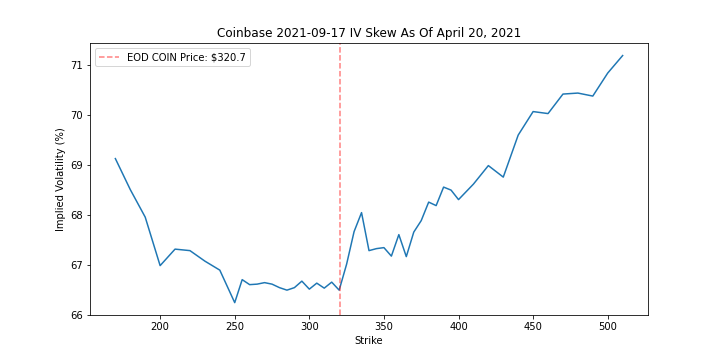
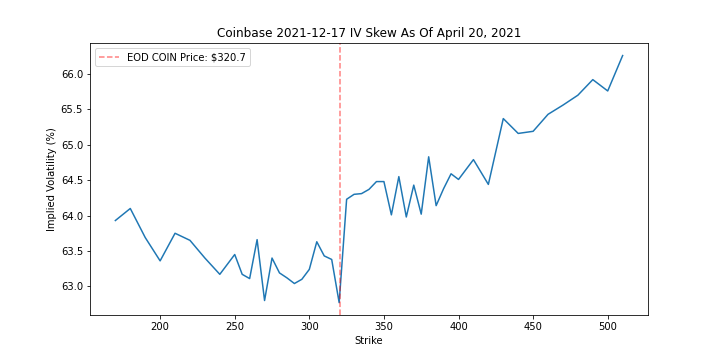
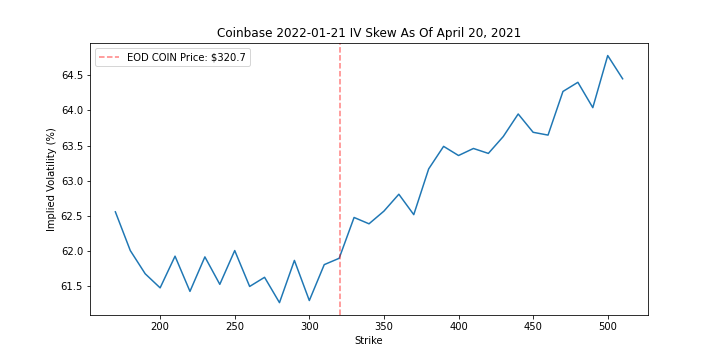
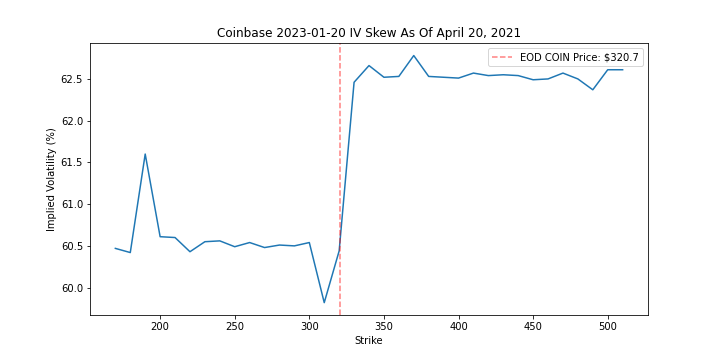
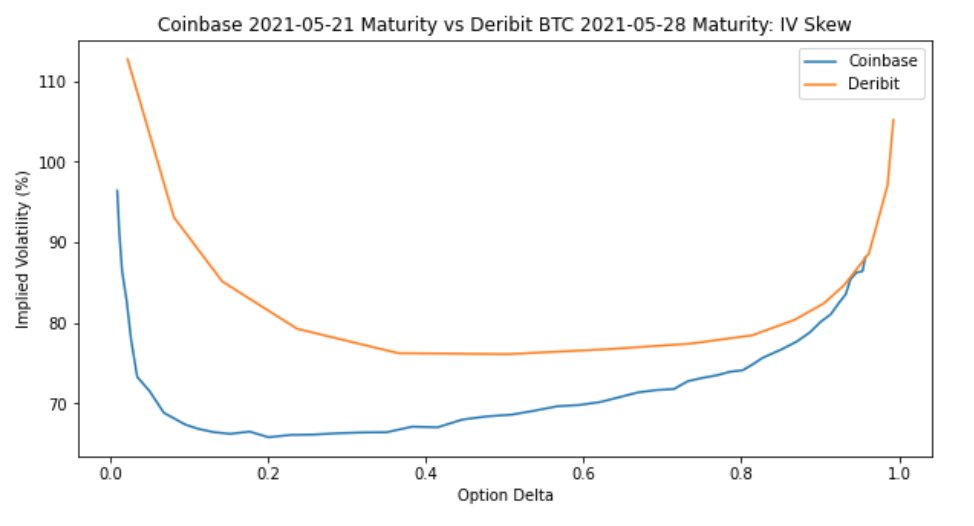
7. Let’s take a look at some IV skews. May/June have relatively smooth vol curves with a steeper OTM put skew relative to OTM calls. This suggests MMs believe the chances of downside jumps are greater than upside jumps for these given maturities.
8. The IV skews get messier as we move to Sept/Dec and 2022/2023 maturities. Recall this is just the first day of trading so it’ll take time for these curves to attract more liquidity.
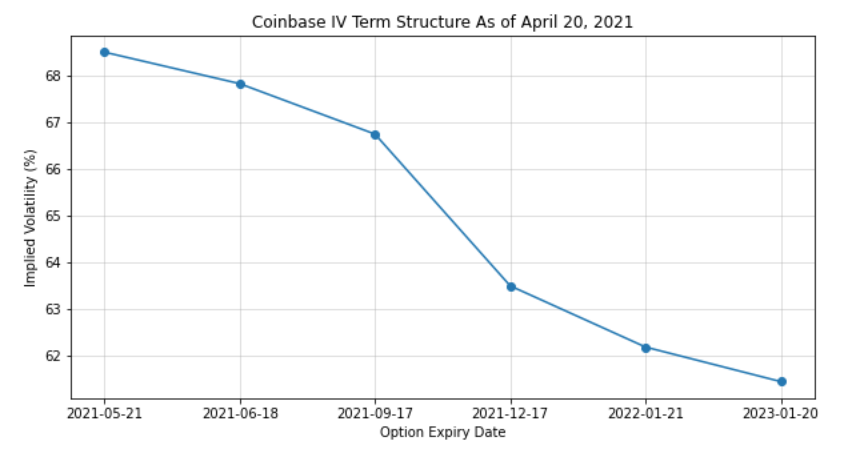
9. The ATM IV term structure is in backwardation. This makes sense because as $COIN just started trading, the volatility from the IPO should subside over the coming few months.
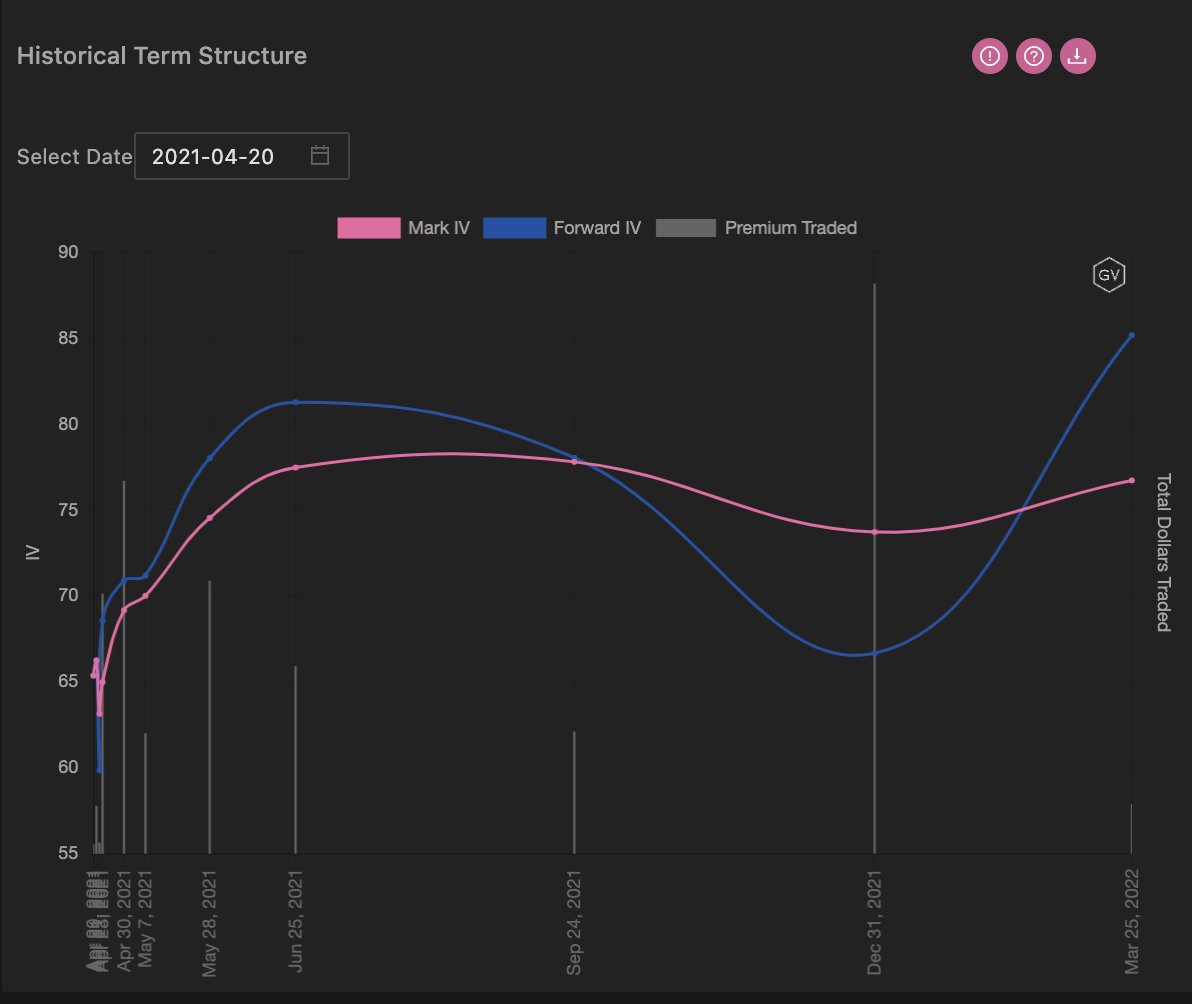
10. Similarly, we can see @GenesisVol& #39;s term structure for BTC on April 20 is flat and in backwardation for maturities between May/21 to March/22. It& #39;s reassuring to see that option markets are anticipating lower vol for both assets well into Q4/21.
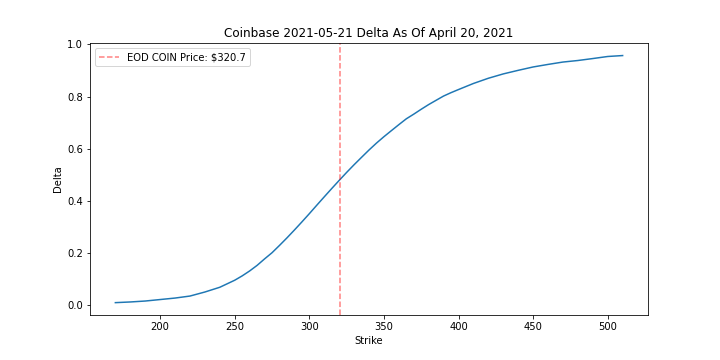
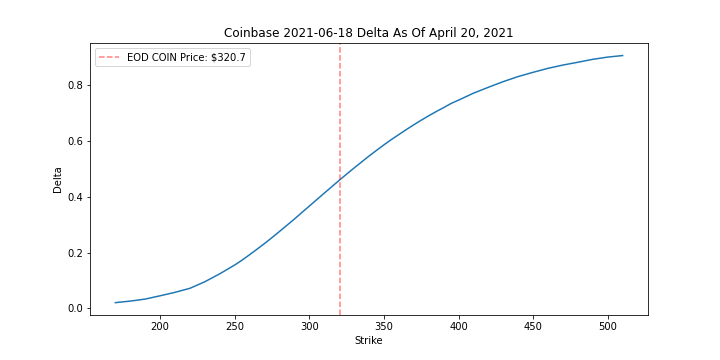
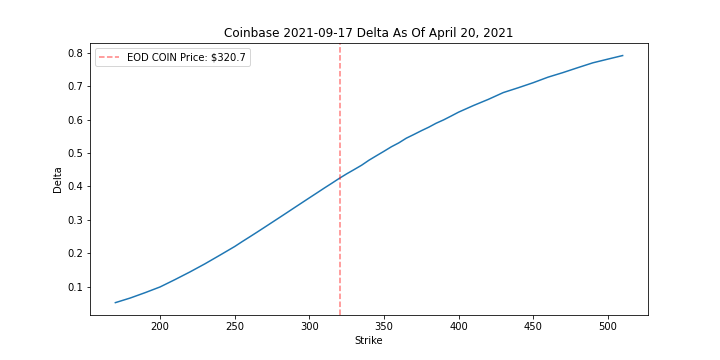
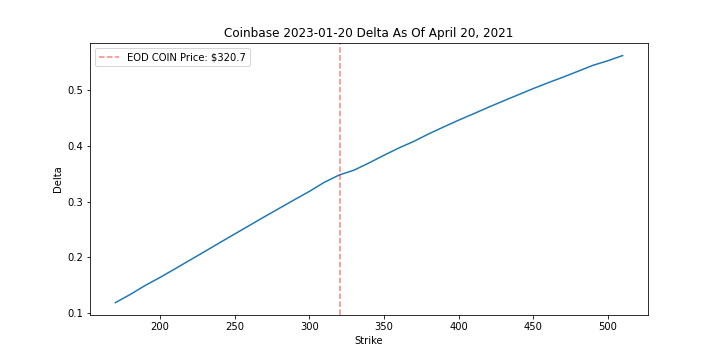
11. We can also look at the option deltas. One thing to note is the 2023 maturity delta plot - the linear exposure in delta across all strikes will change over time as the option decays. In other words, it will derive more gamma as shown by the curvature for short-dated options.
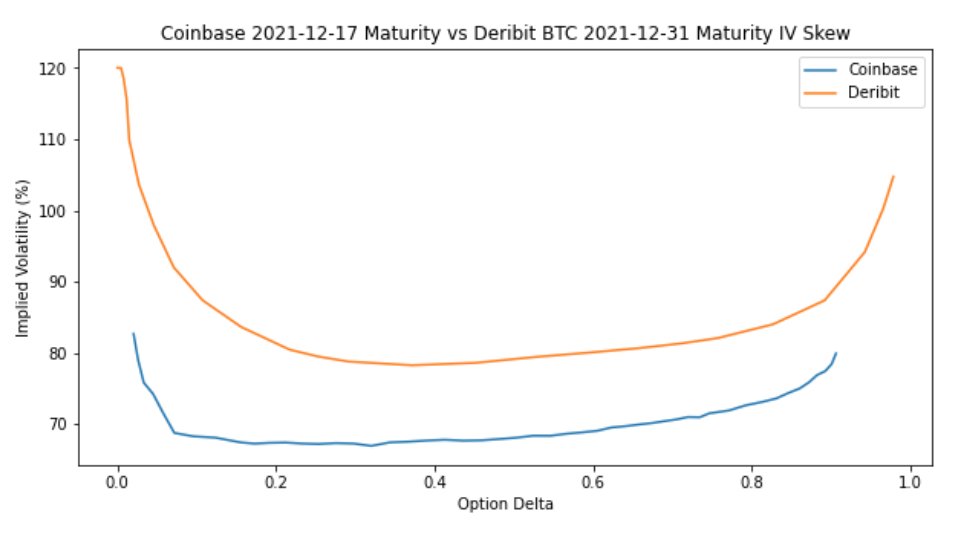
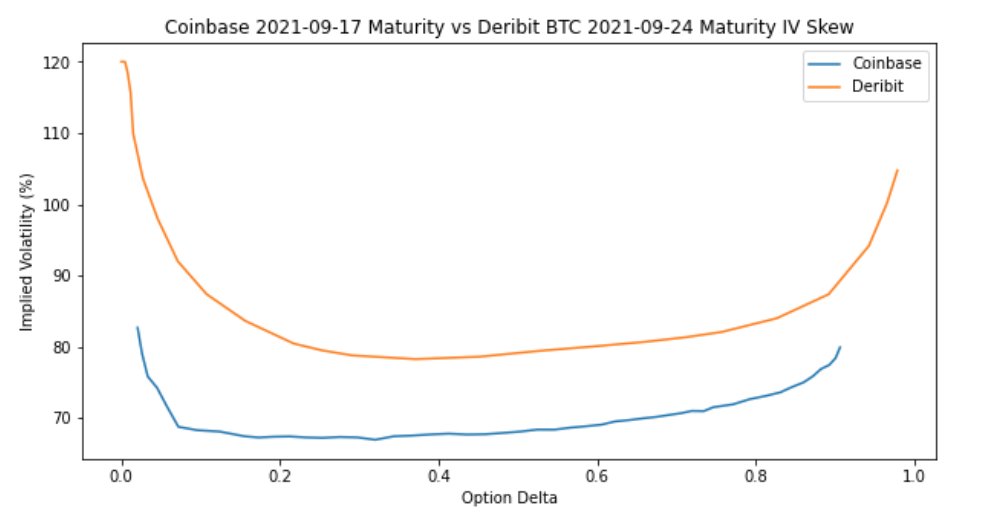
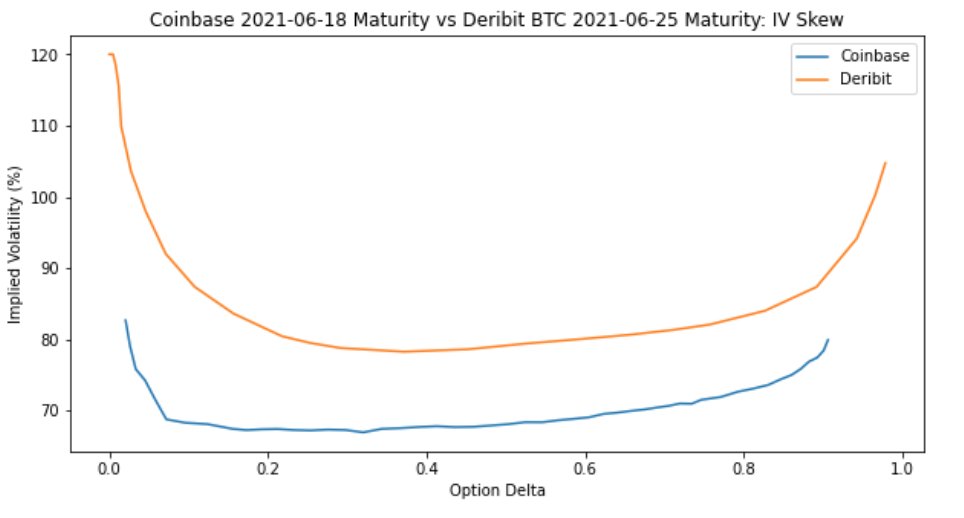
12. Lastly - the most interesting part was to compare the IV of $COIN vs BTC after normalizing with delta. I was surprised to find MMs are pricing $COIN ATM IV roughly 20 vol points lower than BTC ATM IV for nearly every maturity.
13. I find this strange because $COIN is a recently IPO’d company so I thought the ATM vol would be higher (at least that of BTC).
14. Any thoughts on this? Although there are easier games to play, do you think there’s a relative value opportunity here?
@Ksidiii @GammaHamma22 @mgnr_io @fb_gravitysucks
@Ksidiii @GammaHamma22 @mgnr_io @fb_gravitysucks

 Read on Twitter