Just updated my weather IV working paper:
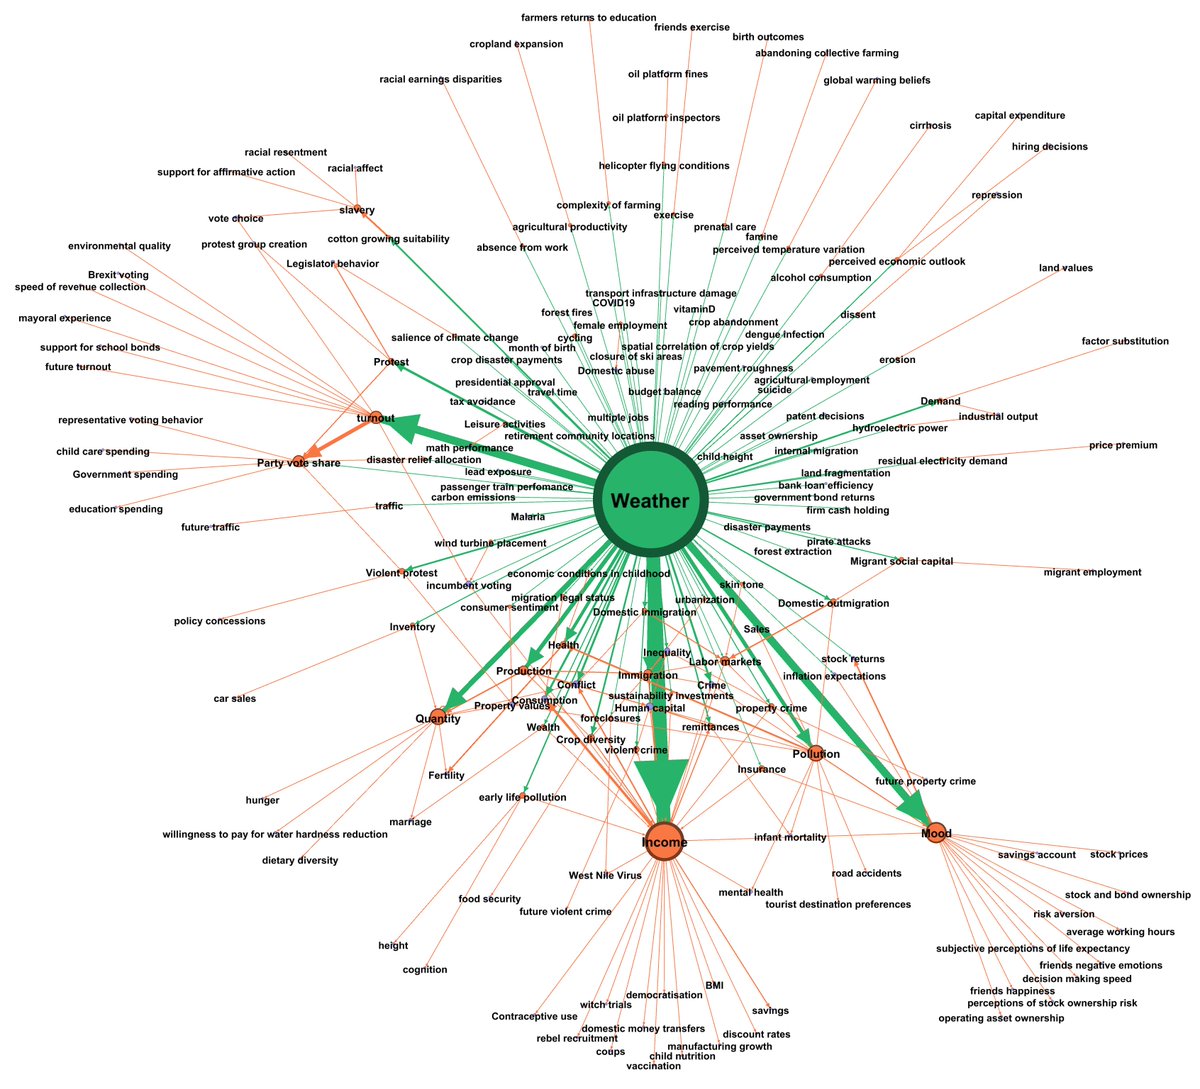
tldr: all IV weather papers represent potential exclusion restriction violations for all other IV weather papers. I find 1̵3̵7̵ 176 possible exclusion restriction violations
https://osf.io/preprints/socarxiv/9qj4f">https://osf.io/preprints...
tldr: all IV weather papers represent potential exclusion restriction violations for all other IV weather papers. I find 1̵3̵7̵ 176 possible exclusion restriction violations
https://osf.io/preprints/socarxiv/9qj4f">https://osf.io/preprints...
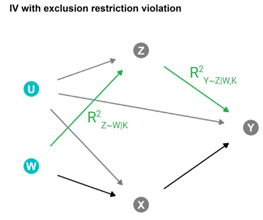
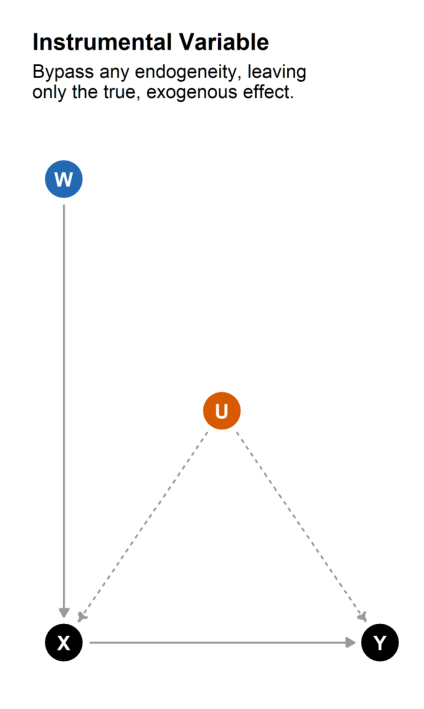
After releasing the last version some people said something along the lines of “OK, this is all technically wrong, but is it that bad in practice?” i.e. the amount of bias in practice is going to depend on how strong all those links in the diagram are
So in the latest version, I use sensitivity analysis ( @analisereal & @chadhazlett2020) to look at how strong the relationship between different exclusion restriction variables Z and the dependent variable Y would have to be in order to overturn each study’s result.
The amount of bias in IV estimate will depend on two values: partial R2 between instrument and confounder, and partial R2 between confounder and dependent variable:
I get the weather➞Z R2 estimates from the first-stage F-statistics of the weather IV studies themselves and then look at how big the R2_{Y~Z} would have to be in order to overturn a particular result.
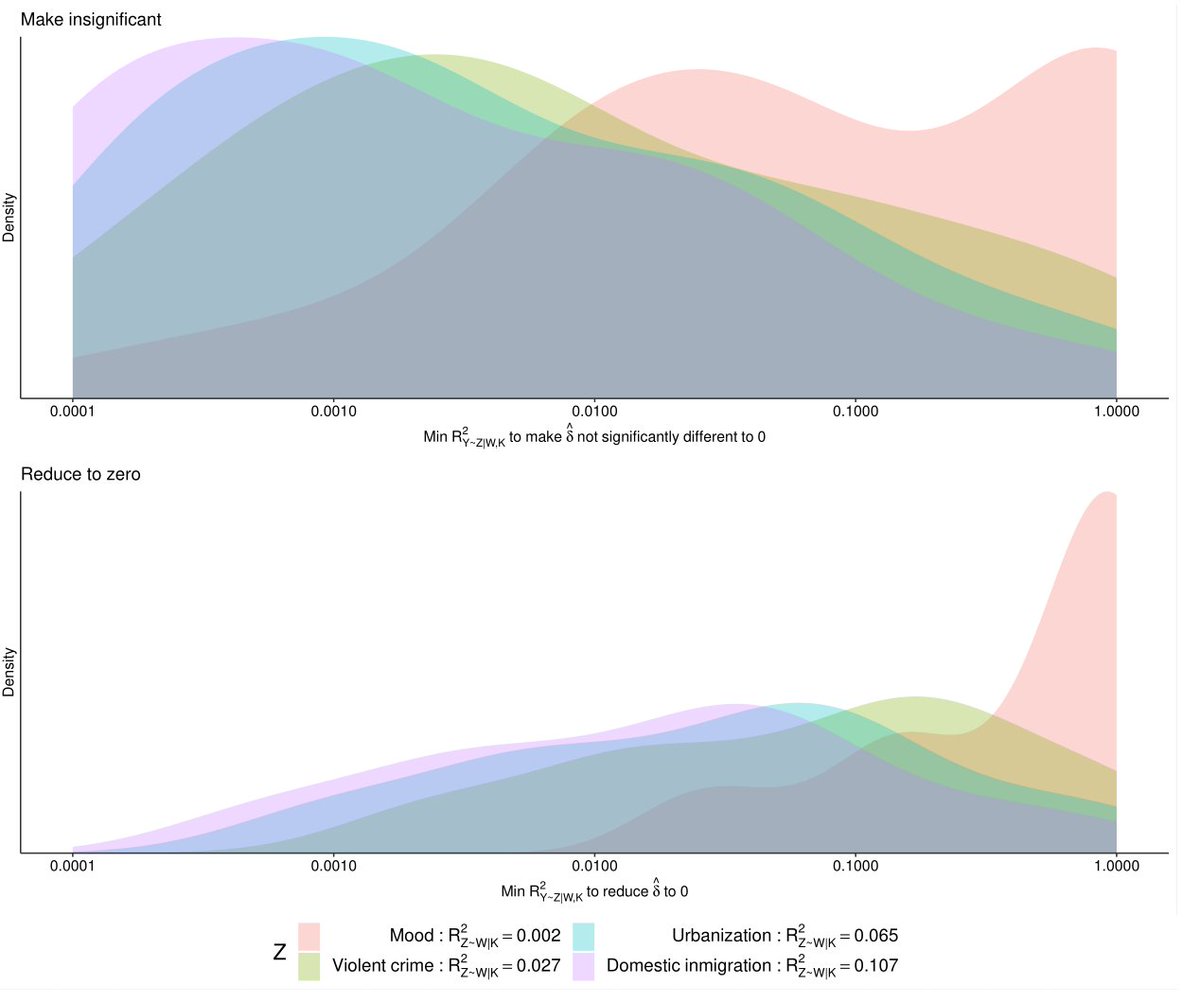
For strongest confounders (such as domestic migration) 26/44 studies could be made insignificant even if migration only explained 0.1% of the variance in the study’s dependent variable.
Here’s the distribution (note log10 scale) of how large the Y~Z relationship would have to be to overturn 44 weather IV estimates for four exclusion restriction violations documented in existing literature.
But some studies are more robust to exclusion violations. Stokes’ (2016) wind speed➞wind farms➞voting would need a confounder like crime to explain 11% of variance in accountability voting to make result insignificant. So I’m less worried exclusion violations drive the result
Summary:
1) lots of potential exclusion restriction violations for weather
2) those violations are strong enough to overturn many results
3) sensitivity analysis should be used systematically in IV analysis to examine how believable IV assumptions are for your models
1) lots of potential exclusion restriction violations for weather
2) those violations are strong enough to overturn many results
3) sensitivity analysis should be used systematically in IV analysis to examine how believable IV assumptions are for your models

 Read on Twitter


