UNDERSTANDING EVs BY LOOKING AT NORWAY
This is the Long Version for the Cognoscenti and folk who want to really understand and learn
Norway is the leading market in the world in terms of the current Transition to EVs
- and it also has relatively good and timely data sources
This is the Long Version for the Cognoscenti and folk who want to really understand and learn
Norway is the leading market in the world in terms of the current Transition to EVs
- and it also has relatively good and timely data sources
So what can we learn from Norway& #39;s EV experience that may be useful when looking at other markets ?
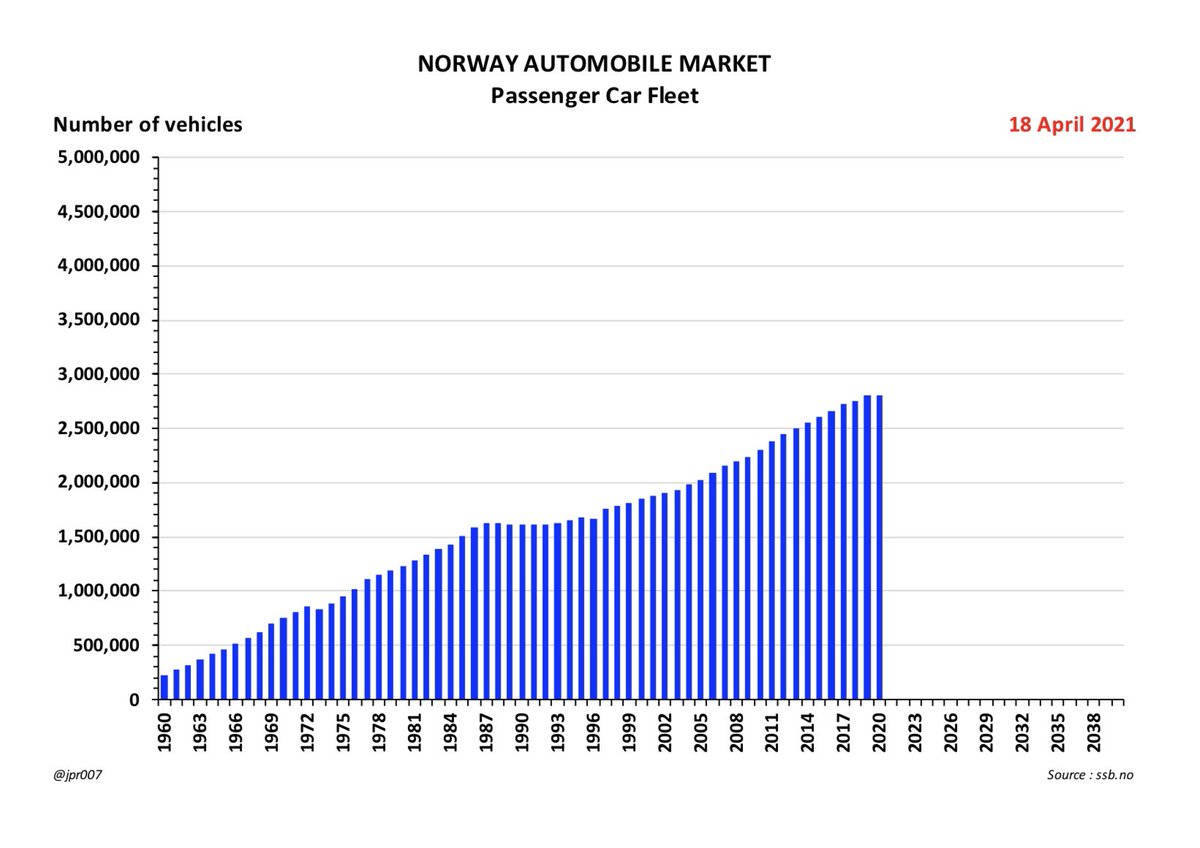
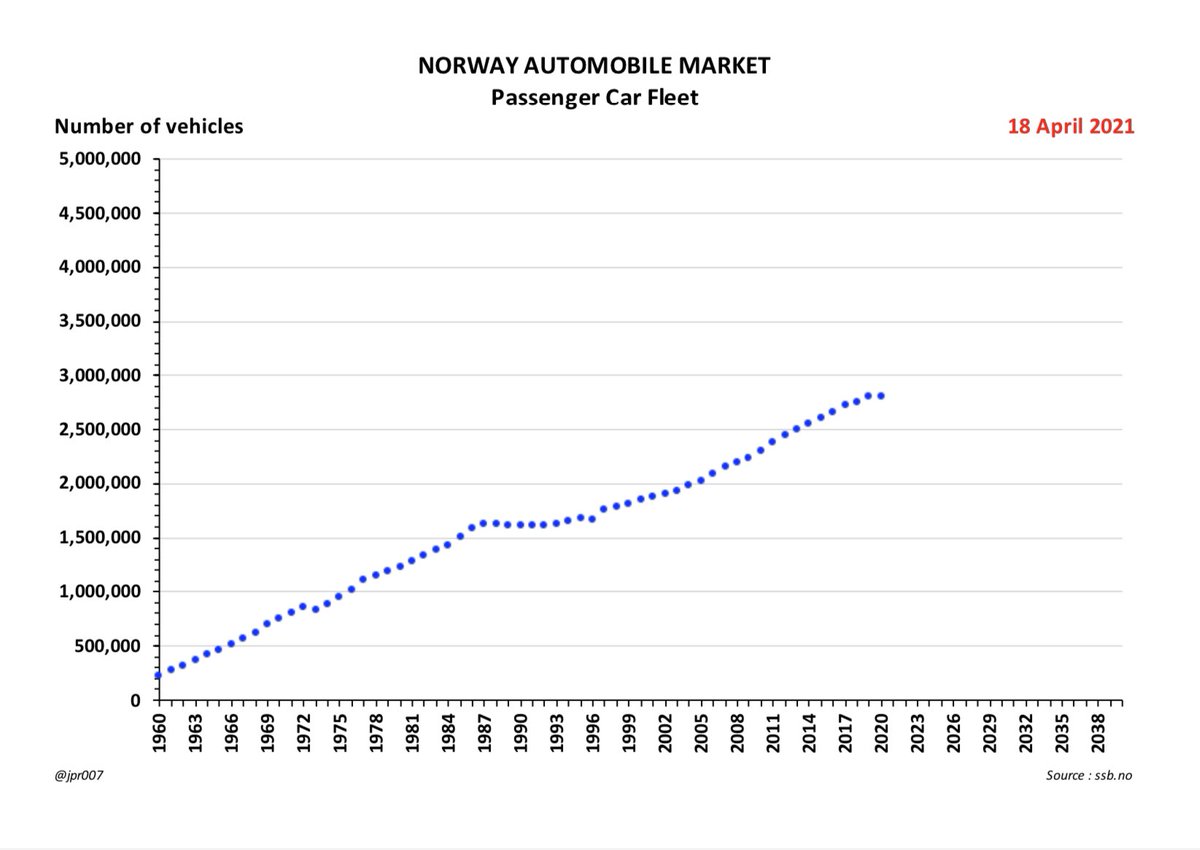
1. This chart shows the evolution of Norway& #39;s Passenger Car Fleet since 1960
1. This chart shows the evolution of Norway& #39;s Passenger Car Fleet since 1960
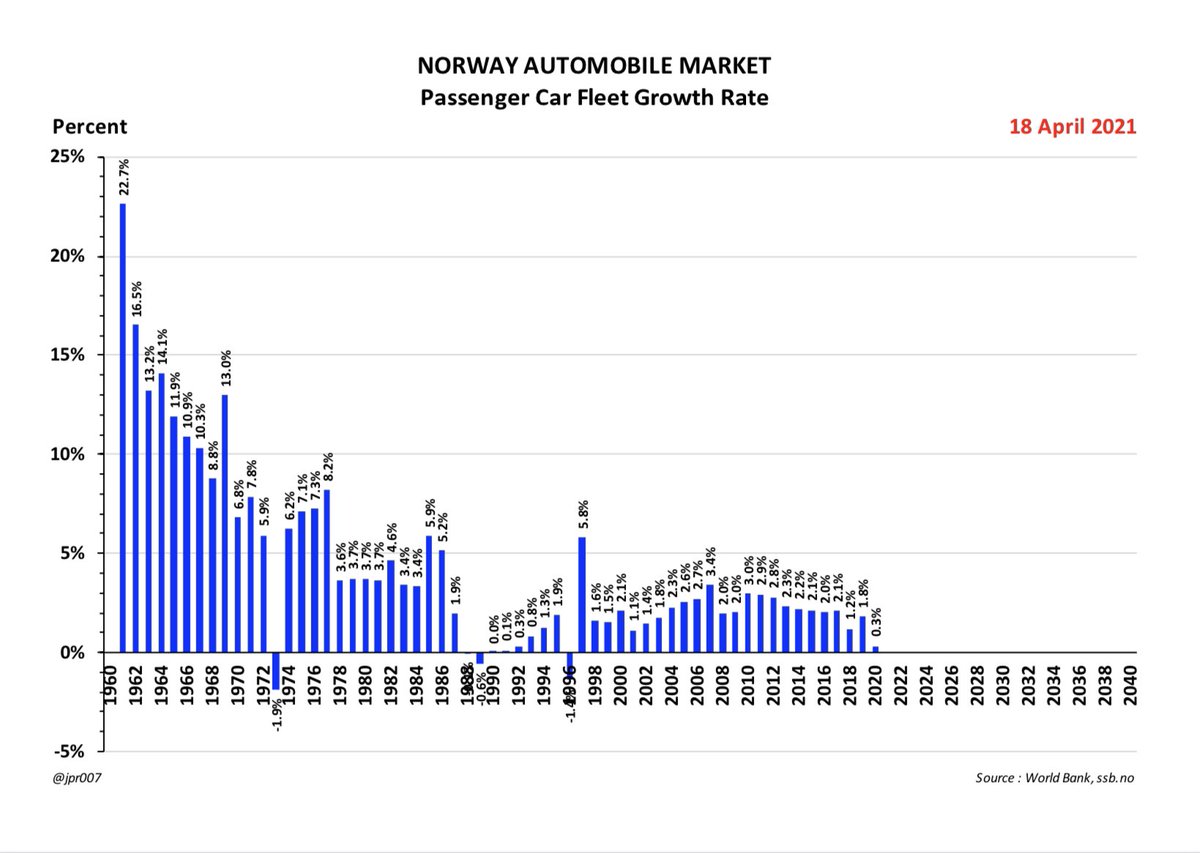
2. The expansion of the Fleet in the early days had some really high growth rates before settling down over time into low single digits, with occaisonal setbacks followed by recoveries of different shapes
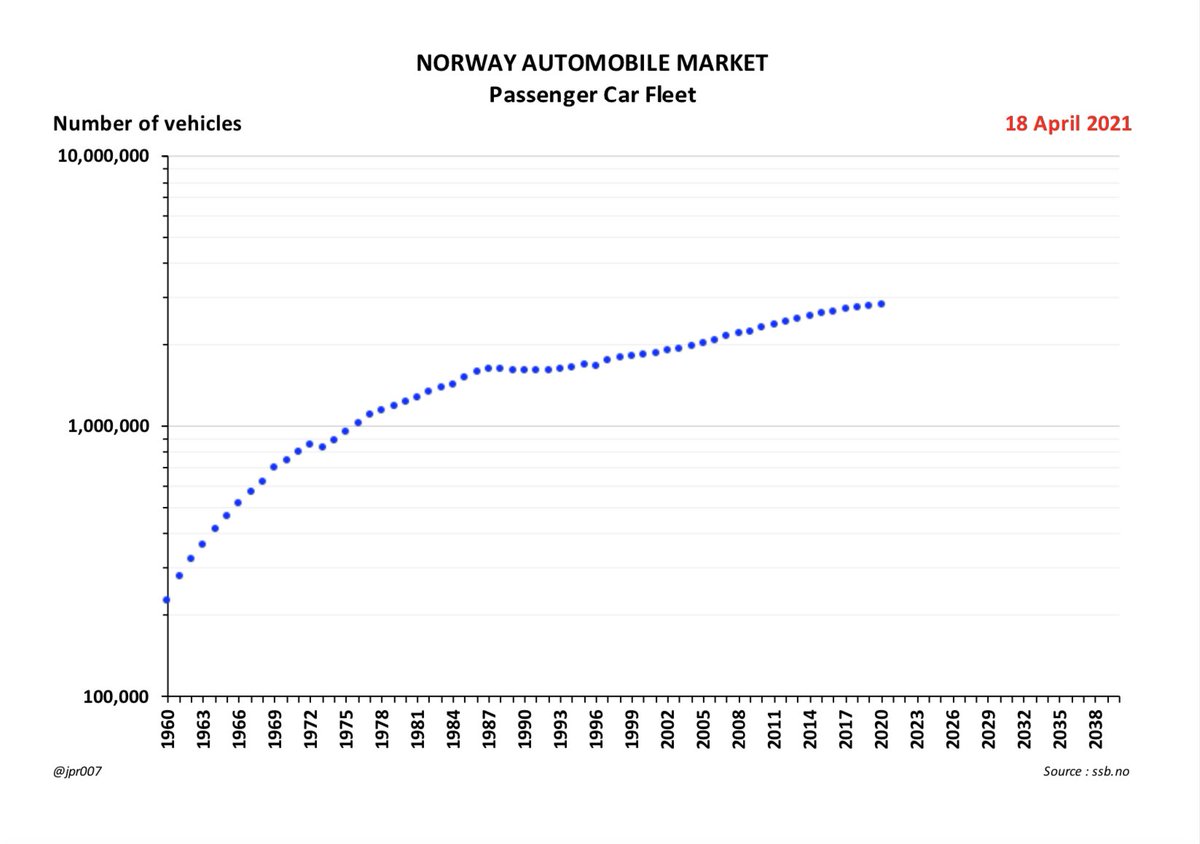
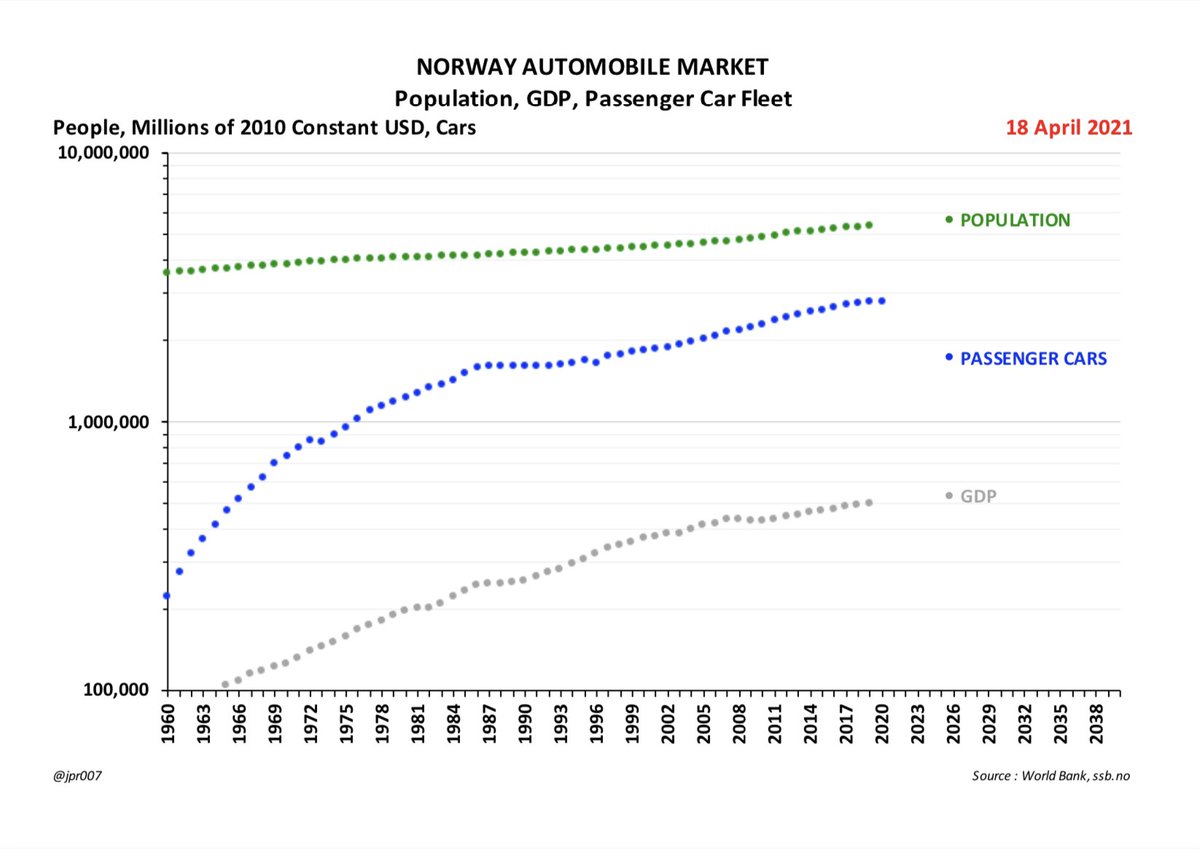
4. . . . and to switch our chart to logarithmic scale instead of linear to see the growth trends more clearly
5. This allows us to compare the growth in the Passenger Car Fleet size with the Population and Economic GDP of Norway as a country
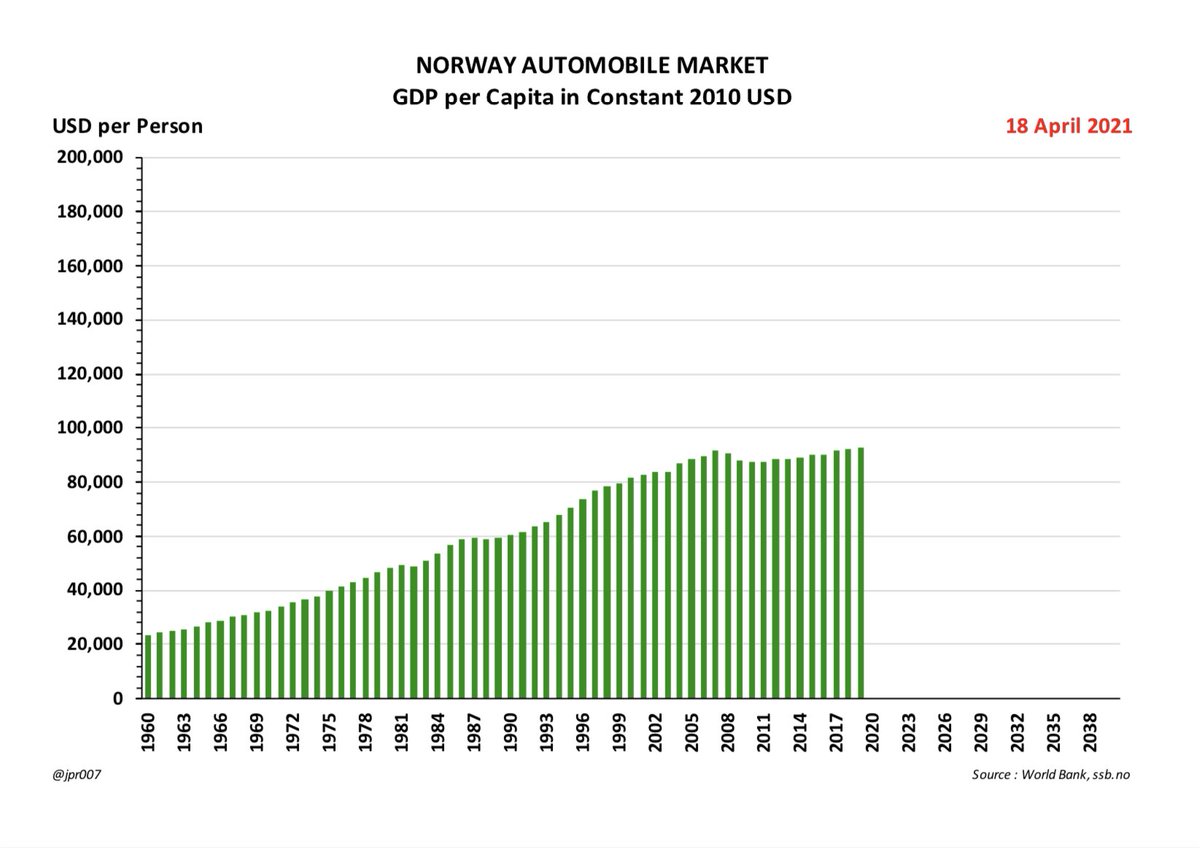
6. From this same data we can see Norway& #39;s progression over time to become a relatively wealthy country with GDP per capita in excess of $90,000 in Constant 2010 USD
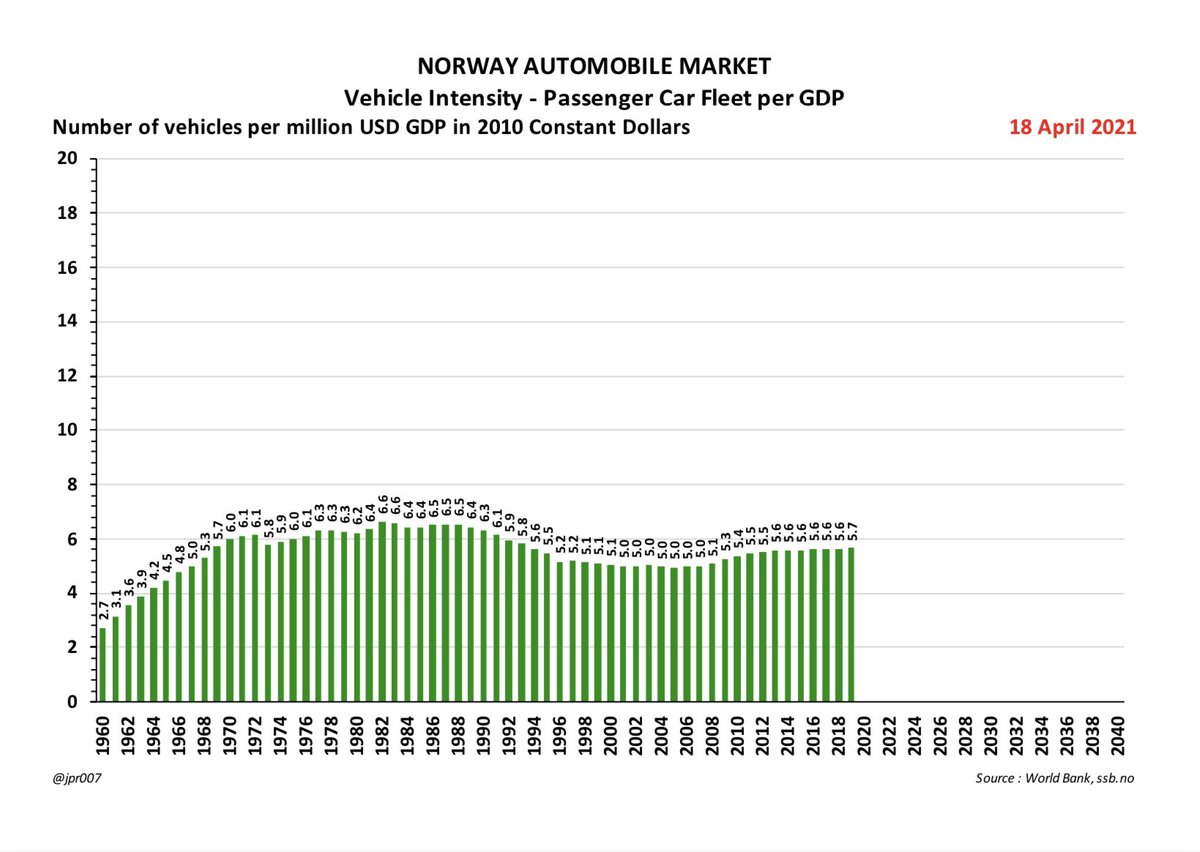
7. And we can see the changes in Vehicle Intensity in GDP as measured by number of Passenger Cars per million USD of GDP in Constant 2010 USD
This number has stabilized at around 6.5 Passenger Cars per million USD of GDP
This number has stabilized at around 6.5 Passenger Cars per million USD of GDP
8. From combining these observations we have selected the period from 2000 to 2017 as most representative of the modern era
- and this period shows a trend-line growth rate of +2.4% per annum CAGR for Norway& #39;s Passenger Car Fleet
- and this period shows a trend-line growth rate of +2.4% per annum CAGR for Norway& #39;s Passenger Car Fleet
9. We have refined this slightly to use a point-to-point growth rate of +2.3% per annum CAGR for the period from 2001 to 2017
- and anchored by the Fleet size as of 2012
This gives us the basis for our future Fleet size projection
- and anchored by the Fleet size as of 2012
This gives us the basis for our future Fleet size projection
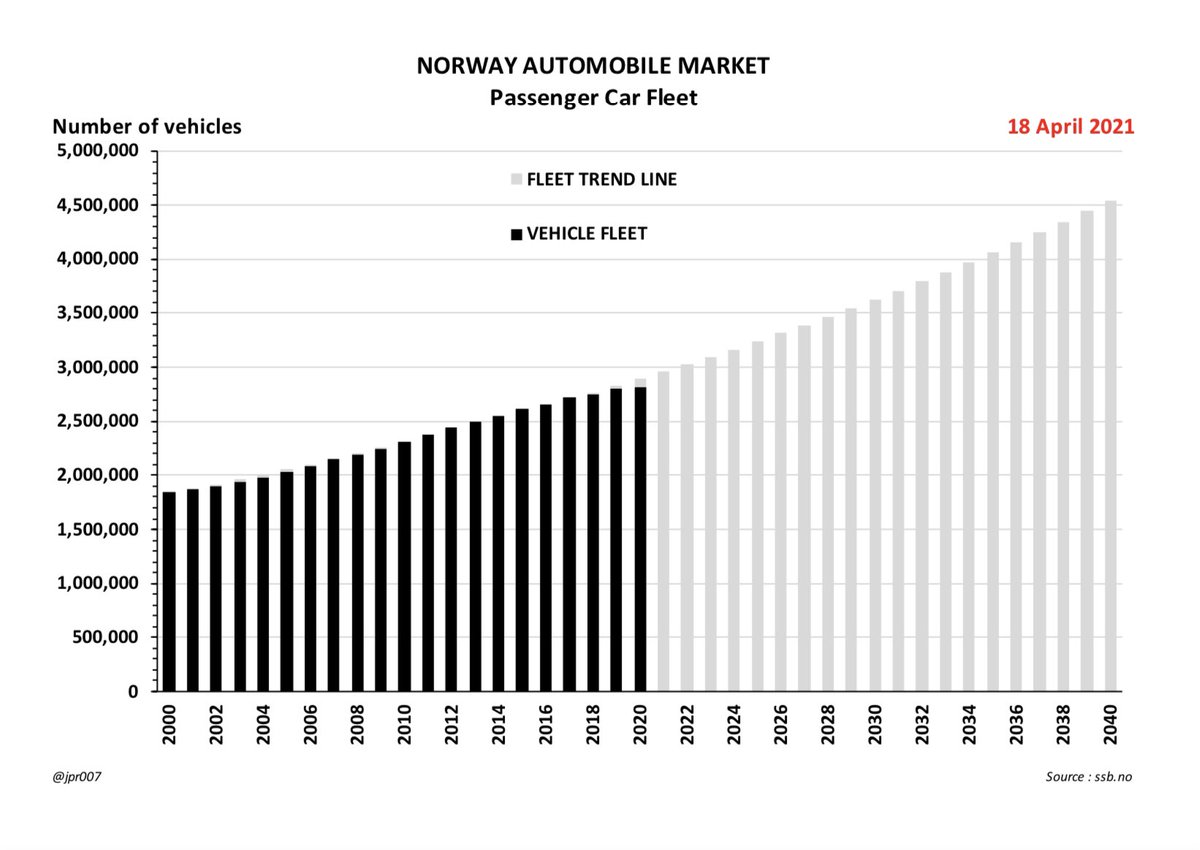
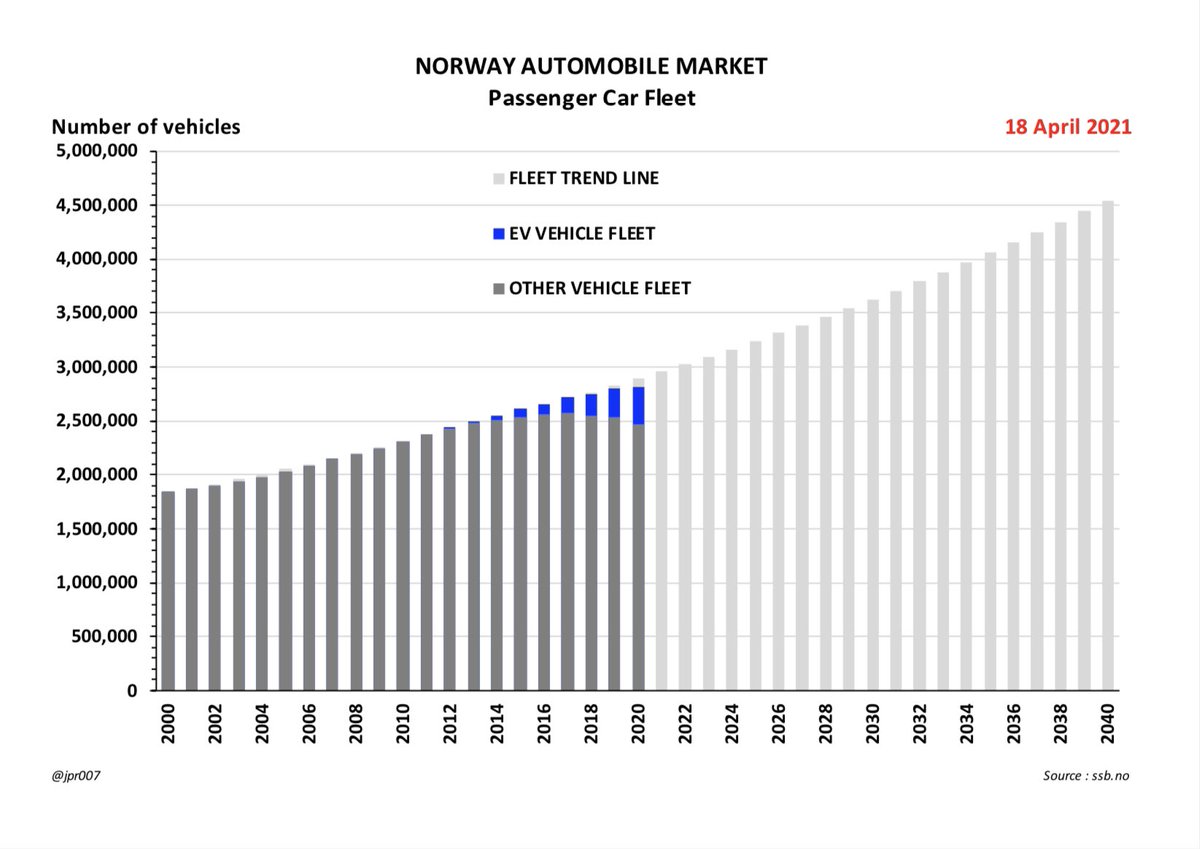
11. And here we have overlaid it on the calculated trend line growth
The fit is very close
This chart shows the data for all Passenger Cars regardless of fuel type
The fit is very close
This chart shows the data for all Passenger Cars regardless of fuel type
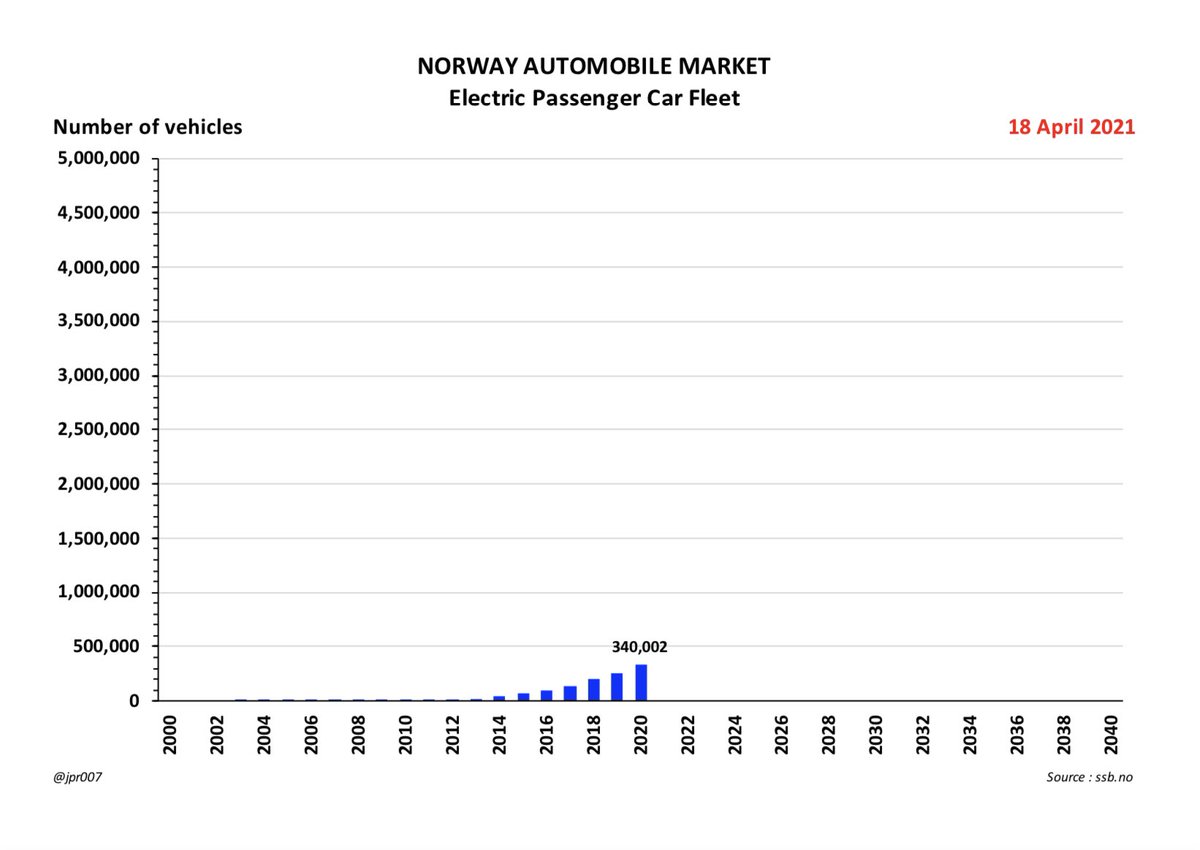
12. Electric Vehicles were introduced during this period and their scale has grown steadily to reach over 340,000 units as of 2020
13. So we can now see that EVs have already become a meaningful part of Norway& #39;s Passenger Car Fleet
- and the number of ICEVs in the Fleet has already started to decline in absolute numbers
2017 was the ICEV Peak
- and the number of ICEVs in the Fleet has already started to decline in absolute numbers
2017 was the ICEV Peak
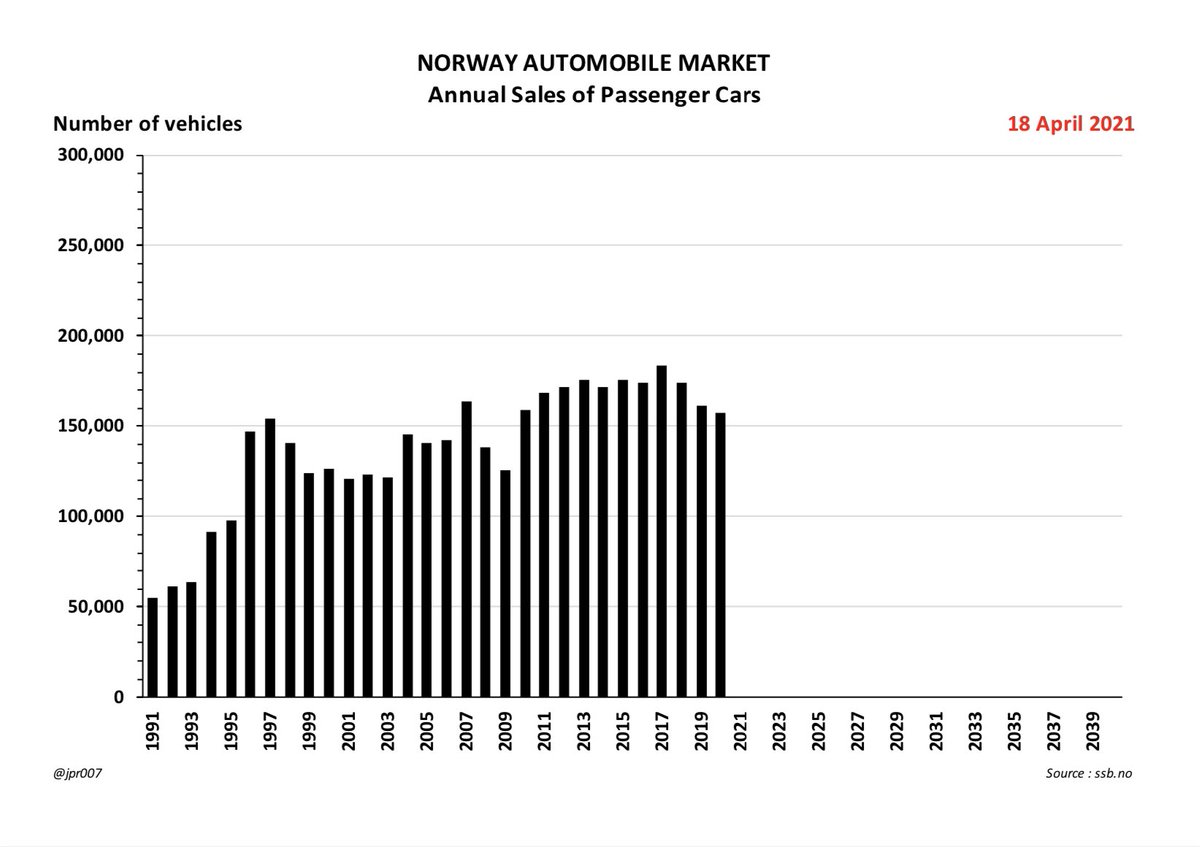
15. The key metric is to compare these Annual Sales with the overall size of the Passenger Car Fleet
- and we see that the Annual Sales rate is about 6.8% of the Fleet size
- and we see that the Annual Sales rate is about 6.8% of the Fleet size
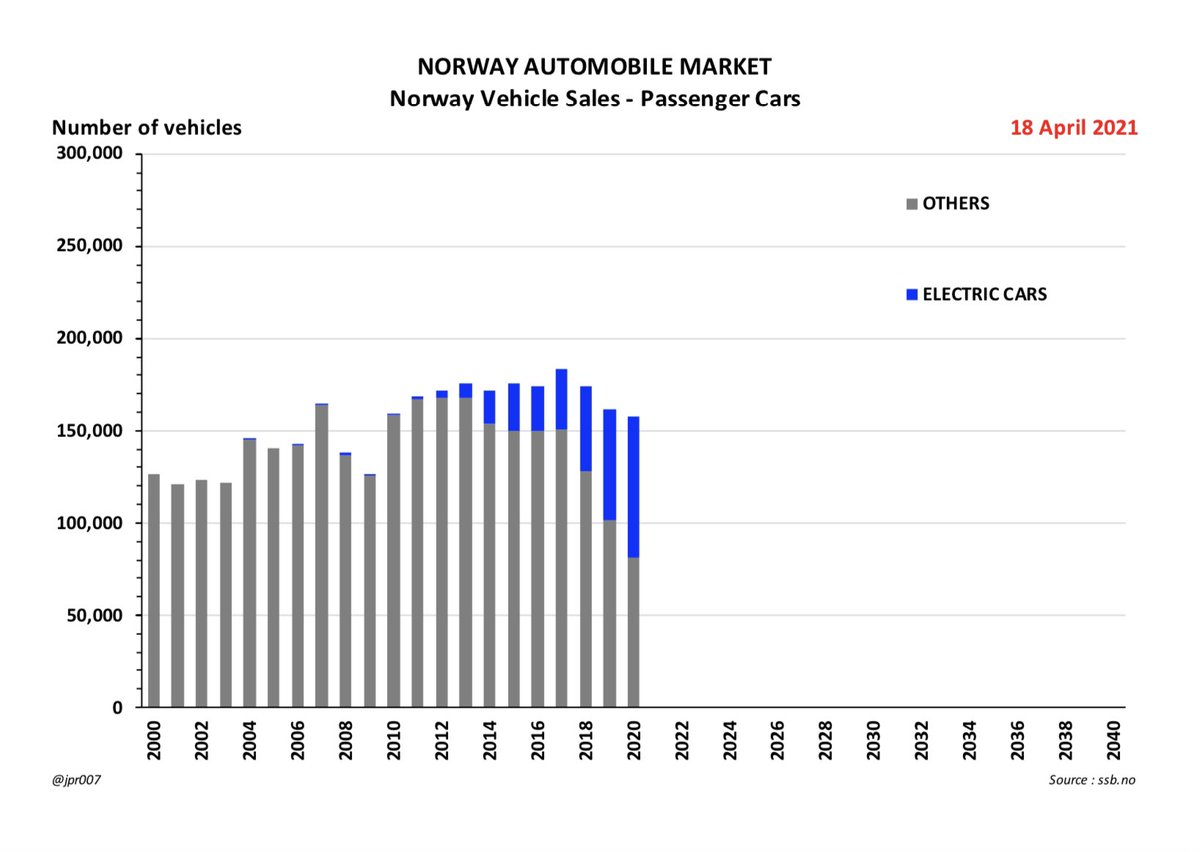
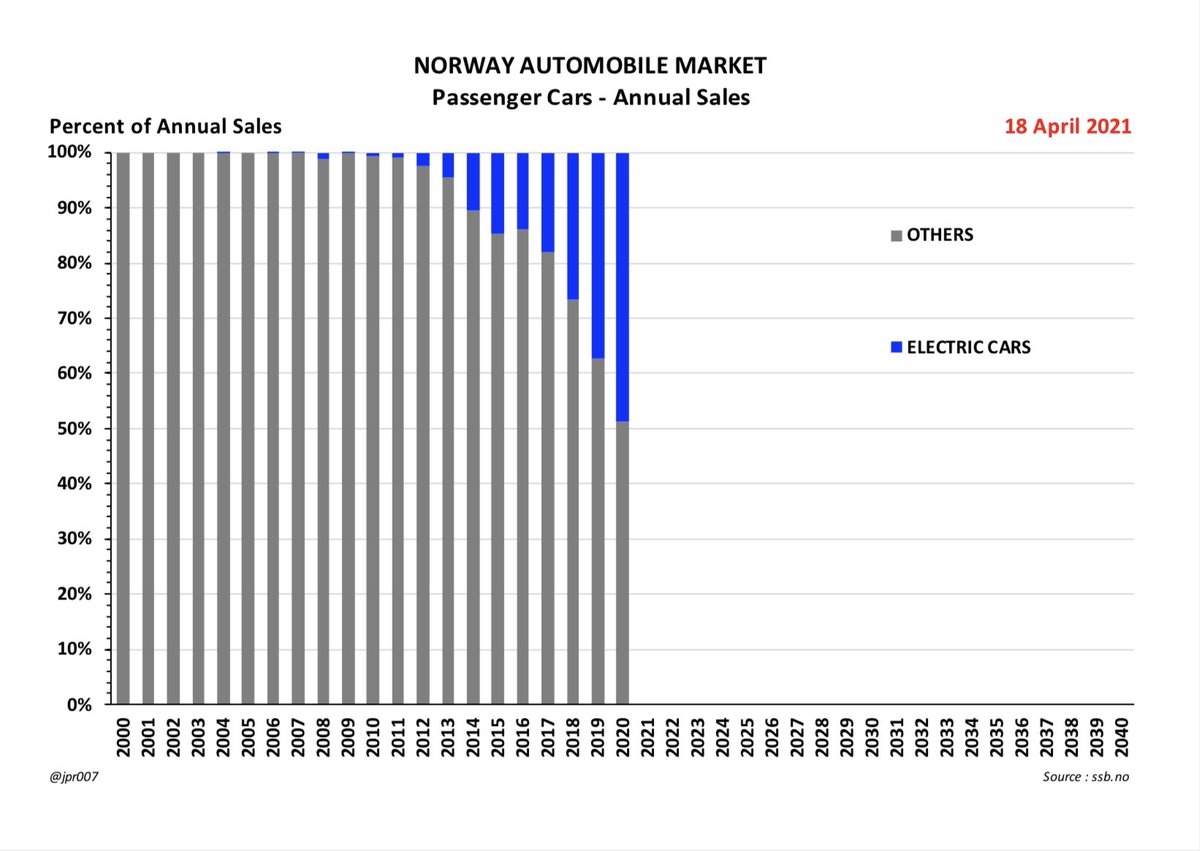
16. We can also see that Electric Car Sales have been becoming an increasingly important part of these Annual Sales
17. On the surface it looks like Electric Car Sales have now captured 48% of the national demand for Passenger Cars
- we shall come back to this later in the thread
- we shall come back to this later in the thread
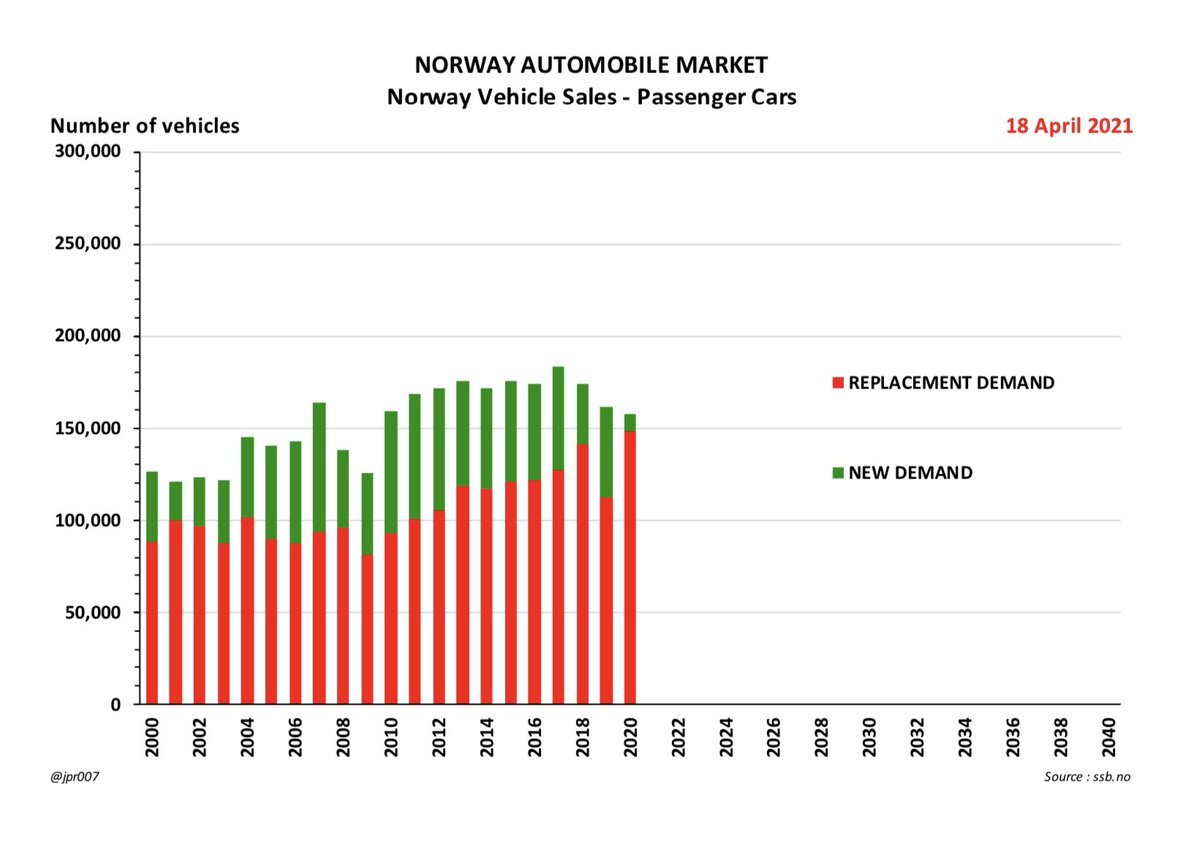
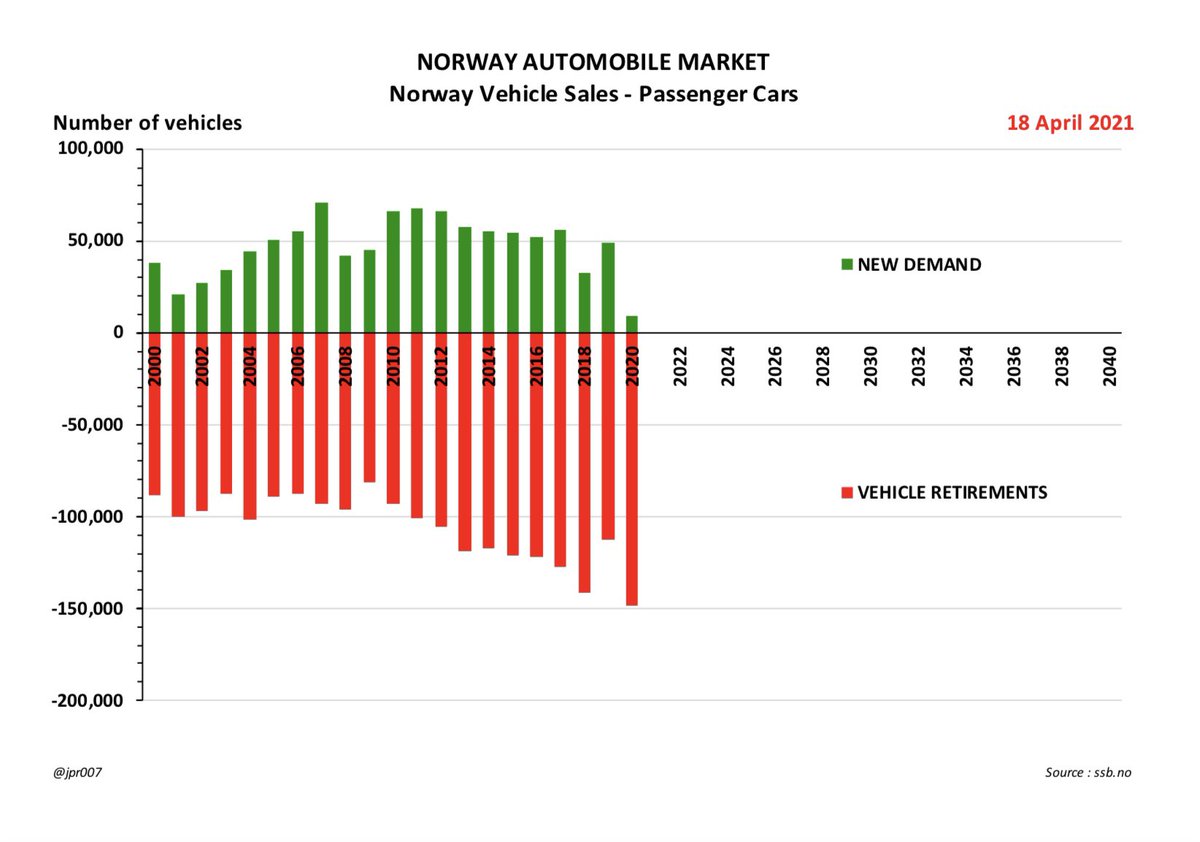
18. It is important to understand that these Annual Sales are providing vehicles to satisfy two quite different needs
- the FIRST NEED is to supply the vehicles that increase the size of the Passenger Car Fleet in line with its visible growth rate of +2.3%, shown here in Green
- the FIRST NEED is to supply the vehicles that increase the size of the Passenger Car Fleet in line with its visible growth rate of +2.3%, shown here in Green
19. We call that the New Demand
- the SECOND NEED is to replace the vehicles that are continuously being retired or taken out of the Fleet for whatever reason, normally old age
We call that the Replacement Demand and on average it represents 6.8% - 2.3% = 4.5% of the Fleet size
- the SECOND NEED is to replace the vehicles that are continuously being retired or taken out of the Fleet for whatever reason, normally old age
We call that the Replacement Demand and on average it represents 6.8% - 2.3% = 4.5% of the Fleet size
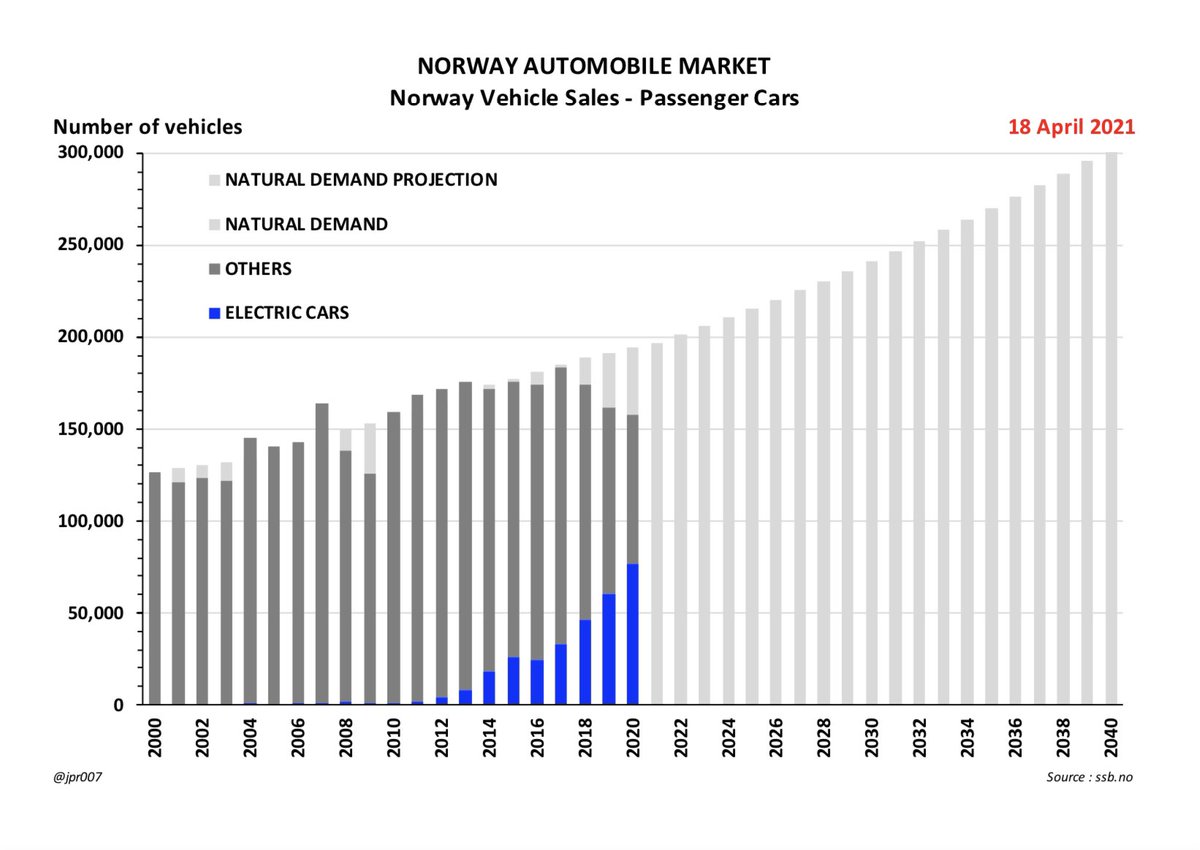
20. When combined together, this New Demand + Replacement Demand provide us with the Natural Demand for new Passenger Cars each year, and the rate is 6.8% of the Fleet size calculated from the prior year
- which we can use to make a Natural Demand projection into the future
- which we can use to make a Natural Demand projection into the future
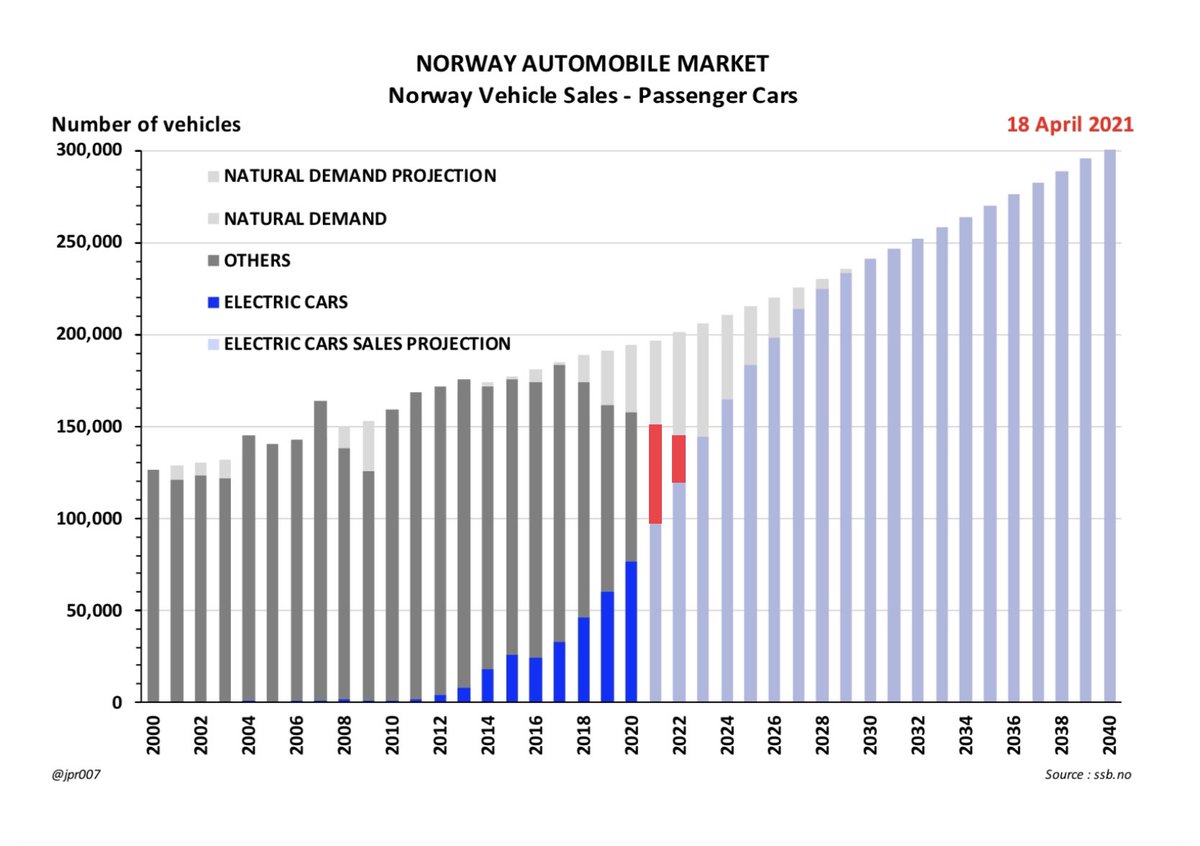
21. And we can take the current penetration rate of Electric Vehicles relative to the Natural Demand to estimate the future levels of sales penetration as shown here
22. This important chart now gives us many significant insights :
FIRST, the share of Natural Demand being met by EVs in 2020 was only 39.5% and the share being met by Other vehicles is only 41.6%
- with another 18.9% being Unmet Demand
There is a shortage of Supply of EVs
FIRST, the share of Natural Demand being met by EVs in 2020 was only 39.5% and the share being met by Other vehicles is only 41.6%
- with another 18.9% being Unmet Demand
There is a shortage of Supply of EVs
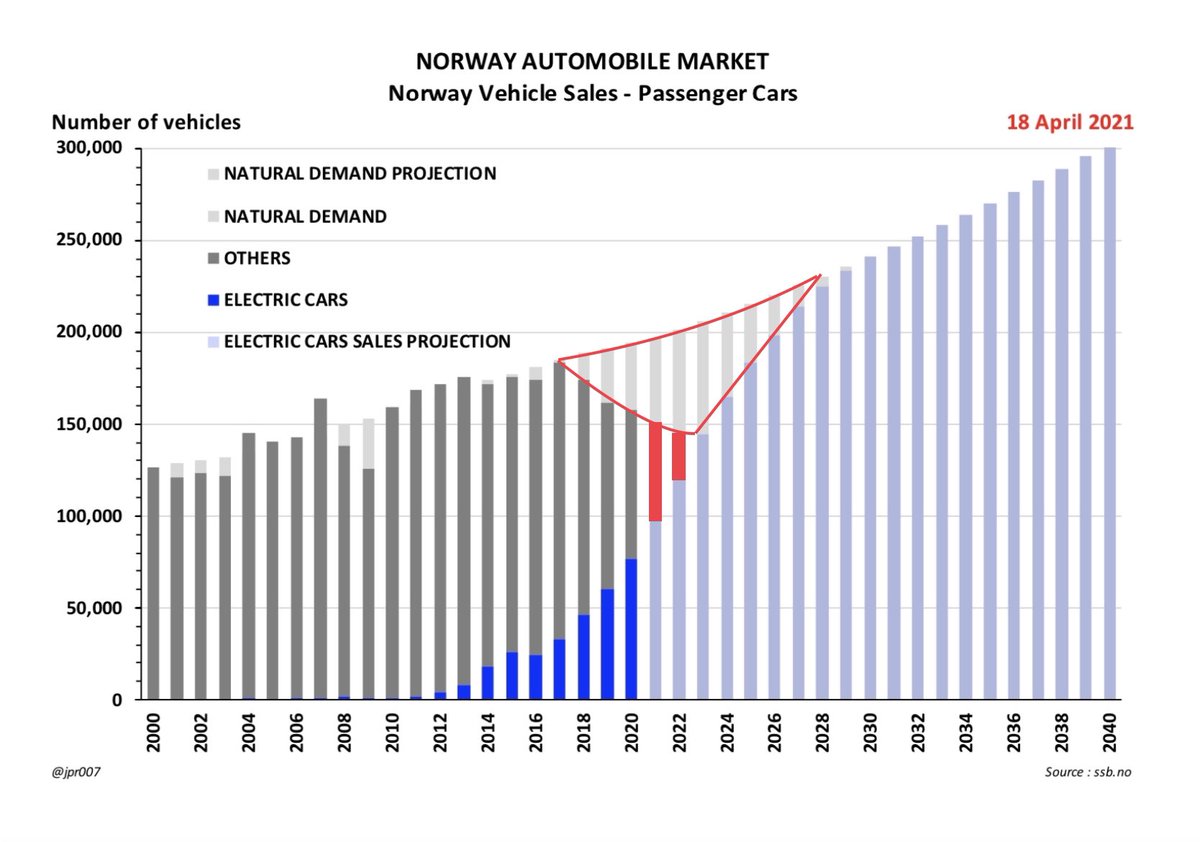
23. SECOND, we have to recognize that the appetite for ICEVs in Norway is rapidly disappearing and it may well effectively disappear altogether by 2024, as shown by the Red segments on this chart
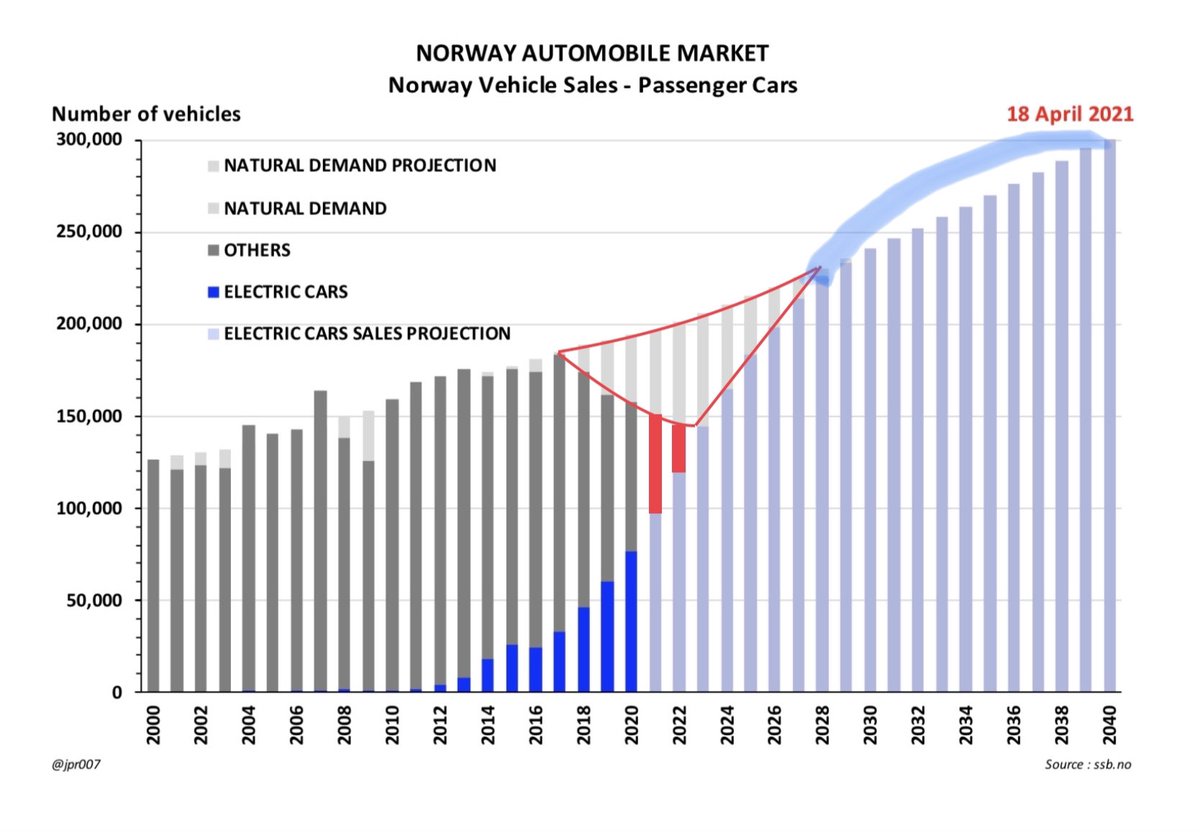
24. THIRD, Norway is already suffering from a Supply shortage of Electric Vehicles
- partly because of production constraints on existing vehicles
- and partly because some vehicle types and styles are just not available or not satisfied by current product offerings
- partly because of production constraints on existing vehicles
- and partly because some vehicle types and styles are just not available or not satisfied by current product offerings
25. FOURTH, this Supply shortage could build up to as much as 300,000 vehicles by 2028 when we expect the Supply and Natural Demand to come back into balance

 Read on Twitter