I just realised something, if I& #39;m reading this right the difference between the greens and NIP here in this sample isn& #39;t even as much as 1 person...`1/ https://twitter.com/TomNwainwright/status/1383010343551696897">https://twitter.com/TomNwainw...
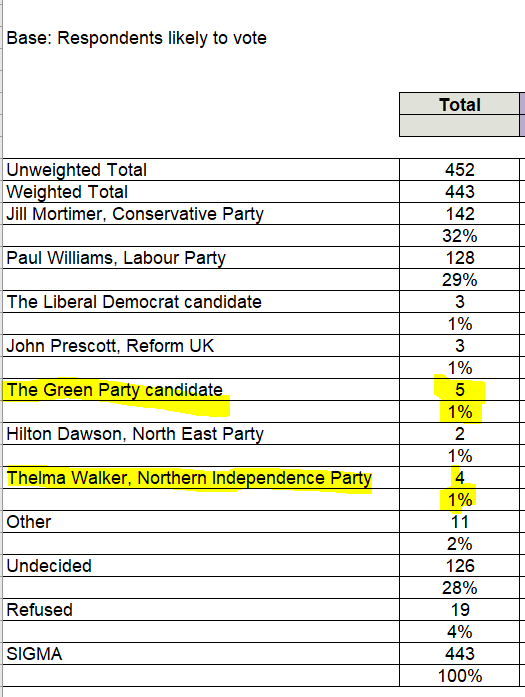
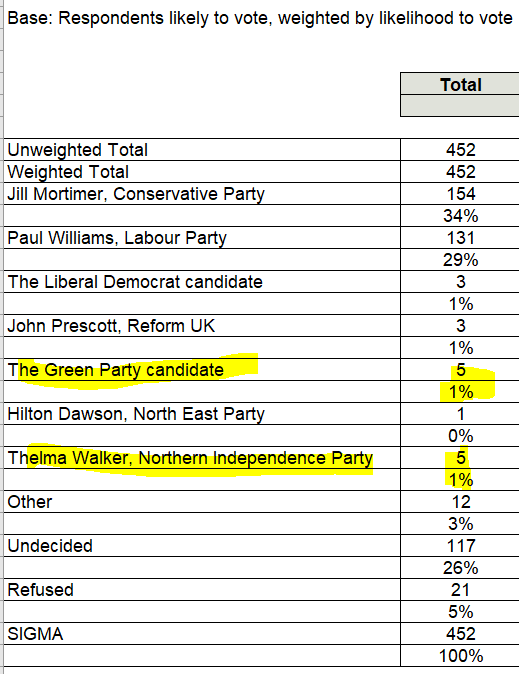
in fact greens got one more 1st image is unweighted table see greens get 5 & nip gets 4 (still meaningless noise numbers for either), 2nd image is weighted table where both are on 5 because of weighting for likelihood to vote, and that& #39;s fine! It& #39;s a common methodology but 2/
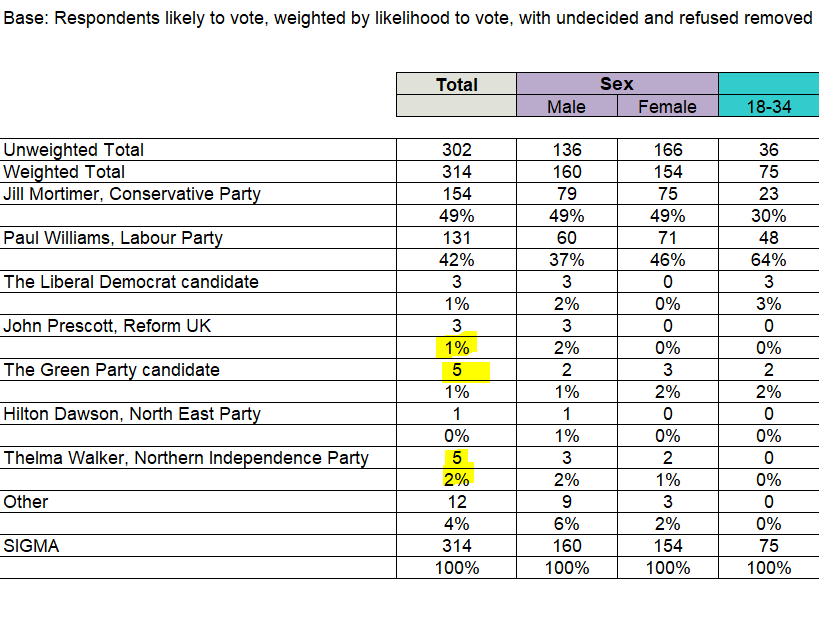
When we get to the final total weighted w/ undecideds/refuseds removed both still at 5 but Nip has jumped to 2% and green remains 1%. How can that be when they both had 5? Well, remember the 5 is a weighted number, it cld well be not an integer but
the table may have rounded3/
the table may have rounded3/
and the 2% is clearly a rounded number as none of the % show decimal places, so my guess is that NIPs weighted total is 5 point something (for example something like 5.4) while greens is also but slightly lower (say 5.2) 4/
5/and that this produces a % of slightly above 1.5% for NIP which is then rounded up to 2% and slightly lower than 1.5% for greens which is rounded down to 1%... so this shock poll? The difference is less than miniscule
6/ it was already clearly too small to read anything from but this kinda really brings home how fucking bad this analysis was from s4l
to be clear my problem isn& #39;t that the poll is weighted for voter likelihood, that& #39;s common c practice (though everyone has a different opinion on how best to do so) but it shows that the 1% difference is likely mostly a result of rounding
The margin of error on these polls is already way too big to read much from a 1% difference, but this just shows another reason not to read too much from small differences

 Read on Twitter


