https://abs.twimg.com/emoji/v2/... draggable="false" alt="📚" title="Bücher" aria-label="Emoji: Bücher"> Quick Trading Tips To Instantly Improve Your Game
This will be an indefinite series where I post quick tips on trading related subjects.
These tweets will consist of a quick explanation and chart whenever necessary.
Questions? Feel free to ask under the related tweet.

https://abs.twimg.com/emoji/v2/... draggable="false" alt="📚" title="Bücher" aria-label="Emoji: Bücher"> Quick Tip - 1
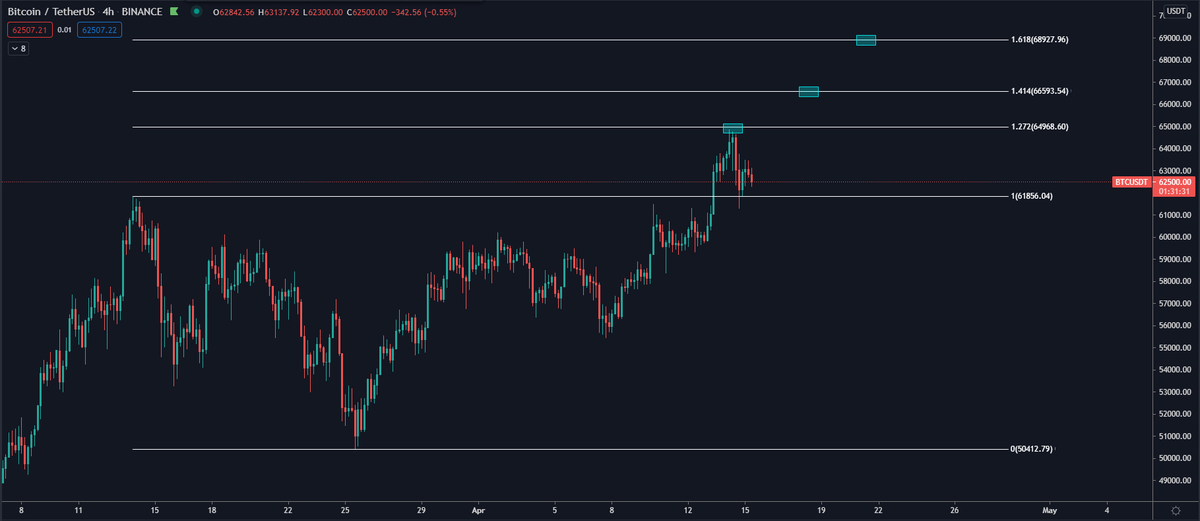
One of the easiest ways to determine targets, while in price discovery, is using Fibonacci extensions.
The chart below is a prime example of how you could use such extensions.
We can clearly see that the 1.272 level offered some resistance on BTC in this case.

https://abs.twimg.com/emoji/v2/... draggable="false" alt="📚" title="Bücher" aria-label="Emoji: Bücher"> Quick Tip - 3
Funding can help you determine which side is the crowded trade and whether a move is spot-driven or not.
Very often, when derivatives lead the market one way, they are bound to get squeezed.
Price

https://abs.twimg.com/emoji/v2/... draggable="false" alt="⬆️" title="Pfeil nach oben" aria-label="Emoji: Pfeil nach oben"> and Funding

https://abs.twimg.com/emoji/v2/... draggable="false" alt="⬇️" title="Pfeil nach unten" aria-label="Emoji: Pfeil nach unten"> = Bullish
Price

https://abs.twimg.com/emoji/v2/... draggable="false" alt="⬇️" title="Pfeil nach unten" aria-label="Emoji: Pfeil nach unten"> and Funding

https://abs.twimg.com/emoji/v2/... draggable="false" alt="⬆️" title="Pfeil nach oben" aria-label="Emoji: Pfeil nach oben"> = Bearish

https://abs.twimg.com/emoji/v2/... draggable="false" alt="📚" title="Bücher" aria-label="Emoji: Bücher"> Quick Tip - 4
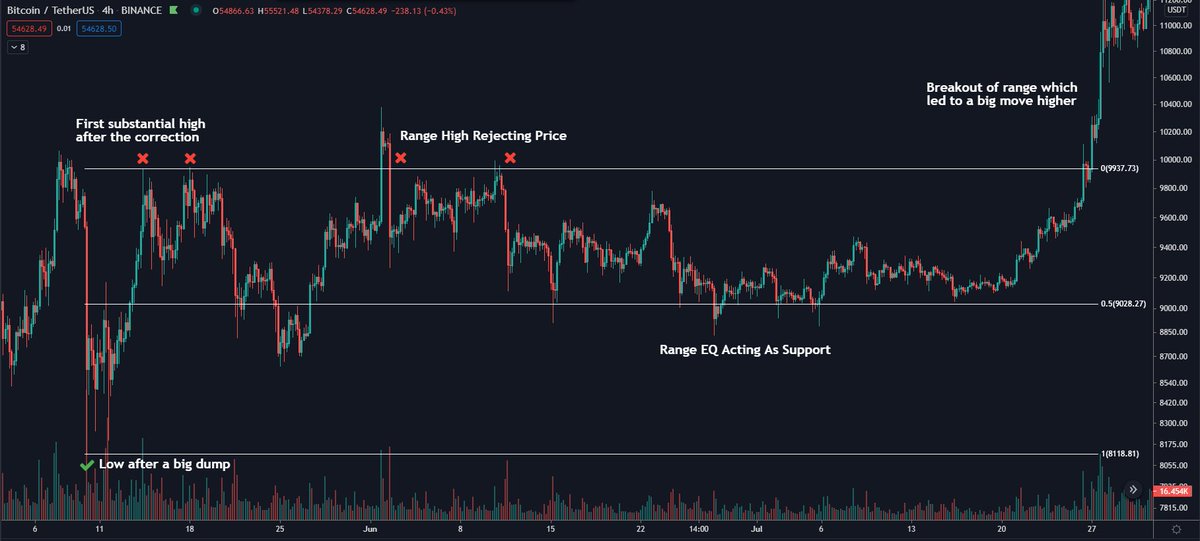
Bitcoin and other assets often trade in ranges.
Range Lows/Highs often act as Support/Resistance.
You can define ranges in several ways. What I like to do is: after a bigger correction, take the low and the high that follows which will create the range.

https://abs.twimg.com/emoji/v2/... draggable="false" alt="📚" title="Bücher" aria-label="Emoji: Bücher"> Quick Tip - 5
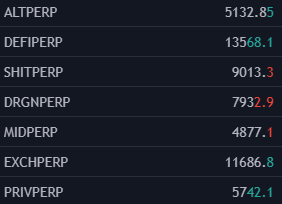
FTX, has "baskets" of different kind of coins, for example EXCHPERP which tracks a few different exchange tokens, which each have their own weight within the basket.
Charting these baskets can be good to see which type of coins are trending better than others.

https://abs.twimg.com/emoji/v2/... draggable="false" alt="📚" title="Bücher" aria-label="Emoji: Bücher"> Quick Tip - 6
Rules of Thumb for Supports and Resistances (S/R).

https://abs.twimg.com/emoji/v2/... draggable="false" alt="🔹" title="Kleine blaue Raute" aria-label="Emoji: Kleine blaue Raute">The higher the timeframe, the stronger a S/R is.

https://abs.twimg.com/emoji/v2/... draggable="false" alt="🔹" title="Kleine blaue Raute" aria-label="Emoji: Kleine blaue Raute">The more touches a S/R has, the more important it becomes.

https://abs.twimg.com/emoji/v2/... draggable="false" alt="🔹" title="Kleine blaue Raute" aria-label="Emoji: Kleine blaue Raute">If a S/R gets tested a lot in quick succession, it gets weaker.

 Read on Twitter
 Quick Tip - 1One of the easiest ways to determine targets, while in price discovery, is using Fibonacci extensions.The chart below is a prime example of how you could use such extensions.We can clearly see that the 1.272 level offered some resistance on BTC in this case." title="https://abs.twimg.com/emoji/v2/... draggable="false" alt="📚" title="Bücher" aria-label="Emoji: Bücher"> Quick Tip - 1One of the easiest ways to determine targets, while in price discovery, is using Fibonacci extensions.The chart below is a prime example of how you could use such extensions.We can clearly see that the 1.272 level offered some resistance on BTC in this case." class="img-responsive" style="max-width:100%;"/>
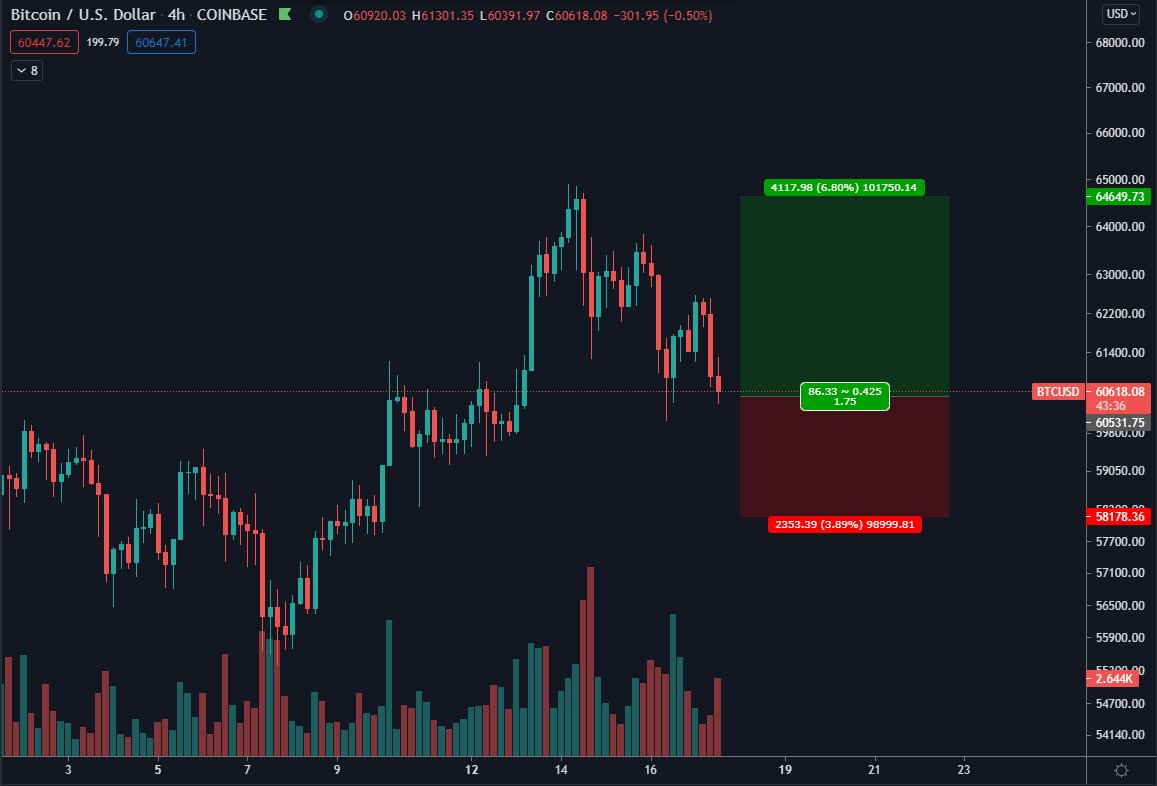
 Quick Tip - 2To know what position size you should be taking, try using the Long/Short Position tools on Tradingview.Set your account size and risk percentage. Then determine your entry, stop and target.The tool will show you your R:R and recommended position size." title="https://abs.twimg.com/emoji/v2/... draggable="false" alt="📚" title="Bücher" aria-label="Emoji: Bücher"> Quick Tip - 2To know what position size you should be taking, try using the Long/Short Position tools on Tradingview.Set your account size and risk percentage. Then determine your entry, stop and target.The tool will show you your R:R and recommended position size.">
 Quick Tip - 2To know what position size you should be taking, try using the Long/Short Position tools on Tradingview.Set your account size and risk percentage. Then determine your entry, stop and target.The tool will show you your R:R and recommended position size." title="https://abs.twimg.com/emoji/v2/... draggable="false" alt="📚" title="Bücher" aria-label="Emoji: Bücher"> Quick Tip - 2To know what position size you should be taking, try using the Long/Short Position tools on Tradingview.Set your account size and risk percentage. Then determine your entry, stop and target.The tool will show you your R:R and recommended position size.">
 Quick Tip - 4Bitcoin and other assets often trade in ranges.Range Lows/Highs often act as Support/Resistance.You can define ranges in several ways. What I like to do is: after a bigger correction, take the low and the high that follows which will create the range." title="https://abs.twimg.com/emoji/v2/... draggable="false" alt="📚" title="Bücher" aria-label="Emoji: Bücher"> Quick Tip - 4Bitcoin and other assets often trade in ranges.Range Lows/Highs often act as Support/Resistance.You can define ranges in several ways. What I like to do is: after a bigger correction, take the low and the high that follows which will create the range." class="img-responsive" style="max-width:100%;"/>
 Quick Tip - 5FTX, has "baskets" of different kind of coins, for example EXCHPERP which tracks a few different exchange tokens, which each have their own weight within the basket.Charting these baskets can be good to see which type of coins are trending better than others." title="https://abs.twimg.com/emoji/v2/... draggable="false" alt="📚" title="Bücher" aria-label="Emoji: Bücher"> Quick Tip - 5FTX, has "baskets" of different kind of coins, for example EXCHPERP which tracks a few different exchange tokens, which each have their own weight within the basket.Charting these baskets can be good to see which type of coins are trending better than others." class="img-responsive" style="max-width:100%;"/>


