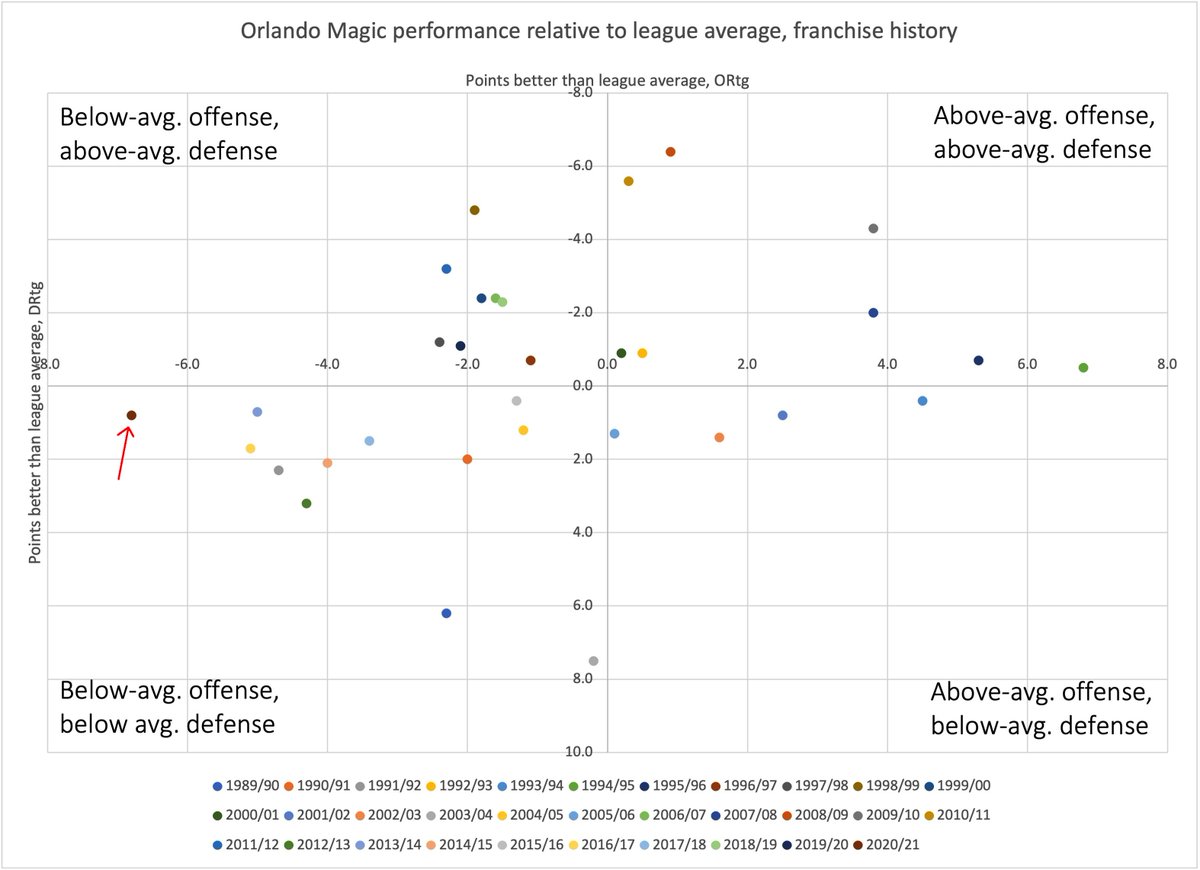
By a mile, this year& #39;s Magic offense is the worst in team history (-6.8 points/100 possessions worse than league average). The gap between this year& #39;s Magic& #39;s offense and the team& #39;s second-worst offense (1.7 points/100) is as big as the gap between second and seventh.
regarding this afternoon& #39;s team-account tweet about the it having its "highest" DRtg ever, that& #39;s true, but relative to league average, this group has been pretty much OK on defense: just 0.8 points/100 worse, which is the 12th-worst mark in team history.
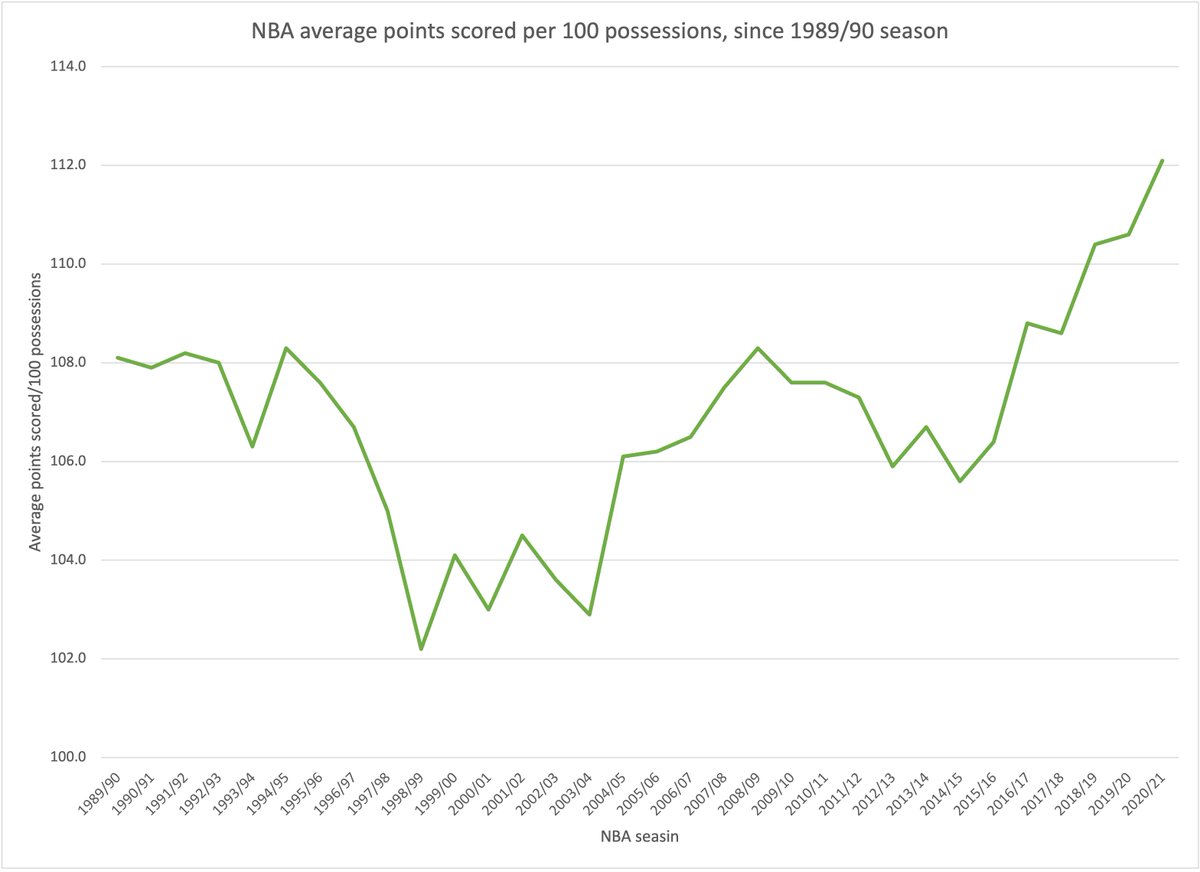
by far the worst defensive team in Magic history was the 2003/04 squad--the final Tracy McGrady year/first Steve Francis year--which was 7.5 points/100 worse than league average. That group allowed 110.4 points/100 when league average was 102.9
the lesson is not to use raw efficiency ratings, but instead to compare them to league average.
anyway, here& #39;s every Magic team ever. I drew a janky red arrow pointing to this season. Again: worst offense by a mile, but despite high raw DRtg, it& #39;s actually mediocre relative to league average and franchise history.
another way to look at it is this year& #39;s Magic team is as bad offensively as the franchise& #39;s first Finals team was good offensively. Margin of 6.8 points/100 relative to league average is identical, just in different directions, obviously
there& #39;s a broader discussion to be had about how the game has changed over time, one I& #39;ll let much more intelligent people get into if they want. But here& #39;s how the league& #39;s average offensive rating has changed since the Magic& #39;s inaugural season.
(all data in this thread via @bball_ref)

 Read on Twitter


