
 Read on Twitter
1/36 #BITCOIN  https://abs.twimg.com/hashflags... draggable="false" alt=""> TO 100K?200K?300K TARGET SIR?
In this monthly update I try to show you where we stand in the current cycle, mostly based on sentiment, IMHO ofcourse.
I hope you guys think it’s valuable, tell me below!
TLDR at 36-38
Let’s go!
Original: https://twitter.com/Phoenix_Ash3s/status/1314224523357687809">https://twitter.com/Phoenix_A...
 TO 100K?200K?300K TARGET SIR?In this monthly update I try to show you where we stand in the current cycle, mostly based on sentiment, IMHO ofcourse.I hope you guys think it’s valuable, tell me below! TLDR at 36-38Let’s go!Original: https://twitter.com/Phoenix_A..." title="1/36 #BITCOIN https://abs.twimg.com/hashflags... draggable="false" alt=""> TO 100K?200K?300K TARGET SIR?In this monthly update I try to show you where we stand in the current cycle, mostly based on sentiment, IMHO ofcourse.I hope you guys think it’s valuable, tell me below! TLDR at 36-38Let’s go!Original: https://twitter.com/Phoenix_A..." class="img-responsive" style="max-width:100%;"/>
2/ Checking sentiment is sometimes just a gut feeling, but there is a whole lot out here to guide you through the swamp that’s called #CT.
Fear, greed, thrill, euphoria, disbelief. We’ve got it all inside, anyone who says he doesn’t is a robot.
But, if you can act like a salmon
Fear, greed, thrill, euphoria, disbelief. We’ve got it all inside, anyone who says he doesn’t is a robot.
But, if you can act like a salmon
floating up stream, you can come out as a winner.
We all know the saying that 90%+ of the market participants lose money and that’s all reflected in the price of a certain asset.
Feel extreme fear at the bottom, extreme greed at the top? You lose, market wins.
We all know the saying that 90%+ of the market participants lose money and that’s all reflected in the price of a certain asset.
Feel extreme fear at the bottom, extreme greed at the top? You lose, market wins.
4/ So how to become part of the 10% that actually makes money, long term?
First, let’s throw away the most bullshit ‘indicator’, yet almost used the most, in the garbage bin.
The “Fear and Greed index”.
It’s total utter trash.

First, let’s throw away the most bullshit ‘indicator’, yet almost used the most, in the garbage bin.
The “Fear and Greed index”.
It’s total utter trash.
5/ Why, you ask?
6 nov: $Btc price: 15K. Whole lot on #CT telling you they’re hedged here. I saw a lot of “Fear and Greed tweets. You?: Sell
64 days in the greed later:
9 jan: $Btc price 40K.
No more words needed, but again: Utter Trash

6 nov: $Btc price: 15K. Whole lot on #CT telling you they’re hedged here. I saw a lot of “Fear and Greed tweets. You?: Sell
64 days in the greed later:
9 jan: $Btc price 40K.
No more words needed, but again: Utter Trash
6/ Let’s take a look at the good stuff.
Some of the indicators are discussed if useful on Twatter and I get it. But, looking at them will create a general sense of the market.
i.e. with this I “called” 10-40K move, but also the 40-sub 30K correction with these threads.
Some of the indicators are discussed if useful on Twatter and I get it. But, looking at them will create a general sense of the market.
i.e. with this I “called” 10-40K move, but also the 40-sub 30K correction with these threads.
7/ 2 Year MA Multiplier
This indicator uses the 2Y MA & MA x5
2ya MA multiplier is rising fast and at ~76k rn. Still screams mid ’17 PA to me, like in the last update many models did.
Heatening up, but room for growth. Good part: We will overshoot it in euphoria phase.

This indicator uses the 2Y MA & MA x5
2ya MA multiplier is rising fast and at ~76k rn. Still screams mid ’17 PA to me, like in the last update many models did.
Heatening up, but room for growth. Good part: We will overshoot it in euphoria phase.
8/ Relative Unrealized Profit/Loss
Paper p/l in $Btc.
Market is overheating, everybody is in paper profits, we are greedy f*cks, but as the saying goes: Markets can stay irrational longer than you can stay solvent, so many more months from now on, if history rhymes again.

Paper p/l in $Btc.
Market is overheating, everybody is in paper profits, we are greedy f*cks, but as the saying goes: Markets can stay irrational longer than you can stay solvent, so many more months from now on, if history rhymes again.
9/ 200 Week MA Heatmap
The last blue dot reflected $Btc crossing All Time High, just like it did in the previous circle
After crossing Ath, the parabolic advance really starts. We should be looking at 8/9 months before reaching greed territory. Currently 4 in. Party ain’t over!

The last blue dot reflected $Btc crossing All Time High, just like it did in the previous circle
After crossing Ath, the parabolic advance really starts. We should be looking at 8/9 months before reaching greed territory. Currently 4 in. Party ain’t over!
10/ MVRV Z-score. To identify periods when $Btc is extremely under/overvalued.
Green= MV unusually far below RV, buying opp
Red=MV unusually high above RV, TP opp.
Now: Cooled off & nowhere close to pure greed yet.
Nice uptick in realized value.

Green= MV unusually far below RV, buying opp
Red=MV unusually high above RV, TP opp.
Now: Cooled off & nowhere close to pure greed yet.
Nice uptick in realized value.
11/ Puell Multiple
To track value of #Bitcoins being mined and entering the ecosystem.
Green: Value of Bitcoins being issued is extremely low. Buy here
Red: The opposite. Sell here
It’s high, but not in extreme territory just yet.

To track value of #Bitcoins being mined and entering the ecosystem.
Green: Value of Bitcoins being issued is extremely low. Buy here
Red: The opposite. Sell here
It’s high, but not in extreme territory just yet.
12/ Stock to flow model
Hated & Loved on #CT
Simply put: $Btc is scarce, limited supply. More demand, less flow (halvening): Number goes up.
We’re absolutely hugging it for months now. We will overshoot 100K if you ask me.
: Number goes up.We’re absolutely hugging it for months now. We will overshoot 100K if you ask me.")
Hated & Loved on #CT
Simply put: $Btc is scarce, limited supply. More demand, less flow (halvening): Number goes up.
We’re absolutely hugging it for months now. We will overshoot 100K if you ask me.
13/ 1Y+ Hodl Wave
#Bitcoins that haven’t moved for more than 1 year. If $Btc goes parabolic, 1Y+ decreases, because there is profit taking. Notice how 1Y+ Hodl went down whole 2017
It should be going down for some more months and that’s gucci.

#Bitcoins that haven’t moved for more than 1 year. If $Btc goes parabolic, 1Y+ decreases, because there is profit taking. Notice how 1Y+ Hodl went down whole 2017
It should be going down for some more months and that’s gucci.
14/ Pi cycle top indicator
BOOM!!: Instantly all over your feed. It called a top yesterday. $Btc doesn’t give a fuck and shoots to new highs today.
First indicator “calling” a top here while all others don’t. Market doesn’t feel overheated. No top, shut up.

BOOM!!: Instantly all over your feed. It called a top yesterday. $Btc doesn’t give a fuck and shoots to new highs today.
First indicator “calling” a top here while all others don’t. Market doesn’t feel overheated. No top, shut up.
15/ Bitcoin profitable days
100%. We are all-in profits, yeeeehhh.
Oh, that’s also quite scary.
And this is only spot, ofcourse. Not talking about leveraged apes blowing away entire accounts…..

100%. We are all-in profits, yeeeehhh.
Oh, that’s also quite scary.
And this is only spot, ofcourse. Not talking about leveraged apes blowing away entire accounts…..
16/ Reserve Risk
Confidence high? Price low? R/R to invest is attractive: green zone.
Buy green, sell red. Plenty of room left. Simple shit.

Confidence high? Price low? R/R to invest is attractive: green zone.
Buy green, sell red. Plenty of room left. Simple shit.
17/ Bitcoin logarithmic growth curves
% of price growth decreases, but bottoms and tops will be higher. Narrowing. No cycle top before $100K?
Highly possible imho (I said that below 10k too, quiet, anon)
")
% of price growth decreases, but bottoms and tops will be higher. Narrowing. No cycle top before $100K?
Highly possible imho (I said that below 10k too, quiet, anon)
18/ Google trends
Pleb attention has started. Look at the media. After we crossed ath, it was suddenly everywhere. Yet, media has turned silent again.
I think they will truly start talking about #Bitcoinhttps://abs.twimg.com/hashflags... draggable="false" alt=""> at the magical 100K mark. Should make sense. Then the fun part starts…
Pleb attention has started. Look at the media. After we crossed ath, it was suddenly everywhere. Yet, media has turned silent again.
I think they will truly start talking about #Bitcoin
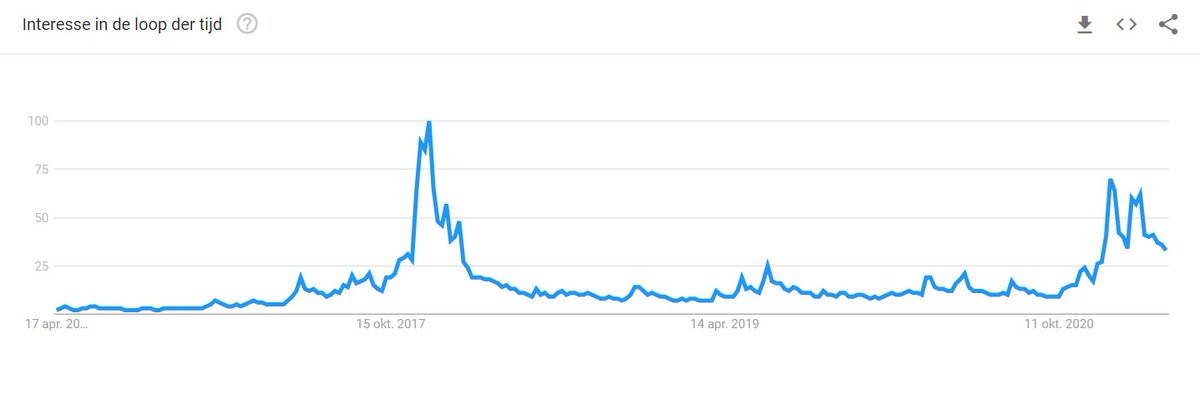 at the magical 100K mark. Should make sense. Then the fun part starts…" title="18/ Google trendsPleb attention has started. Look at the media. After we crossed ath, it was suddenly everywhere. Yet, media has turned silent again.I think they will truly start talking about #Bitcoin https://abs.twimg.com/hashflags... draggable="false" alt=""> at the magical 100K mark. Should make sense. Then the fun part starts…" class="img-responsive" style="max-width:100%;"/>
19/ Active Adress Sentiment Indicator
Nice if you want to check short term sentiment. Well, we are completely neutral right now, while sentiment was very overheated 2 months ago, at the same levels.
#Bullish

Nice if you want to check short term sentiment. Well, we are completely neutral right now, while sentiment was very overheated 2 months ago, at the same levels.
#Bullish
20/ RHODL Ratio
Realized HODL Ratio
I’m keeping it simple here. Take profits in Red zone.

Realized HODL Ratio
I’m keeping it simple here. Take profits in Red zone.
21/ Difficulty Ribbon
To view miner capitulation, signals times when buying is sensible.
When network difficulty reduces rate of climb: weak miners leave, strong miners survive: less sell pressure.
Best time to buy is where the Ribbon compresses.

To view miner capitulation, signals times when buying is sensible.
When network difficulty reduces rate of climb: weak miners leave, strong miners survive: less sell pressure.
Best time to buy is where the Ribbon compresses.
22/ (1/2) Bitcoin RVT Ratio (Realised Value to Transaction Ratio)
It compares transaction volume to the relevant valuation.
RVT Ratio uses Realised market cap. That is a Bitcoin value model representing average cost basis of the entire market, also discounting lost coins.
It compares transaction volume to the relevant valuation.
RVT Ratio uses Realised market cap. That is a Bitcoin value model representing average cost basis of the entire market, also discounting lost coins.
23/ (2/2) Bitcoin RVT Ratio
RVT high/increasing: Price overvalued
RVT low/decreasing: Price undervalued
RVT sideways: sustainable valuation, relative to transaction volume.
We just had a nice correction, ratio back at july ’19 levels. Room for growth.
 Bitcoin RVT RatioRVT high/increasing: Price overvaluedRVT low/decreasing: Price undervaluedRVT sideways: sustainable valuation, relative to transaction volume.We just had a nice correction, ratio back at july ’19 levels. Room for growth.")
RVT high/increasing: Price overvalued
RVT low/decreasing: Price undervalued
RVT sideways: sustainable valuation, relative to transaction volume.
We just had a nice correction, ratio back at july ’19 levels. Room for growth.
24/ Mayer multiple
A measurement to see if btc is under/overvalued, HTF, plotted against it’s 200 D ma.
The Bitcoin market as a whole becomes larger, thus less volatile, so the peaks on this indicator are becoming less high.
Now: We had a nice correction, room for growth again.

A measurement to see if btc is under/overvalued, HTF, plotted against it’s 200 D ma.
The Bitcoin market as a whole becomes larger, thus less volatile, so the peaks on this indicator are becoming less high.
Now: We had a nice correction, room for growth again.
25/ Bitcoin Vwap
Vwap combines power of volume with price action. Usefull to confirm a trend or to time entry/exit points.
To determine the average price market participants payed fort heir coins. It’s also a kind of a trend flow.

Vwap combines power of volume with price action. Usefull to confirm a trend or to time entry/exit points.
To determine the average price market participants payed fort heir coins. It’s also a kind of a trend flow.
26/ Halvings
Almost a year ago since the last halving. Remember the “sell the news effect” at 10K? Yeah? I hope you just didn’t sell.
Low amount of fresh coins entering the market, yet demand is growing and growing.
Almost a year ago since the last halving. Remember the “sell the news effect” at 10K? Yeah? I hope you just didn’t sell.
Low amount of fresh coins entering the market, yet demand is growing and growing.
27/ Hash rate
Measuremet of the computing power of the Btc network.
The higher the hash rate, the more miners active, the more secure the network. Dips have been absorved fast and we are at an ATH. Extremely Bullish

Measuremet of the computing power of the Btc network.
The higher the hash rate, the more miners active, the more secure the network. Dips have been absorved fast and we are at an ATH. Extremely Bullish
28/ Tether Marketcap
BRRRRRRRRRRRRRRRRRRRRR, in a good way
I heard a rumor that Tethers get printed only if the demand is there. Well, it’s clearly herehttps://abs.twimg.com/emoji/v2/... draggable="false" alt="😊" title="Lächelndes Gesicht mit lächelnden Augen" aria-label="Emoji: Lächelndes Gesicht mit lächelnden Augen">. SNED IT!
BRRRRRRRRRRRRRRRRRRRRR, in a good way
I heard a rumor that Tethers get printed only if the demand is there. Well, it’s clearly here
 . SNED IT!" title="28/ Tether MarketcapBRRRRRRRRRRRRRRRRRRRRR, in a good wayI heard a rumor that Tethers get printed only if the demand is there. Well, it’s clearly here https://abs.twimg.com/emoji/v2/... draggable="false" alt="😊" title="Lächelndes Gesicht mit lächelnden Augen" aria-label="Emoji: Lächelndes Gesicht mit lächelnden Augen">. SNED IT!" class="img-responsive" style="max-width:100%;"/>
29/ BTC All Exchanges Reserve
It’s running dry, folks. Over and over again. Know who you capitulate to, because Mr Whale is still taking your coins.
Bullish, if you didn’t read that

It’s running dry, folks. Over and over again. Know who you capitulate to, because Mr Whale is still taking your coins.
Bullish, if you didn’t read that
30/ BTC All Exchanges netflow.
A few days ago, we had a gigantic negative netflow.
Combine it with the previous chart to get the point.

A few days ago, we had a gigantic negative netflow.
Combine it with the previous chart to get the point.
31/ SOPR
Spent output profit ratio. I mentioned the signal it gave late february at ~44K and told you to buy the dip, while your paid grup leader was shorting support.
Who did you listen to? Next time it flashes, you buy the dip, if you aren’t overexposed tho.

Spent output profit ratio. I mentioned the signal it gave late february at ~44K and told you to buy the dip, while your paid grup leader was shorting support.
Who did you listen to? Next time it flashes, you buy the dip, if you aren’t overexposed tho.
32/ Long term estimated view
Question yourself. Do you want to short an asset that looks like this or do have you been accumulating dips?
Oh no! It’s overbought! Bitcoin stayed overbought on the M for a whole year prev cycles.
Betting against #Bitcoinhttps://abs.twimg.com/hashflags... draggable="false" alt=""> is like the Harakiri
Question yourself. Do you want to short an asset that looks like this or do have you been accumulating dips?
Oh no! It’s overbought! Bitcoin stayed overbought on the M for a whole year prev cycles.
Betting against #Bitcoin
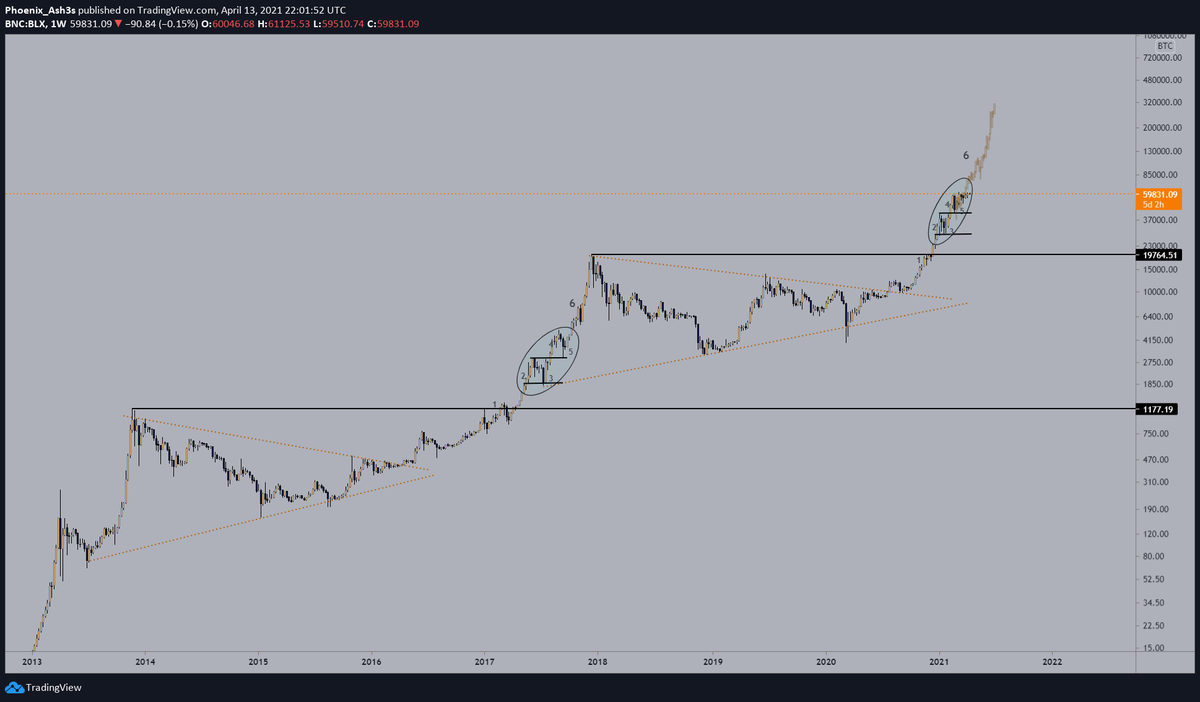 is like the Harakiri" title="32/ Long term estimated viewQuestion yourself. Do you want to short an asset that looks like this or do have you been accumulating dips?Oh no! It’s overbought! Bitcoin stayed overbought on the M for a whole year prev cycles.Betting against #Bitcoin https://abs.twimg.com/hashflags... draggable="false" alt=""> is like the Harakiri" class="img-responsive" style="max-width:100%;"/>
33/ Abbreviations
MA= Moving Average
P/L= Profit/Loss
DCA= Dollar Cost Averaging
MC= Market Cap
TP= Take Profit
#CT= Crypto Twitter
Ath= All time high
HODL= Hold On for Dear Life
R/R= Risk/Reward Ratio
Imo= in my opinion
MA= Moving Average
P/L= Profit/Loss
DCA= Dollar Cost Averaging
MC= Market Cap
TP= Take Profit
#CT= Crypto Twitter
Ath= All time high
HODL= Hold On for Dear Life
R/R= Risk/Reward Ratio
Imo= in my opinion
34/ Resources
While making this thread, I used the following websites:
https://www.lookintobitcoin.com/
https://www.lookintobitcoin.com/">... href=" https://charts.woobull.com/
https://charts.woobull.com/">... href=" https://glassnode.com/
https://glassnode.com/">... href=" https://cryptoquant.com"> https://cryptoquant.com https://decentrader.com/charts/spent-output-profit-ratio-sopr/">https://decentrader.com/charts/sp...
While making this thread, I used the following websites:
https://www.lookintobitcoin.com/
35/ (1/3)
TLDR; Almost every model/metric tells us that there is still plenty of room for growth, tho we crawl towards overheated territory.
Price and model wise it still looks a lot like mid 2017 to me.
TLDR; Almost every model/metric tells us that there is still plenty of room for growth, tho we crawl towards overheated territory.
Price and model wise it still looks a lot like mid 2017 to me.
36/ (2/3) 100K minimum is what I always thought and is highly doable. I do think we will reach 150k+ this cycle.
Don’t get shaken out near bottoms. Take profits along the way. You know the drill.
Stick to your self made plan, let& #39;s make this your year!
Don’t get shaken out near bottoms. Take profits along the way. You know the drill.
Stick to your self made plan, let& #39;s make this your year!
37 (3/3) Currently I’m diving in how to get really close timing the next macro top. Won’t be cocky to say it will work out, but I’m trying to make a good thread and then you can shoot at it.
........
........
Bonus 38/
Working through 100+ pages of notes, so bear with me.
Smash like & retweet as motivation, thanks if you’ve made it here!https://abs.twimg.com/emoji/v2/... draggable="false" alt="🔥" title="Feuer" aria-label="Emoji: Feuer">https://abs.twimg.com/emoji/v2/... draggable="false" alt="🙏" title="Gefaltete Hände" aria-label="Emoji: Gefaltete Hände">
https://abs.twimg.com/emoji/v2/... draggable="false" alt="🔥" title="Feuer" aria-label="Emoji: Feuer">Phoenix outhttps://abs.twimg.com/emoji/v2/... draggable="false" alt="🔥" title="Feuer" aria-label="Emoji: Feuer">
Working through 100+ pages of notes, so bear with me.
Smash like & retweet as motivation, thanks if you’ve made it here!
 https://abs.twimg.com/emoji/v2/... draggable="false" alt="🙏" title="Gefaltete Hände" aria-label="Emoji: Gefaltete Hände">https://abs.twimg.com/emoji/v2/... draggable="false" alt="🔥" title="Feuer" aria-label="Emoji: Feuer">Phoenix outhttps://abs.twimg.com/emoji/v2/... draggable="false" alt="🔥" title="Feuer" aria-label="Emoji: Feuer">" title="Bonus 38/Working through 100+ pages of notes, so bear with me.Smash like & retweet as motivation, thanks if you’ve made it here!https://abs.twimg.com/emoji/v2/... draggable="false" alt="🔥" title="Feuer" aria-label="Emoji: Feuer">https://abs.twimg.com/emoji/v2/... draggable="false" alt="🙏" title="Gefaltete Hände" aria-label="Emoji: Gefaltete Hände">https://abs.twimg.com/emoji/v2/... draggable="false" alt="🔥" title="Feuer" aria-label="Emoji: Feuer">Phoenix outhttps://abs.twimg.com/emoji/v2/... draggable="false" alt="🔥" title="Feuer" aria-label="Emoji: Feuer">" class="img-responsive" style="max-width:100%;"/>


