Yesterday the March Deficit numbers were reported. The 100 million $1,400 stimulus charts blew out the deficit.
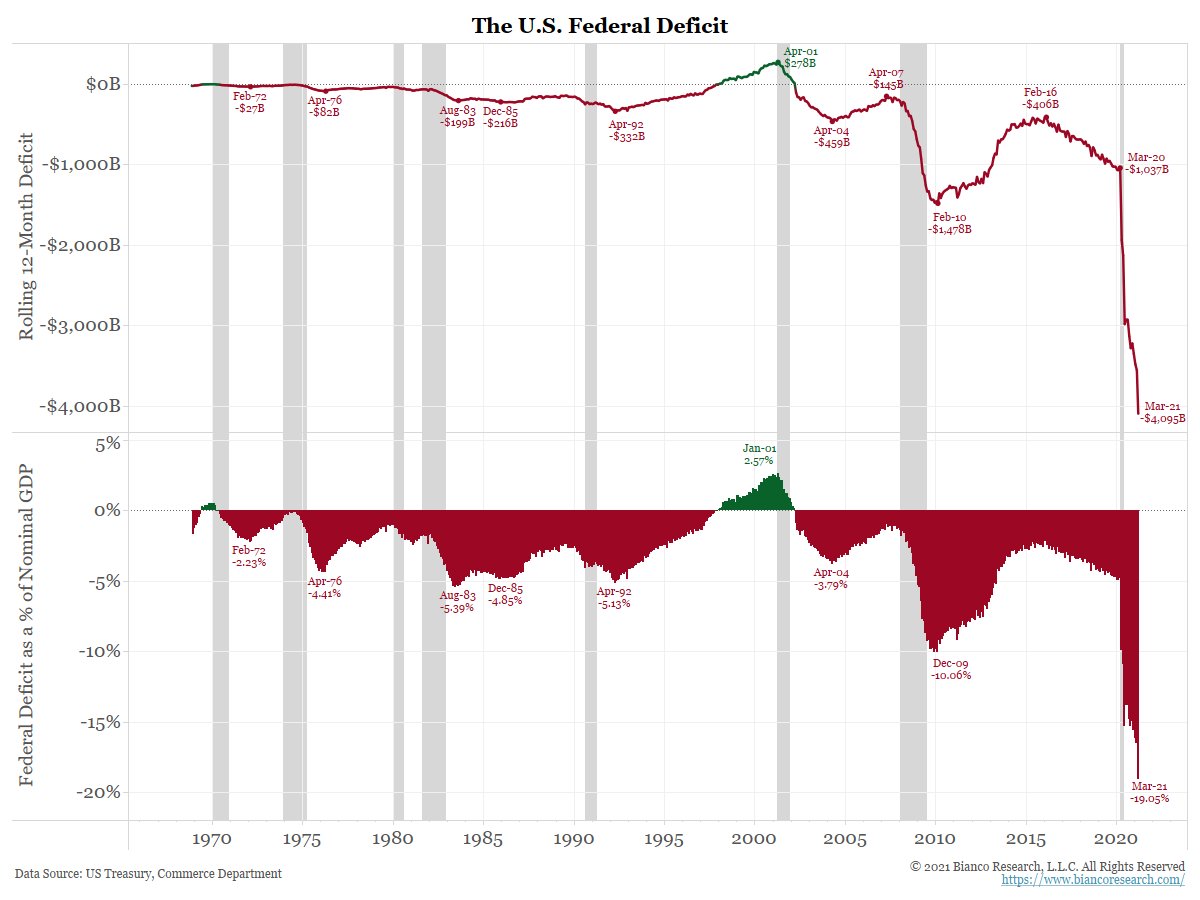
As this chart shows, the last 12-months the deficit was a hard to understand $4+ trillion. As a % of GDP it was an equally hard to understand 19%
(1/5)
As this chart shows, the last 12-months the deficit was a hard to understand $4+ trillion. As a % of GDP it was an equally hard to understand 19%
(1/5)
How big is this deficit?
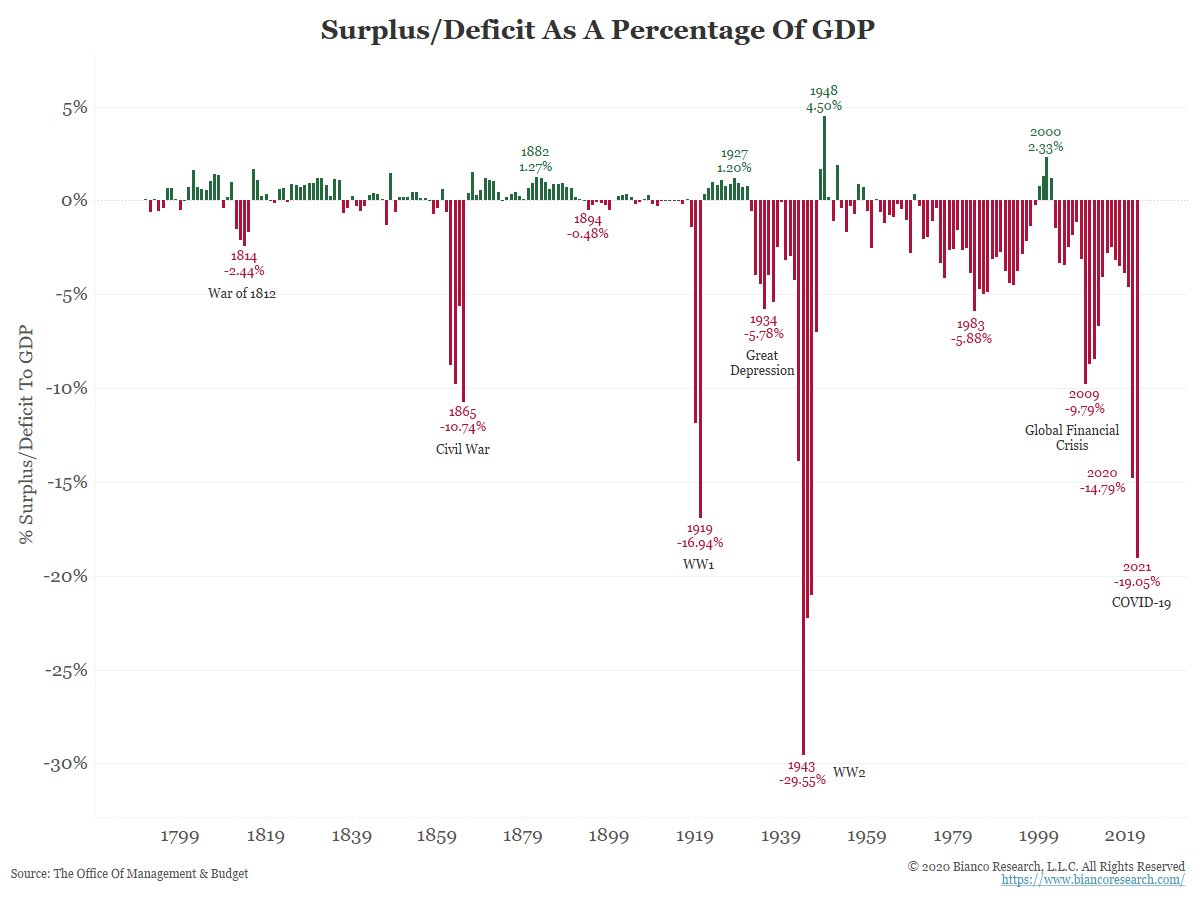
The next chart shows the surplus/deficit as a percentage of GDP for more than 225 years. The current deficit is now the second-highest in history. Only World War II produced a larger deficit.
(2/5)
The next chart shows the surplus/deficit as a percentage of GDP for more than 225 years. The current deficit is now the second-highest in history. Only World War II produced a larger deficit.
(2/5)
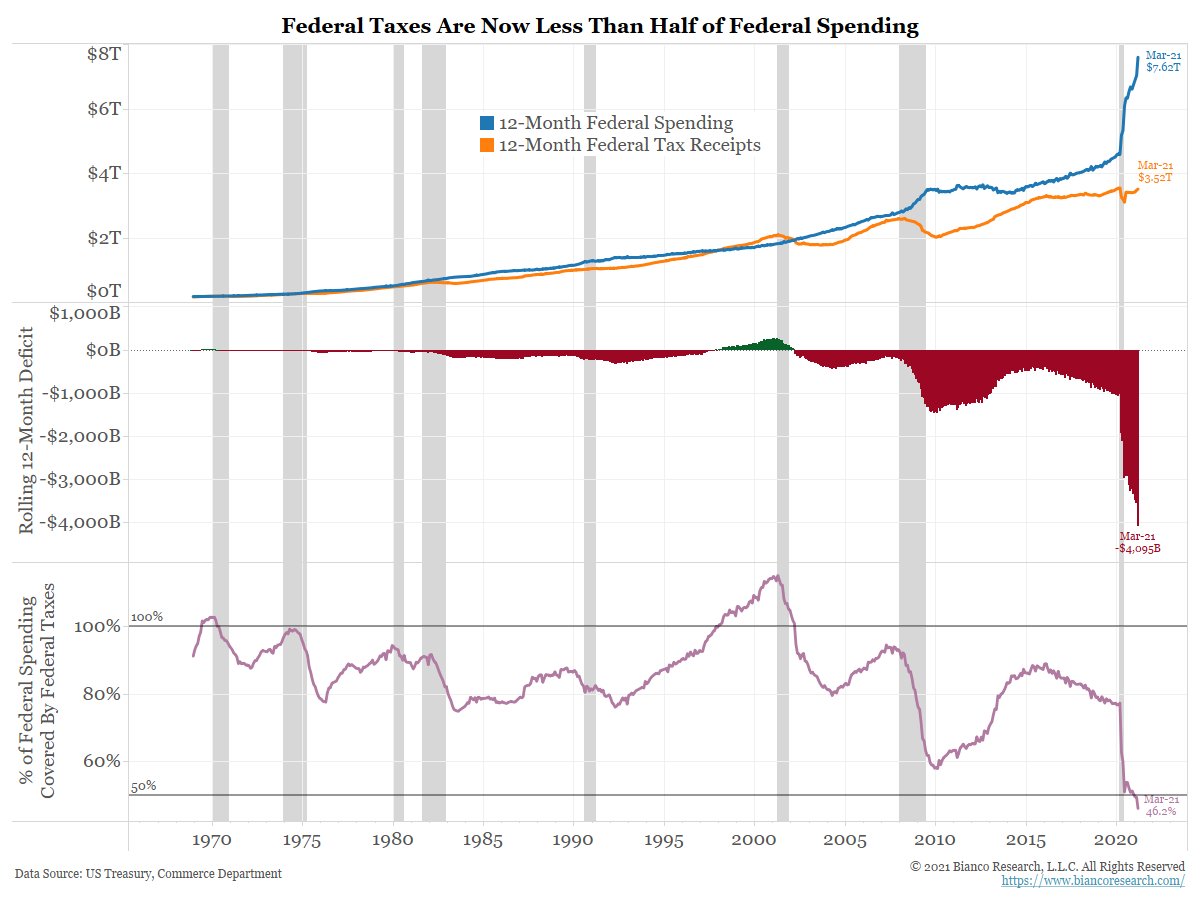
March 2020 hit a milestone of sorts. Only 46% of the rolling 12-month deficit is now financed by taxes (bottom panel).
How did this happen? See the top panel. Spending (blue) has gone vertical and tax receipts (orange) have actually fallen.
(3/5)
How did this happen? See the top panel. Spending (blue) has gone vertical and tax receipts (orange) have actually fallen.
(3/5)
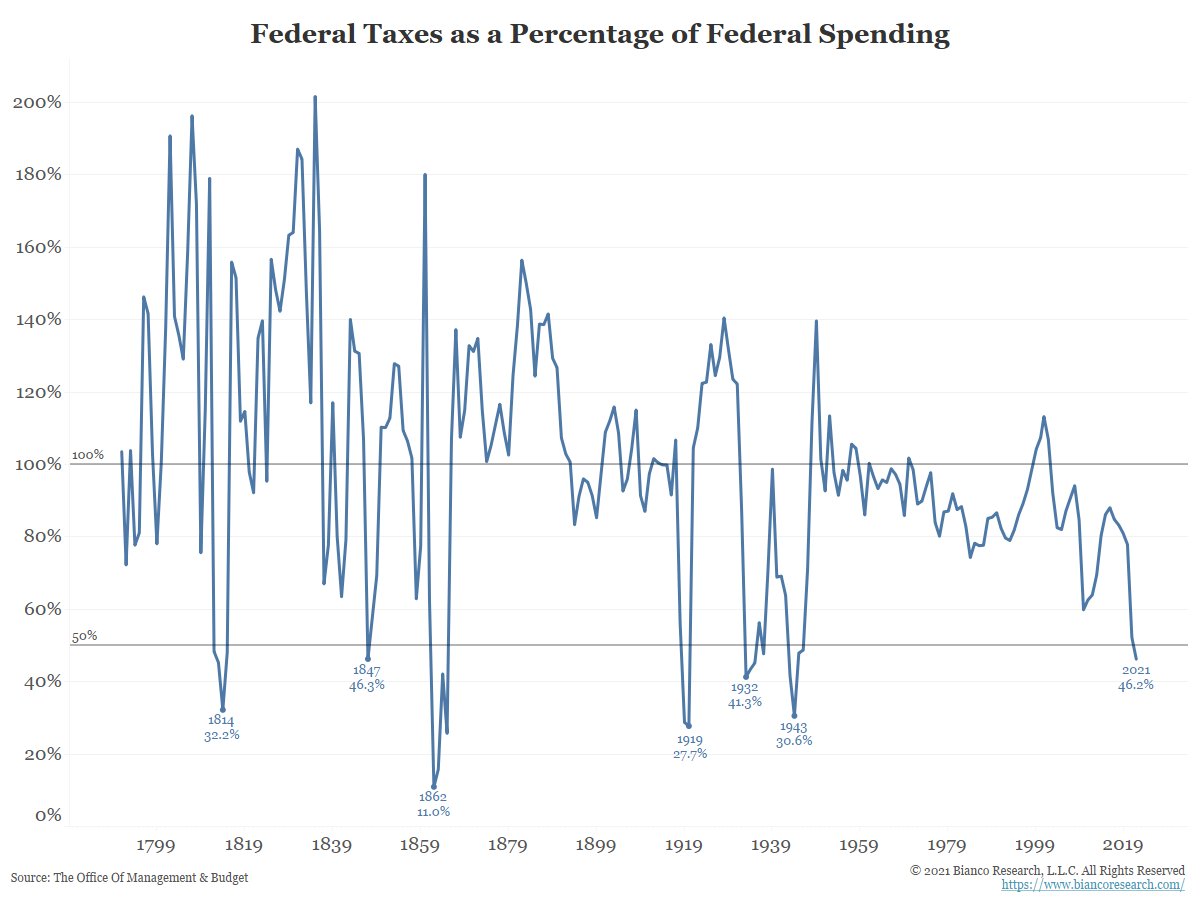
It is rare in American history that taxes cover less than 50% of federal spending. Only WW II (1943), the Great Depression (1932), WW I (1919), the Civil War (1862), and the War of 1812 (1814) were more extreme than the current pandemic period.
(4/5)
(4/5)
So, “what is the point of taxes?”
The charts above suggest they are NOT necessary to finance the government. They now account for less than 50% of government spending for the first time in 75+ years.
At this point the only reason to raise taxes is to punish success.
(5/5)
The charts above suggest they are NOT necessary to finance the government. They now account for less than 50% of government spending for the first time in 75+ years.
At this point the only reason to raise taxes is to punish success.
(5/5)

 Read on Twitter


