The COVKID Project has revamped our data dashboards.
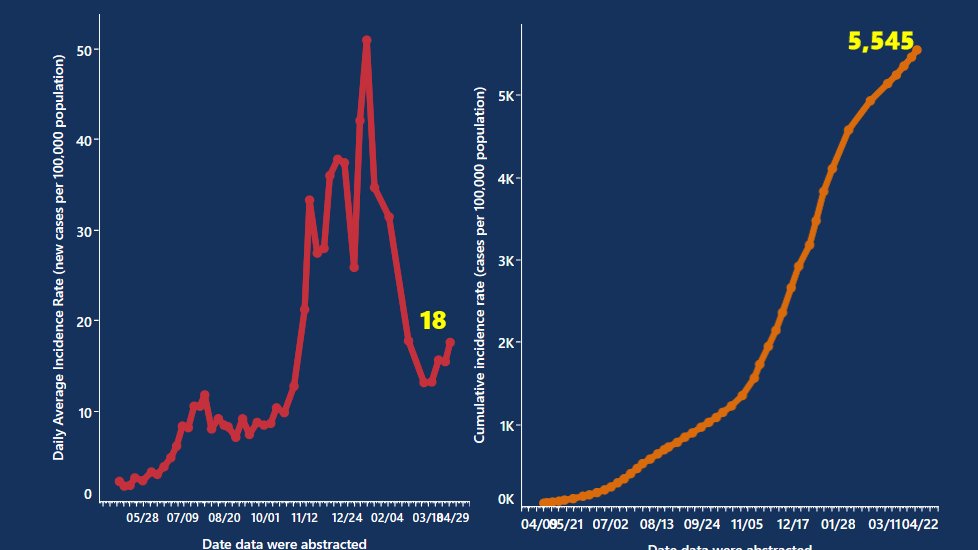
This is what you will see on our landing page: daily average incidence rate (DIR) on the left, and cumulative incidence rate (CIR) on the right.
Yes, #COVID19 is
9-APRIL-21 UPDATE 2/10
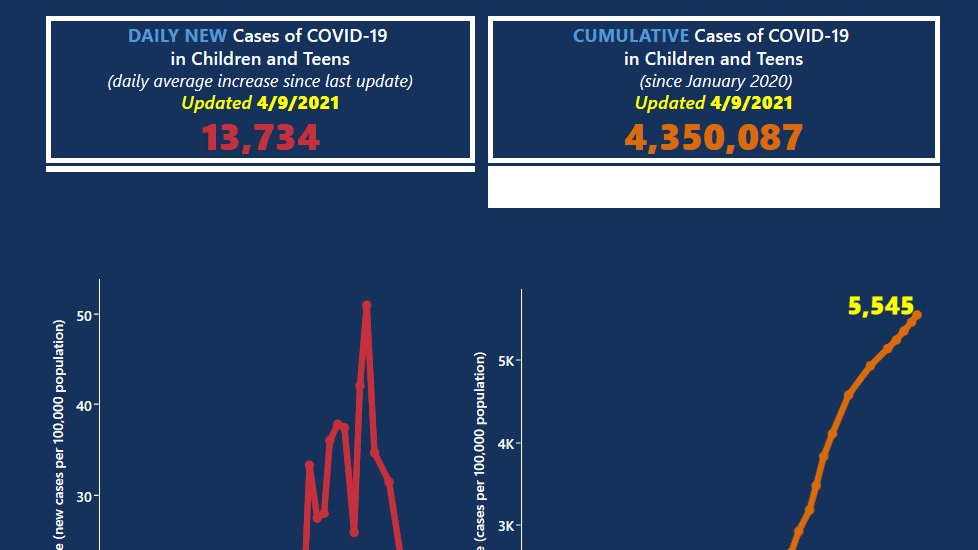
In the 5 days from 4-APRIL to 9-APRIL, there were an average of 13,734 new child/teen #COVID19 cases reported every day.
http://www.covkidproject.org"> http://www.covkidproject.org
In the 5 days from 4-APRIL to 9-APRIL, there were an average of 13,734 new child/teen #COVID19 cases reported every day.
http://www.covkidproject.org"> http://www.covkidproject.org
9-APRIL-21 UPDATE 3/10
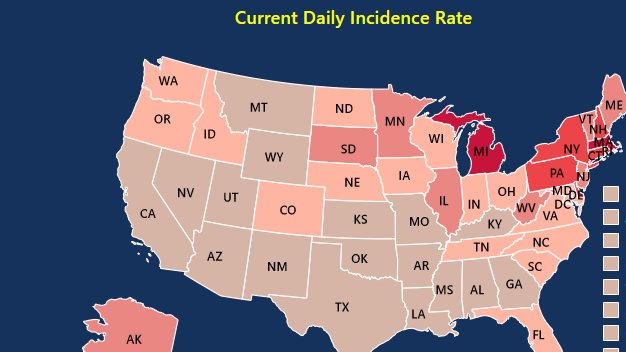
We now display daily #COVID19 incidence rates for kids in every state. State data are organized in regional dashboards.
In #NewEngland, #RhodeIsland has the highest CIR, but #Massachusetts kids are suffering the highest DIR.
http://www.covkidproject.org"> http://www.covkidproject.org
We now display daily #COVID19 incidence rates for kids in every state. State data are organized in regional dashboards.
In #NewEngland, #RhodeIsland has the highest CIR, but #Massachusetts kids are suffering the highest DIR.
http://www.covkidproject.org"> http://www.covkidproject.org
9-APRIL-21 UPDATE 4/10
#COVID19 hospitalization data for kids are temporarily offline. We will be updating with new metrics soon.
We were saddened to learn that @vps_llc will no longer update its excellent COVID-19 dashboard of child pediatric intensive care data.
#PedsICU
#COVID19 hospitalization data for kids are temporarily offline. We will be updating with new metrics soon.
We were saddened to learn that @vps_llc will no longer update its excellent COVID-19 dashboard of child pediatric intensive care data.
#PedsICU
9-APRIL-21 UPDATE 5/10
 https://abs.twimg.com/emoji/v2/... draggable="false" alt="❗️" title="Rotes Ausrufezeichen" aria-label="Emoji: Rotes Ausrufezeichen">
 https://abs.twimg.com/emoji/v2/... draggable="false" alt="❗️" title="Rotes Ausrufezeichen" aria-label="Emoji: Rotes Ausrufezeichen">
 https://abs.twimg.com/emoji/v2/... draggable="false" alt="❗️" title="Rotes Ausrufezeichen" aria-label="Emoji: Rotes Ausrufezeichen">NEW HOT SPOTS DASHBOARD
 https://abs.twimg.com/emoji/v2/... draggable="false" alt="❗️" title="Rotes Ausrufezeichen" aria-label="Emoji: Rotes Ausrufezeichen">
 https://abs.twimg.com/emoji/v2/... draggable="false" alt="❗️" title="Rotes Ausrufezeichen" aria-label="Emoji: Rotes Ausrufezeichen">
 https://abs.twimg.com/emoji/v2/... draggable="false" alt="❗️" title="Rotes Ausrufezeichen" aria-label="Emoji: Rotes Ausrufezeichen">
Maps and daily incidence rate (DIR) trends for the latest #COVID19 hot spots for kids.
Hint: It& #39;s not just #Michigan
#epitwitter #PedsICU http://www.covkidproject.org/hot-spots ">https://www.covkidproject.org/hot-spots...
Maps and daily incidence rate (DIR) trends for the latest #COVID19 hot spots for kids.
Hint: It& #39;s not just #Michigan
#epitwitter #PedsICU http://www.covkidproject.org/hot-spots ">https://www.covkidproject.org/hot-spots...
9-APRIL-21 UPDATE 6/10
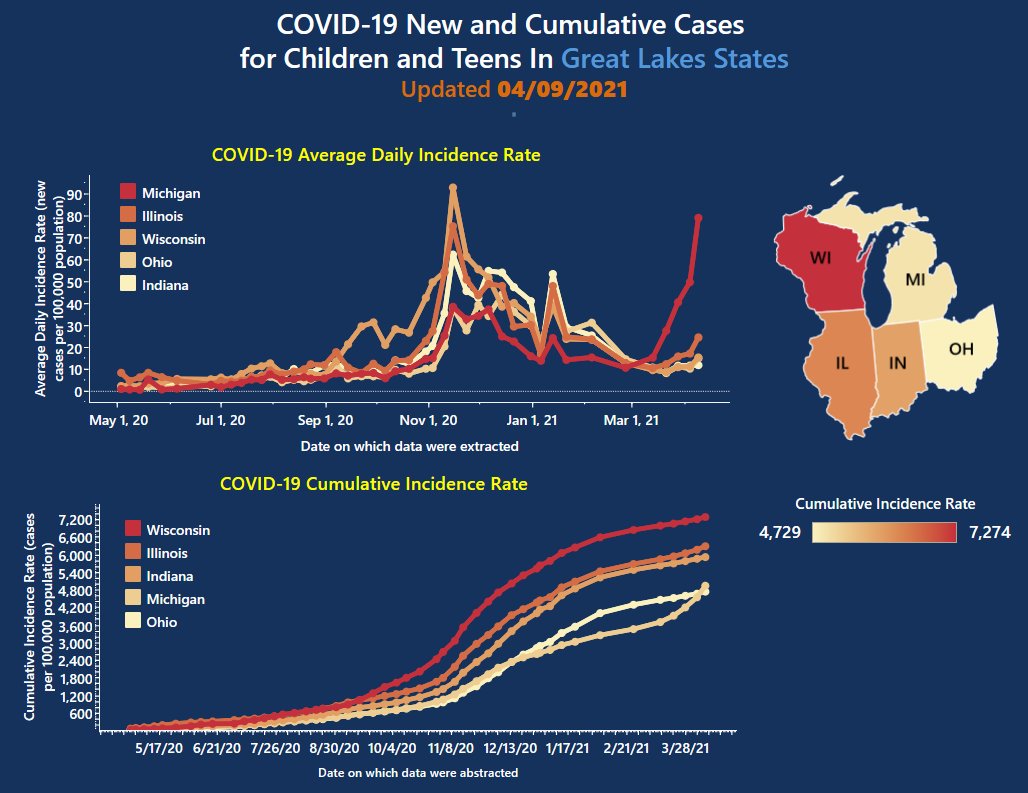
#GreatLakes region - #Michigan kids are suffering the worst surge in #COVID19, but #Illinois, #Wisconsin, #Ohio are https://abs.twimg.com/emoji/v2/... draggable="false" alt="⬆️" title="Pfeil nach oben" aria-label="Emoji: Pfeil nach oben">too.
http://www.covkidproject.org"> http://www.covkidproject.org
#GreatLakes region - #Michigan kids are suffering the worst surge in #COVID19, but #Illinois, #Wisconsin, #Ohio are
http://www.covkidproject.org"> http://www.covkidproject.org
9-APRIL-21 UPDATE 7/10
State #COVID19 data for kids are organized into 8 regions ( @BEA_News regions):
#NewEngland
#Mideast
#GreatLakes
#Plains
#Southeast
#Southwest
#RockyMountain
#FarWest http://www.covkidproject.org"> http://www.covkidproject.org
State #COVID19 data for kids are organized into 8 regions ( @BEA_News regions):
#NewEngland
#Mideast
#GreatLakes
#Plains
#Southeast
#Southwest
#RockyMountain
#FarWest http://www.covkidproject.org"> http://www.covkidproject.org
9-APRIL-2021 UPDATE 8/10
Last week the highest #COVID19 DIRs were in #NewEngland, the #Mideast, and #GreatLakes states. If #VariantsOfConcern are the reason, we should expect new surges among young people in the South and West in coming weeks.
http://www.covkidproject.org/hot-spots ">https://www.covkidproject.org/hot-spots...
9-APRIL-21 UPDATE 9/10
Our dashboards will be updated with new #COVID19 data for kids every FRIDAY.
These data come directly from every state health department. We are grateful for the tremendous efforts of frontline #publichealth workers.
@astho @CSTEnews @PublicHealth
Our dashboards will be updated with new #COVID19 data for kids every FRIDAY.
These data come directly from every state health department. We are grateful for the tremendous efforts of frontline #publichealth workers.
@astho @CSTEnews @PublicHealth
9-APRIL-21 UPDATE 10/10
Please share this thread on #COVID19 in kids with your followers:
@Cleavon_MD @DrZoeHyde @DrKeilaLopez @EricTopol @DrEricDing @SapnaKmd @drkomanduri @yoncabulutmd @Arrianna_Planey @CT_Bergstrom @COVID19Tracking @COVIDBLK @gregggonsalves
Please share this thread on #COVID19 in kids with your followers:
@Cleavon_MD @DrZoeHyde @DrKeilaLopez @EricTopol @DrEricDing @SapnaKmd @drkomanduri @yoncabulutmd @Arrianna_Planey @CT_Bergstrom @COVID19Tracking @COVIDBLK @gregggonsalves

 Read on Twitter
 https://abs.twimg.com/emoji/v2/... draggable="false" alt="❗️" title="Rotes Ausrufezeichen" aria-label="Emoji: Rotes Ausrufezeichen"> MAJOR UPDATE https://abs.twimg.com/emoji/v2/... draggable="false" alt="❗️" title="Rotes Ausrufezeichen" aria-label="Emoji: Rotes Ausrufezeichen">https://abs.twimg.com/emoji/v2/... draggable="false" alt="❗️" title="Rotes Ausrufezeichen" aria-label="Emoji: Rotes Ausrufezeichen"> 9-APRIL-21 1/10The COVKID Project has revamped our data dashboards. This is what you will see on our landing page: daily average incidence rate (DIR) on the left, and cumulative incidence rate (CIR) on the right.Yes, #COVID19 is https://abs.twimg.com/emoji/v2/... draggable="false" alt="⬆️" title="Pfeil nach oben" aria-label="Emoji: Pfeil nach oben"> in USA kids." title="https://abs.twimg.com/emoji/v2/... draggable="false" alt="❗️" title="Rotes Ausrufezeichen" aria-label="Emoji: Rotes Ausrufezeichen">https://abs.twimg.com/emoji/v2/... draggable="false" alt="❗️" title="Rotes Ausrufezeichen" aria-label="Emoji: Rotes Ausrufezeichen"> MAJOR UPDATE https://abs.twimg.com/emoji/v2/... draggable="false" alt="❗️" title="Rotes Ausrufezeichen" aria-label="Emoji: Rotes Ausrufezeichen">https://abs.twimg.com/emoji/v2/... draggable="false" alt="❗️" title="Rotes Ausrufezeichen" aria-label="Emoji: Rotes Ausrufezeichen"> 9-APRIL-21 1/10The COVKID Project has revamped our data dashboards. This is what you will see on our landing page: daily average incidence rate (DIR) on the left, and cumulative incidence rate (CIR) on the right.Yes, #COVID19 is https://abs.twimg.com/emoji/v2/... draggable="false" alt="⬆️" title="Pfeil nach oben" aria-label="Emoji: Pfeil nach oben"> in USA kids." class="img-responsive" style="max-width:100%;"/>


 too. http://www.covkidproject.org " title="9-APRIL-21 UPDATE 6/10 #GreatLakes region - #Michigan kids are suffering the worst surge in #COVID19, but #Illinois, #Wisconsin, #Ohio are https://abs.twimg.com/emoji/v2/... draggable="false" alt="⬆️" title="Pfeil nach oben" aria-label="Emoji: Pfeil nach oben">too. http://www.covkidproject.org " class="img-responsive" style="max-width:100%;"/>


